AMD Athlon 64 X2 5000+ vs Intel Core 2 Duo P8600
|
|
|
|
|
AMD Athlon 64 X2 5000+ vs Intel Core 2 Duo P8600
Comparison of the technical characteristics between the processors, with the AMD Athlon 64 X2 5000+ on one side and the Intel Core 2 Duo P8600 on the other side. The first is dedicated to the desktop sector, It has 2 cores, 2 threads, a maximum frequency of 2,6GHz. The second is used on the mid-range laptop segment, it has a total of 2 cores, 2 threads, its turbo frequency is set to 2,4 GHz. The following table also compares the lithography, the number of transistors (if indicated), the amount of cache memory, the maximum RAM memory capacity, the type of memory accepted, the release date, the maximum number of PCIe lanes, the values obtained in Geekbench 4 and Cinebench R15.
Note: Commissions may be earned from the links above.
This page contains references to products from one or more of our advertisers. We may receive compensation when you click on links to those products. For an explanation of our advertising policy, please visit this page.
Specifications:
| Processor | AMD Athlon 64 X2 5000+ | Intel Core 2 Duo P8600 | ||||||
| Market (main) | Desktop | Mid-range laptop | ||||||
| ISA | x86-64 (64 bit) | x86-64 (64 bit) | ||||||
| Microarchitecture | K8 | Penryn | ||||||
| Core name | Brisbane | Penryn-3M | ||||||
| Family | Athlon 64 X2 5000 | Core 2 Duo 8000 | ||||||
| Part number(s), S-Spec | ADO5000DOBOX, ADO5000IAA5DO |
AV80577SH0563M, QHWC, SLB4N, SLGDZ |
||||||
| Release date | Q3 2008 | Q3 2008 | ||||||
| Lithography | 65 nm | 45 nm | ||||||
| Transistors | 221. 000.000 000.000 |
410.000.000 | ||||||
| Cores | 2 | 2 | ||||||
| Threads | 2 | 2 | ||||||
| Base frequency | 2,6 GHz | 2,4 GHz | ||||||
| Turbo frequency | — | — | ||||||
| Cache memory | 1 MB | 3 MB | ||||||
| Max memory capacity | 8 GB | 8 GB | ||||||
| Memory types | DDR2-800 | DDR2-800 | ||||||
| Max PCIe lanes | 16 | 16 | ||||||
| TDP | 65 W | 25 W | ||||||
| Suggested PSU | 600W ATX Power Supply | — | ||||||
| GPU integrated graphics | None | None | ||||||
| Socket | AM2 | PGA478, BGA479 | ||||||
| Compatible motherboard | Socket AM2 Motherboard | — | ||||||
| Maximum temperature | 68°C | 105°C | ||||||
| Security | Enhanced Virus Protection | Trusted Execution Technology, Execute Disable Bit |
||||||
| CPU-Z single thread | 88 | 197 | ||||||
| CPU-Z multi thread | 164 | 409 | ||||||
| Cinebench R15 single thread | 62 | 65 | ||||||
| Cinebench R15 multi-thread | 115 | 123 | ||||||
| PassMark single thread | 881 | 940 | ||||||
| PassMark CPU Mark | 757 | 842 | ||||||
| (Windows 64-bit) Geekbench 4 single core |
1. 243 243 |
1.512 | ||||||
| (Windows 64-bit) Geekbench 4 multi-core |
2.069 | 2.400 | ||||||
| (Windows) Geekbench 5 single core |
217 | 336 | ||||||
| (Windows) Geekbench 5 multi-core |
397 | 590 | ||||||
| (SGEMM) GFLOPS performance |
11,5 GFLOPS | 22,6 GFLOPS | ||||||
| (Multi-core / watt performance) Performance / watt ratio |
32 pts / W | 96 pts / W | ||||||
| Amazon | ||||||||
| eBay |
Note: Commissions may be earned from the links above.
We can better compare what are the technical differences between the two processors.
Suggested PSU: We assume that we have An ATX computer case, a high end graphics card, 16GB RAM, a 512GB SSD, a 1TB HDD hard drive, a Blu-Ray drive. We will have to rely on a more powerful power supply if we want to have several graphics cards, several monitors, more memory, etc.
Price: For technical reasons, we cannot currently display a price less than 24 hours, or a real-time price. This is why we prefer for the moment not to show a price. You should refer to the respective online stores for the latest price, as well as availability.
We see that the two processors have an equivalent number of cores, the maximum frequency of AMD Athlon 64 X2 5000+ is greater, that the thermal dissipation power of Intel Core 2 Duo P8600 is less. Both were produced in the same year.
Performances :
Performance comparison between the two processors, for this we consider the results generated on benchmark software such as Geekbench 4.
| CPU-Z — Multi-thread & single thread score | |
|---|---|
| Intel Core 2 Duo P8600 |
197 409 |
| AMD Athlon 64 X2 5000+ |
88 164 |
In single core, the difference is 124%. In multi-core, the difference in terms of gap is 149%.
Note: Commissions may be earned from the links above. These scores are only an
average of the performances got with these processors, you may get different results.
CPU-Z is a system information software that provides the name of the processor, its model number, the codename, the cache levels, the package, the process. It can also gives data about the mainboard, the memory. It makes real time measurement, with finally a benchmark for the single thread, as well as for the multi thread.
| Cinebench R15 — Multi-thread & single thread score | |
|---|---|
| Intel Core 2 Duo P8600 |
65 123 |
| AMD Athlon 64 X2 5000+ |
62 115 |
In single core, the difference is 5%. In multi-core, the difference in terms of gap is 7%.
Note: Commissions may be earned from the links above. These scores are only an
average of the performances got with these processors, you may get different results.
Cinebench R15 evaluates the performance of CPU calculations by restoring a photorealistic 3D scene. The scene has 2,000 objects, 300,000 polygons, uses sharp and fuzzy reflections, bright areas, shadows, procedural shaders, antialiasing, and so on. The faster the rendering of the scene is created, the more powerful the PC is, with a high number of points.
| PassMark — CPU Mark & single thread | |
|---|---|
| Intel Core 2 Duo P8600 |
940 842 |
| AMD Athlon 64 X2 5000+ |
881 757 |
In single core, the difference is 7%. In multi-core, the difference in terms of gap is 11%.
Note: Commissions may be earned from the links above. These scores are only an
average of the performances got with these processors, you may get different results.
PassMark is a benchmarking software that performs several performance tests including prime numbers, integers, floating point, compression, physics, extended instructions, encoding, sorting. The higher the score is, the higher is the device capacity.
On Windows 64-bit:
| Geekbench 4 — Multi-core & single core score — Windows 64-bit | |
|---|---|
| Intel Core 2 Duo P8600 |
1.512 2.400 |
| AMD Athlon 64 X2 5000+ |
1.243 2.069 |
In single core, the difference is 22%. In multi-core, the difference in terms of gap is 16%.
Note: Commissions may be earned from the links above. These scores are only an
average of the performances got with these processors, you may get different results.
Geekbench 4 is a complete benchmark platform with several types of tests, including data compression, images, AES encryption, SQL encoding, HTML, PDF file rendering, matrix computation, Fast Fourier Transform, 3D object simulation, photo editing, memory testing. This allows us to better visualize the respective power of these devices. For each result, we took an average of 250 values on the famous benchmark software.
On Windows:
| Geekbench 5 — Multi-core & single core score — Windows | |
|---|---|
| Intel Core 2 Duo P8600 |
336 590 |
| AMD Athlon 64 X2 5000+ |
217 397 |
In single core, the difference is 55%. In multi-core, the difference in terms of gap is 49%.
On Linux:
| Geekbench 5 — Multi-core & single core score — Linux | |
|---|---|
| Intel Core 2 Duo P8600 |
367 605 |
| AMD Athlon 64 X2 5000+ |
249 450 |
In single core, the difference is 47%. In multi-core, the difference in terms of gap is 34%.
Note: Commissions may be earned from the links above. These scores are only an
average of the performances got with these processors, you may get different results.
Geekbench 5 is a software for measuring the performance of a computer system, for fixed devices, mobile devices, servers. This platform makes it possible to better compare the power of the CPU, the computing power and to compare it with similar or totally different systems. Geekbench 5 includes new workloads that represent work tasks and applications that we can find in reality.
Equivalence:
AMD Athlon 64 X2 5000+ Intel equivalentIntel Core 2 Duo P8600 AMD equivalent
Comparison Intel Core 2 Duo U7600 vs AMD Athlon 64 X2 5200+ what is better?
Home / CPU / Intel Core 2 Duo U7600 vs AMD Athlon 64 X2 5200+
Intel Core 2 Duo U7600
2%
DeviceList score
vs
AMD Athlon 64 X2 5200+
1%
DeviceList score
We compared the characteristics of Intel Core 2 Duo U7600 and AMD Athlon 64 X2 5200+ and compiled a list of advantages and a comparison table for you. Find out which one to choose in 2022 year.
Intel Core 2 Duo U7600 benefits
Winner in comparison
|
Manufacturing process technology |
|
65 nm -25 nm (-27.8%) better
vs
90 nm
|
|
Transistor count |
|
291 million 137 million (89%) better
vs
154 million
|
|
Power Consumption (TDP) |
|
10 Wt -79 Wt (-88.
vs
89 Wt
|
 8%) better
AMD Athlon 64 X2 5200+ benefits
|
Maximum frequency |
|
2.7 GGz 1.5 GGz (125%) better
vs
1.2 GGz
|
|
Passmark |
|
767 425 (124.3%) better
vs
342
|
| General information | |
|
Type |
|
|
Architecture codename |
|
| Merom-2048 | Windsor |
|
Number of cores A large number of cores improves performance in multithreaded applications. |
|
| 2 | 2 |
|
Number of threads More threads help the cores process information more efficiently. Real performance will be noticeable in very specific tasks (video editing, databases). |
|
| 2 | 2 |
|
Manufacturing process technology |
|
| 65 nm
-25 nm (-27.8%) better
|
90 nm |
|
Crystal size |
|
| 143 2 | 220 2 |
|
Transistor count |
|
| 291 million
137 million (89%) better
|
154 million |
|
Maximum frequency Processors with high clock speeds perform more calculations per second and thus provide better performance. |
|
| 1.2 GGz | 2.7 GGz
1.5 GGz (125%) better
|
|
64 bit support |
|
|
Max number of CPUs in a configuration |
|
| 1 | 1 |
|
Socket |
|
| PBGA479 | AM2 |
|
Series |
|
| Intel Core 2 Duo | no data |
|
Price-quality ratio The sum of all the advantages of the device divided by its price. The higher the%, the better the quality per unit price in comparison with all analogues. |
|
| no data | 94.5 % |
|
Bus |
|
| 533 | no data |
|
Maximum core temperature |
|
| 100 °C | no data |
|
TXT Intel Trusted Execution Technology for hardware protection against malware. |
|
|
Demand Based Switching |
|
| — | no data |
|
FSB |
|
| — | no data |
|
L1 Cache More threads help the cores process information more efficiently. Real performance will be noticeable in very specific tasks (video editing, databases). |
|
| 64 | 256 |
|
L2 Cache |
|
| 2 | 512K |
|
Power Consumption (TDP) The calculated heat output shows the average heat output in operation under load,
|
|
| 10 Wt
-79 Wt (-88.8%) better
|
89 Wt |
|
EDB |
|
| + | no data |
|
Permissible core voltage |
|
| 0.8V-0.975V | no data |
 For each protected program, the processor allocates its own isolated section of RAM.
| Benchmarks | |
|
Passmark |
|
| 342 | 767
425 (124.3%) better
|
|
Cinebench 10 32-bit single-core |
|
| 1263 | no data |
|
Cinebench 10 32-bit multi-core |
|
| 2289 | no data |
|
3DMark06 CPU |
|
| 1008 | no data |
| Technologies and extensions | |
|
Turbo Boost |
|
| — | no data |
|
Idle States |
|
|
Enhanced SpeedStep (EIST) More threads help the cores process information more efficiently. |
|
|
Hyper-Threading More threads help the cores process information more efficiently. Real performance will be noticeable in very specific tasks (video editing, databases). |
|
 Real performance will be noticeable in very specific tasks (video editing, databases).
| RAM parameters |
| Virtualization technologies | |
|
VT-x |
|
| Graphics specifications |
Comparison Intel Core 2 Duo E6550 vs AMD Athlon 64 X2 6000+ what is better?
Home / CPU / Intel Core 2 Duo E6550 vs AMD Athlon 64 X2 6000+
Intel Core 2 Duo E6550
1%
DeviceList score
vs
AMD Athlon 64 X2 6000+
2%
DeviceList score
We compared the characteristics of Intel Core 2 Duo E6550 and AMD Athlon 64 X2 6000+ and compiled a list of advantages and a comparison table for you. Find out which one to choose in 2022 year.
Intel Core 2 Duo E6550 benefits
|
Manufacturing process technology |
|
65 nm -25 nm (-27.8%) better
vs
90 nm
|
|
Transistor count |
|
291 million 64 million (28.2%) better
vs
227 million
|
|
Power Consumption (TDP) |
|
65 Wt -60 Wt (-48%) better
vs
125 Wt
|
AMD Athlon 64 X2 6000+ benefits
Winner in comparison
|
Maximum frequency |
|
3.1 GGz 0.
vs
2.33 GGz
|
|
Price-quality ratio |
|
97.3 % 5.3 % (5.8%) better
vs
92 %
|
|
Passmark |
|
995 120 (13.7%) better
vs
875
|
 77 GGz (33%) better
| General information | |
|
Type |
|
|
Architecture codename |
|
| Conroe | Windsor |
|
Number of cores A large number of cores improves performance in multithreaded applications.
|
|
| 2 | 2 |
|
Number of threads More threads help the cores process information more efficiently. Real performance will be noticeable in very specific tasks (video editing, databases). |
|
| 2 | 2 |
|
Manufacturing process technology |
|
| 65 nm
-25 nm (-27.8%) better
|
90 nm |
|
Crystal size |
|
| 143 2 | 220 2 |
|
Transistor count |
|
| 291 million
64 million (28.2%) better
|
227 million |
|
Maximum frequency Processors with high clock speeds perform more calculations per second and thus provide better performance. |
|
| 2.33 GGz | 3.1 GGz
0.77 GGz (33%) better
|
|
64 bit support |
|
|
Max number of CPUs in a configuration |
|
| 1 | 1 |
|
Socket |
|
| PLGA775 | AM2 |
|
Price-quality ratio The sum of all the advantages of the device divided by its price. The higher the%, the better the quality per unit price in comparison with all analogues. |
|
| 92 % | 97.3 %
5.3 % (5.8%) better
|
|
Maximum core temperature |
|
| 72 °C | no data |
|
TXT Intel Trusted Execution Technology for hardware protection against malware. |
|
|
Demand Based Switching |
|
| — | no data |
|
FSB |
|
| — | no data |
|
L1 Cache More threads help the cores process information more efficiently. Real performance will be noticeable in very specific tasks (video editing, databases). |
|
| 64 | 256 |
|
L2 Cache |
|
| 4 | 512K |
|
Power Consumption (TDP) The calculated heat output shows the average heat output in operation under load,
|
|
| 65 Wt
-60 Wt (-48%) better
|
125 Wt |
|
EDB |
|
| + | no data |
|
Permissible core voltage |
|
| 0.85V-1.5V | no data |
 For each protected program, the processor allocates its own isolated section of RAM.
| Benchmarks | |
|
Passmark |
|
| 875 | 995
120 (13.7%) better
|
| Technologies and extensions | |
|
Turbo Boost |
|
| — | no data |
|
Idle States |
|
|
Enhanced SpeedStep (EIST) More threads help the cores process information more efficiently. |
|
|
Thermal Monitoring |
|
|
Hyper-Threading More threads help the cores process information more efficiently. Real performance will be noticeable in very specific tasks (video editing, databases). |
|
 Real performance will be noticeable in very specific tasks (video editing, databases).
| RAM parameters | |
|
Supported memory types |
|
| DDR1, DDR2, DDR3 | no data |
| Virtualization technologies | |
|
VT-x |
|
| Graphics specifications |
Intel vs.
 AMD: Today’s generation compared
I SUPPOSE YOU COULD SAY we’ve conducted plenty of CPU reviews in our time, but we just can’t bring ourselves to slow things down. The release of Windows Vista and a round of price cuts by AMD prompted us to hatch a devious plan involving Vista, a new test suite full of multithreaded and 64-bit applications, fifteen different CPU configurations, and countless hours of lab testing. That plan has come to fruition in the form of a broad-based comparison of the latest processors from AMD and Intel, ranging from well under $200 to a cool grand, from two slow CPU cores to four fast ones, from the lowly Athlon 64 X2 4400+ and Core 2 Duo E6300 to the astounding Athlon 64 FX-74 and Core 2 Extreme QX6700.
So, how do the latest processors stack up in Windows Vista? Will a sub-$200 CPU suffice for your needs? Have price cuts allowed the Athlon 64 to catch up to the Core 2 Duo in terms of price-performance? What about power consumption and energy efficiency? Can any of these processors stand up under the weight of killer new games like Supreme Commander? Can I possibly squeeze any more questions into one paragraph? Keep reading for answers to all of these questions and more.
The matchups
The setup for this one is fairly simple. We’re directly comparing processors from Intel at AMD at a range of price points. Intel has had a lock on the overall performance lead since the Core 2 Duo first hit the scene, but AMD has made clear its intention to maintain a competitive price-performance ratio. To do so, AMD will have to meet or beat each of the processors in Intel’s current desktop lineup, which looks like so:
| Model | Clock speed | Cores | L2 cache (total) | Fab process | TDP | Price |
| Core 2 Duo E6300 | 1.83GHz | 2 | 2MB | 65nm | 65W | $183 |
| Core 2 Duo E6400 | 2. 13GHz 13GHz |
2 | 2MB | 65nm | 65W | $224 |
| Core 2 Duo E6600 | 2.4GHz | 2 | 4MB | 65nm | 65W | $316 |
| Core 2 Duo E6700 | 2.66GHz | 2 | 4MB | 65nm | 65W | $530 |
| Core 2 Extreme X6800 | 2. 93GHz 93GHz |
2 | 4MB | 65nm | 75W | $999 |
| Core 2 Quad Q6600 | 2.4GHz | 4 | 8MB | 65nm | 105W | $851 |
| Core 2 Extreme QX6700 | 2.66GHz | 4 | 8MB | 65nm | 130W | $999 |
Intel does offer lower cost options like the Core 2 Duo E4300 and its Celeron value-oriented processors, but our list includes the meat of the lineup.
AMD, on the other hand, offers a dizzying array of Athlon 64 X2 models, from 3600+ to 6000+, generally in increments of 200 (or is it 200+?). Not only that, but AMD often sells multiple products under the same performance-related model number, just to keep smug members of the general public from becoming overconfident. For instance, the Athlon 64 X2 4400+ comes in a 90nm “Toledo” flavor that runs at 2.2GHz, has 1MB of L2 cache per core, and is intended for Socket 939 motherboards. The X2 4400+ also comes in the form of a 65nm chip code-named “Brisbane” that runs at 2.3GHz, has 512K of L2 per core, and slips into Socket AM2 mobos. Several of these featuresfab process, clock frequency, cache size, and socket/memory typemay vary within the same model number.
With that said, we’ve chosen the following members of the Athlon 64 lineup as the most direct competitors to their Core 2 counterparts. Because we live in the now, all of these are newer-style Socket AM2 processors:
| Model | Clock speed | Cores | L2 cache (total) | Fab process | TDP | Price |
| Athlon 64 X2 4400+ | 2. 3GHz 3GHz |
2 | 1MB | 65nm | 65W | $170 |
| Athlon 64 X2 5000+ | 2.6GHz | 2 | 1MB | 65nm | 65W | $222 |
| Athlon 64 X2 5600+ | 2.8GHz | 2 | 2MB | 90nm | 89W | $326 |
| Athlon 64 X2 6000+ | 3. 0GHz 0GHz |
2 | 2MB | 90nm | 125W | $459 |
| Athlon 64 FX-70 | 2.6GHz | 4 | 4MB | 90nm | 125W x 2 | $599 |
| Athlon 64 FX-72 | 2.8GHz | 4 | 4MB | 90nm | 125W x 2 | $799 |
| Athlon 64 FX-74 | 3. 0GHz 0GHz |
4 | 4MB | 90nm | 125W x 2 | $999 |
As you can see, AMD has a fairly direct answer for most members of the Core 2 range. Things start to get shaky at the high end, where the Athlon 64’s lower performance takes its toll. The Athlon 64 X2 6000+ sells at a discount versus the Core 2 Duo E6700, and AMD has no answer to the Core 2 Extreme X6800, Intel’s fastest dual-core processor. If you match up the two product lines against one another, the results look something like this:
| Model | Price | Model | Price |
| Core 2 Duo E6300 | $183 | Athlon 64 X2 4400+ | $170 |
| Core 2 Duo E6400 | $224 | Athlon 64 X2 5000+ | $222 |
| Core 2 Duo E6600 | $316 | Athlon 64 X2 5600+ | $326 |
| Core 2 Duo E6700 | $530 | Athlon 64 X2 6000+ | $459 |
| Core 2 Quad Q6600 | $851 | Athlon 64 FX-72 | $799 |
| Core 2 Extreme QX6700 | $999 | Athlon 64 FX-74 | $999 |
So the comparisons are remarkably direct, by and large.
These things are never entirely simple, though, so we should roll out some caveats. One of the big ones involves those FX-series processors. You’ll need two of them in order to populate a Quad FX motherboard, so they’re priced (and listed above) in pairs. However, there’s currently only one Quad FX motherboard available, and it costs about $350, which throws the value equation out of whack.
The value equation sometimes goes off-kilter the other way when AMD employs guerrilla price-war tactics like selling the Athlon 64 X2 4600+ for $125.99 on Newegg, well below the slower 4400+. AMD has several of these “Crazy Hector” deals going at Newegg right now, and none of them seem to involve the Athlon 64 models we’ve identified as direct competitors to specific Core 2 Duo models. That’s probably an intentional facet of AMD’s strategy. This practice throws a wrench in our nice, neat comparsion, but there’s little we can do other than tell you about it.
One other thing we should tell you about is why we’ve included two versions of the Athlon 64 X2 5000+ in our testing. Regular readers may recall that we’ve already tested the 65nm version of the 5000+ against its 90nm predecessor and found that the 65nm one had lower power consumption. But the 65nm version also has a slower L2 cache, so we’ve tested the 65nm and 90nm chips head to head to see how the slower cache affects performance.
Our testing methods
As ever, we did our best to deliver clean benchmark numbers. Tests were run at least three times, and the results were averaged.
In some cases, getting the results meant simulating a slower chip with a faster one. For instance, our Core 2 Duo E6600 and E6700 processors are actually a Core 2 Extreme X6800 processor clocked down to the appropriate speeds. Their performance should be identical to that of the real thing. Similarly, our Athlon 64 FX-72 results come from an underclocked pair of Athlon 64 FX-74s, our Athlon 64 X2 4400+ is an underclocked X2 5000+ (both 65nm), and our Athlon 64 X2 5600+ is an underclocked Athlon 64 X2 6000+.
Our test systems were configured like so:
| Processor | Core 2 Duo E6300 1.83GHz Core 2 Duo E6400 2.13GHz Core 2 Duo E6600 2.4GHz Core 2 Duo E6700 2.66GHz Core 2 Extreme X6800 2.93GHz Core 2 Quad Q6600 2.4GHz Core 2 Extreme QX6700 2.66GHz |
Athlon 64 X2 4400+ 2.3GHz (65nm) Athlon 64 X2 5000+ 2.6GHz (65nm) Athlon 64 X2 5000+ 2.6GHz (90nm) Athlon 64 X2 5600+ 2.8GHz (90nm) Athlon 64 X2 6000+ 3.0GHz (90nm) |
Athlon 64 FX-70 2.6GHz Athlon 64 FX-72 2.8GHz Athlon 64 FX-74 3.0GHz |
| System bus | 1066MHz (266MHz quad-pumped) | 1GHz HyperTransport | 1GHz HyperTransport |
| Motherboard | Intel D975XBX2 | Asus M2N32-SLI Deluxe | Asus L1N64-SLI WS |
| BIOS revision | BX97520J. 86A.2618.2007.0212.0954 86A.2618.2007.0212.0954 |
0903 | 0205 |
| North bridge | 975X MCH | nForce 590 SLI SPP | nForce 680a SLI |
| South bridge | ICH7R | nForce 590 SLI MCP | nForce 680a SLI |
| Chipset drivers | INF Update 8.1.1.1010 Intel Matrix Storage Manager 6.21 |
ForceWare 15.00 | ForceWare 15.00 |
| Memory size | 2GB (2 DIMMs) | 2GB (2 DIMMs) | 2GB (4 DIMMs) |
| Memory type | Corsair TWIN2X2048-6400C4 DDR2 SDRAM at 800MHz |
Corsair TWIN2X2048-8500C5 DDR2 SDRAM at 800MHz |
Crucial Ballistix PC6400 DDR2 SDRAM at 800MHz |
| CAS latency (CL) | 4 | 4 | 4 |
| RAS to CAS delay (tRCD) | 4 | 4 | 4 |
| RAS precharge (tRP) | 4 | 4 | 4 |
| Cycle time (tRAS) | 12 | 12 | 12 |
| Audio | Integrated ICH7R/STAC9274D5 with Sigmatel 6.  10.0.5274 drivers 10.0.5274 drivers |
Integrated nForce 590 MCP/AD1988B with Soundmax 6.10.2.6100 drivers |
Integrated nForce 680a SLI/AD1988B with Soundmax 6.10.2.6100 drivers |
| Hard drive | Maxtor DiamondMax 10 250GB SATA 150 | ||
| Graphics | GeForce 7900 GTX 512MB PCIe with ForceWare 100.64 drivers | ||
| OS | Windows Vista Ultimate x64 Edition | ||
| OS updates | – | ||
Our Core 2 Duo E6400 processor came to us courtesy of the fine folks up north at NCIX. Those of you who are in Canada will definitely want to check them out as potential source of PC hardware and related goodies.
Thanks to Corsair for providing us with memory for our testing. Their products and support are far and away superior to generic, no-name memory.
Also, all of our test systems were powered by OCZ GameXStream 700W power supply units. Thanks to OCZ for providing these units for our use in testing.
The test systems’ Windows desktops were set at 1280×1024 in 32-bit color at an 85Hz screen refresh rate. Vertical refresh sync (vsync) was disabled.
We used the following versions of our test applications:
- SiSoft Sandra XI 2007.2.11.17 64-bit
- CPU-Z 1.39
- POV-Ray for Windows 3.7 beta 19a 64-bit
- Cinebench 9.5 64-bit Edition
- Windows Media Encoder 9 x64 Edition
- picCOLOR 4.0 build 598 64-bit
- 3DMark06 1.0.2
- notfred’s Folding benchmark CD 10/31/06 revision
- The Panorama Factory 4.4 x64 Edition
- CASE Lab Euler3d CFD benchmark 2.2
- MyriMatch proteomics benchmark
- Valve Source Engine particle simulation benchmark
- Valve VRAD map build benchmark
- LAME MT 3.
 97a 64-bit
- 3DMark06 1.10
- The Elder Scrolls IV: Oblivion 1.1
- Rainbow Six: Vegas 1.02
- Supreme Commander 3220
The tests and methods we employ are generally publicly available and reproducible. If you have questions about our methods, hit our forums to talk with us about them.
The Elder Scrolls IV: Oblivion
We tested Oblivion by manually playing through a specific point in the game five times while recording frame rates using the FRAPS utility. Each gameplay sequence lasted 60 seconds. This method has the advantage of simulating real gameplay quite closely, but it comes at the expense of precise repeatability. We believe five sample sessions are sufficient to get reasonably consistent results. In addition to average frame rates, we’ve included the low frame rates, because those tend to reflect the user experience in performance-critical situations. In order to diminish the effect of outliers, we’ve reported the median of the five low frame rates we encountered.
For this test, we set Oblivion‘s graphical quality to “Medium” but with HDR lighting enabled and vsync disabled, at 800×600 resolution. We’ve chosen this relatively low display resolution in order to prevent the graphics card from becoming a bottleneck, so differences between the CPUs can shine through.
Notice the little green plot with four lines above the benchmark results. That’s a snapshot of the CPU utilization indicator in Windows Task Manager, which helps illustrate how much the application takes advantage of up to four CPU cores, when they’re available. I’ve included these Task Manager graphics whenever possible throughout our results. In this case, Oblivion really only takes full advantage of a single CPU core, although Nvidia’s graphics drivers use multithreading to offload some vertex processing chores.
Obviously, any and all of these CPUs will run Oblivion at acceptable performance levels. If you’re keeping score, though, note that Core 2 processors take the top five spots, generally outpacing their like-priced competition and even jumping ahead of their more expensive Athlon 64 rivals.
Interestingly, the dual-socket Athlon 64 FX systems trail their dual-core siblings, probably because there’s a slight performance penalty to be paid for the Quad FX platform’s non-uniform memory architecture. Even though Windows Vista is supposed to be better at handling NUMA-type architectures, these systems have a small yet measurable disadvantage in this application and, as you’ll see, in some of our other tests. Since this game doesn’t make use of four cores, the FX processors can’t make up for it here. The Quad FX platform’s four cores and plentiful memory bandwidth can produce good results in other applications, and we’ll see that, too.
Rainbow Six: Vegas
Rainbow Six: Vegas is based on Unreal Engine 3 and is a port from the Xbox 360. For both of these reasons, it’s one of the first PC games that’s multithreaded, and it ought to provide an illuminating look at CPU gaming performance.
For this test, we set the game to run at 800×600 resolution with high dynamic range lighting disabled. “Hardware skinning” (via the GPU) was disabled, leaving that burden to fall on the CPU. Shadow quality was set to very low, and motion blur was enabled at medium quality. I played through a 90-second sequence of the game’s Terrorist Hunt mode on the “Dante’s” level five times, capturing frame rates with FRAPS, as we did with Oblivion.
Once again, the Core 2 processors lead their Athlon 64 competition, but this is a much tighter contest. Note to self: Don’t expect a game designed for the weakling Xbox 360 CPU to stress any modern PC processor.
Supreme Commander
We’ve been hearing about this game for a while now, including the fact that it’s multithreaded and thus a good candidate to take advantage of dual-core (or better) CPUs. Now we get to test it out. We ran into some snags when we first tried to test this game with FRAPS. Getting consistent results proved difficult, and the sound didn’t want to work on our Intel D975XBX2 motherboard, whose Vista x64 audio drivers may not yet be up to snuff. I was also developing the first signs of extreme RTS addictiona grave condition indeed. I found myself analyzing unit types and lusting after level-two engineer bots. Fortunately, we were able to overcome these problems by using Supreme Commander‘s very nice built-in benchmark, which plays back a test game and reports detailed performance results afterward. We launched the benchmark by running the game with the “/map perftest /nosound” options. (Normally, we prefer to test games with audio enabled, but we made an exception here.) We tested at 1024×768 resolution with the game’s default quality settings.
Supreme Commander’s built-in benchmark breaks down its results into several major categories: running the game’s simulation, rendering the game’s graphics, and a composite score that’s simply comprised of the other two. The performance test also reports good ol’ frame rates, so we’ve included those, as well.
The most striking thing about these results is, relatively speaking, how little separation there is between the fastest and slowest systems. One of the reasons for that is clear. The Task Manager plot tells us (and the results confirm) that, despite rumors the game would put more than two CPU cores to good use, Supreme Commander doesn’t use four cores very effectively.
Another reason may be that the game’s simulation component is limited by memory performance, at least on the Athlon 64 systems. For instance, the Athlon 64 X2 5600+ turns out to be faster than the 6000+, which seems counterintuitive. However, some speed grades of the A64 don’t run their memory at its full potential clock speed, and that’s the case with the X2 6000+. The 6000+ clocks its DDR2 RAM at 375MHz (or 750MHz effective), while the 5600+ runs its memory at 400MHz (or 800MHz effective). The Quad FX platform’s memory access latency penalty seems to come into play here, as well, since the FX systems occupy the bottom rungs of the simulation results.
That said, the Intel processors clearly dominate, with the Core 2 Duo E6300 outrunning the Athlon 64 X2 6000+.
The AMD chips get their groove back in the rendering portion of the test, where they prove to be very much competitive with the Core 2 processors.
Add up the two scores, though, and the Core 2 CPUs come out on top overall. Again, the total separation in scores between the slowest and fastest processors is relatively small.
We can perhaps put these results into better context by reporting a familiar, real-world result like frames per second. Once again, we have an average frame rate and a median low frame rate. This time, I’ve chosen to sort the results by the median low number, since I think that’s easily the most important performance factor in this game.
Now we can see why the overall scores in the game’s benchmark are so close together. The average frame rates don’t vary much from the fastest to slowest CPUs. The minimum frame rates range from about six FPS at bottom to nine FPS at most. That’s either a whole lot, if you think in terms of percentage gains, or not very much, if you consider that both six and nine FPS are, er, really slow.
Our GeForce 7900 GTX graphics card may be limiting our performance somewhat. I ran this same test on a Core 2 Quad QX6700 with the game’s graphics quality settings turned down, and it improved scores in the render portion of the test by about 1000 points, boosting the minimum frame rate to 13 FPS. Simulation scores, however, were unchanged.
Valve Source engine particle simulation
Next up are a couple of tests we picked up during a visit to Valve Software, the developers of the Half-Life games. They’ve been working to incorporate support for multi-core processors into their Source game engine, and they’ve cooked up a couple of benchmarks to demonstrate the benefits of multithreading.
The first of those tests runs a particle simulation inside of the Source engine. Most games today use particle systems to create effects like smoke, steam, and fire, but the realism and interactivity of those effects is limited by the available computing horsepower. Valve’s particle system distributes the load across multiple CPU cores.
The quad-core systems stake out the top positions here, finally getting to show their stuff. Overall, the Core 2 processors are clearly faster.
Valve VRAD map compilation
This next test processes a map from Half-Life 2 using Valve’s VRAD lighting tool. Valve uses VRAD to precompute lighting that goes into its games. This isn’t a real-time process, and it doesn’t reflect the performance one would experience while playing a game. It does, however, show how multiple CPU cores can speed up game development.
This is a very different test from the last one, but the finishing order is quite similar, with the quad cores and Core 2s doing best. Apparently, the word “core” has magical powers.
3DMark06
3DMark06 combines the results from its graphics and CPU tests in order to reach an overall score. Here’s how the processors did overall and in each of those tests.
3DMark’s graphics tests are very much GPU limited, as is appropriate, but its CPU tests scale well with faster processors. The CPU test contributes to the overall 3DMark score, dictating the separation between our contestants. The Athlon 64s are more competitive here, especially in the lower speed grades, where they’re outright faster than the similarly priced Core 2 Duos.
The Panorama Factory
The Panorama Factory handles an increasingly popular image processing task: joining together multiple images to create a wide-aspect panorama. This task can require lots of memory and can be computationally intensive, so The Panorama Factory comes in a 64-bit version that’s multithreaded. I asked it to join four pictures, each eight megapixels, into a glorious panorama of the interior of Damage Labs. The program’s timer function captures the amount of time needed to perform each stage of the panorama creation process. I’ve also added up the total operation time to give us an overall measure of performance.
Quad-core processors have tremendous potential for image processing. Nearly every operation in this application uses four or more threads, and the quad-core processors take advantageespecially the Intel “Kentsfield” processors. Intel’s quad-core CPUs take the top two spots, but the mid-range Athlon 64s come out ahead of the competing Core 2 Duos.
picCOLOR
picCOLOR was created by Dr. Reinert H. G. Müller of the FIBUS Institute. This isn’t Photoshop; picCOLOR’s image analysis capabilities can be used for scientific applications like particle flow analysis. Dr. Müller has supplied us with new revisions of his program for some time now, all the while optimizing picCOLOR for new advances in CPU technology, including MMX, SSE2, and Hyper-Threading. Naturally, he’s ported picCOLOR to 64 bits, so we can test performance with the x86-64 ISA. Eight of the 12 functions in the test are multithreaded, and in this latest revision, five of those eight functions use four threads.
Scores in picCOLOR, by the way, are indexed against a single-processor Pentium III 1 GHz system, so that a score of 4.14 works out to 4.14 times the performance of the reference machine.
Yep, the Core 2 processors wind up on top again, this time thanks in no small part to strong performances in the rotation test that uses floating-point interpolation. The fastest CPU of the bunch, by the way, is over 13 times the speed of a 1GHz Pentium III, despite having a clock frequency of “only” 2.66GHz.
Windows Media Encoder x64 Edition
Windows Media Encoder is one of the few popular video encoding tools that uses four threads to take advantage of quad-core systems, and it comes in a 64-bit version. For this test, I asked Windows Media Encoder to transcode a 153MB 1080-line widescreen video into a 720-line WMV using its built-in DVD/Hardware profile. Because the default “High definition quality audio” codec threw some errors in Windows Vista, I instead used the “Multichannel audio” codec. Both audio codecs have a variable bitrate peak of 192Kbps.
The fastest CPU finishes encoding this clip in less than half the time it takes the slowest one to finish. Broken record here, but look, the Core 2s are faster than the Athlon 64s!
LAME MP3 encoding
LAME MT is a multithreaded version of the LAME MP3 encoder. LAME MT was created as a demonstration of the benefits of multithreading specifically on a Hyper-Threaded CPU like the Pentium 4.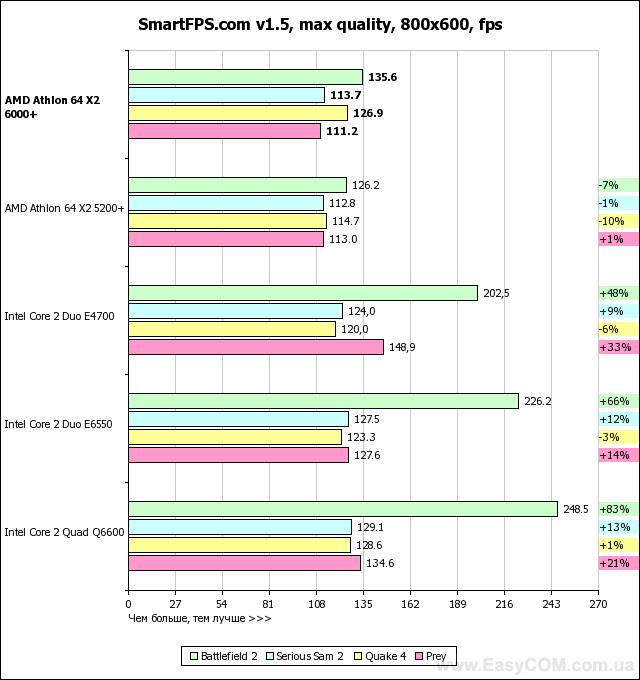 Of course, multithreading works even better on multi-core processors. You can download a paper (in Word format) describing the programming effort.
Rather than run multiple parallel threads, LAME MT runs the MP3 encoder’s psycho-acoustic analysis function on a separate thread from the rest of the encoder using simple linear pipelining. That is, the psycho-acoustic analysis happens one frame ahead of everything else, and its results are buffered for later use by the second thread. That means this test won’t really use more than two CPU cores.
We have results for two different 64-bit versions of LAME MT from different compilers, one from Microsoft and one from Intel, doing two different types of encoding, variable bit rate and constant bit rate. We are encoding a massive 10-minute, 6-second 101MB WAV file here, as we have done in many of our previous CPU reviews.
At best, you can expect to shave about 10 seconds per song (and this is a long song) off of LAME encoding jobs by choosing a Core 2 Extreme X6800 over a Core 2 Duo E6300. Going quad-core won’t get you anything here (except perhaps the ability to run two or three encoding tasks simultaneously). The Core 2 Extreme X6800 takes the top spot throughout our LAME tests, but the competitive landscape shifts quite a bit depending on the encode type and compiler used.
Cinebench
Graphics is a classic example of a computing problem that’s easily parallelizable, so it’s no surprise that we can exploit a multi-core processor with a 3D rendering app. Cinebench is the first of those we’ll try, a benchmark based on Maxon’s Cinema 4D rendering engine. It’s multithreaded and comes with a 64-bit executable. This test runs with just a single thread and then with as many threads as CPU cores are available.
The tables turn dramatically, with Athlon 64 FXs occupying the top ranks of the results and the X2s clearly leading their Core 2 counterparts. Will this pattern hold in another rendering app?
POV-Ray rendering
We’ve finally caved in and moved to the beta version of POV-Ray 3. 7 that includes native multithreading. The latest beta 64-bit executable is still quite a bit slower than the 3.6 release, but it should give us a decent look at comparative performance, regardless.
Yes, the pattern holds in POV-Ray, with the FX processors finishing 1-2-3 and the Athlon 64 X2 4400+ edging out the much pricier Core 2 Duo E6600.
POV-Ray’s officially sanctioned benchmark scene takes advantage of features that our old Chess2 scene doesn’t, and some of those features aren’t multithreaded. That’s why the dual-core processors gain back some ground here, with the Core 2 Extreme X6800 completing the render before the Core 2 Quad Q6600. Even so, the Athlon 64s retain their edge.
MyriMatch
Our benchmarks sometimes come from unexpected places, and such is the case with this one. David Tabb is a friend of mine from high school and a long-time TR reader. He recently offered to provide us with an intriguing new benchmark based on an application he’s developed for use in his research work. The application is called MyriMatch, and it’s intended for use in proteomics, or the large-scale study of protein. I’ll stop right here and let him explain what MyriMatch does:
In shotgun proteomics, researchers digest complex mixtures of proteins into peptides, separate them by liquid chromatography, and analyze them by tandem mass spectrometers. This creates data sets containing tens of thousands of spectra that can be identified to peptide sequences drawn from the known genomes for most lab organisms. The first software for this purpose was Sequest, created by John Yates and Jimmy Eng at the University of Washington. Recently, David Tabb and Matthew Chambers at Vanderbilt University developed MyriMatch, an algorithm that can exploit multiple cores and multiple computers for this matching. Source code and binaries of MyriMatch are publicly available.
In this test, 5555 tandem mass spectra from a Thermo LTQ mass spectrometer are identified to peptides generated from the 6714 proteins of S.
cerevisiae (baker’s yeast). The data set was provided by Andy Link at Vanderbilt University. The FASTA protein sequence database was provided by the Saccharomyces Genome Database.
MyriMatch uses threading to accelerate the handling of protein sequences. The database (read into memory) is separated into a number of jobs, typically the number of threads multiplied by 10. If four threads are used in the above database, for example, each job consists of 168 protein sequences (1/40th of the database). When a thread finishes handling all proteins in the current job, it accepts another job from the queue. This technique is intended to minimize synchronization overhead between threads and minimize CPU idle time.
The most important news for us is that MyriMatch is a widely multithreaded real-world application that we can use with a relevant data set. MyriMatch also offers control over the number of threads used, so we’ve tested with one to four threads. Also, this is a newer version of the MyriMatch code than we’ve used in the past, with a larger spectral collection, so these results aren’t comparable to those in some of our past articles.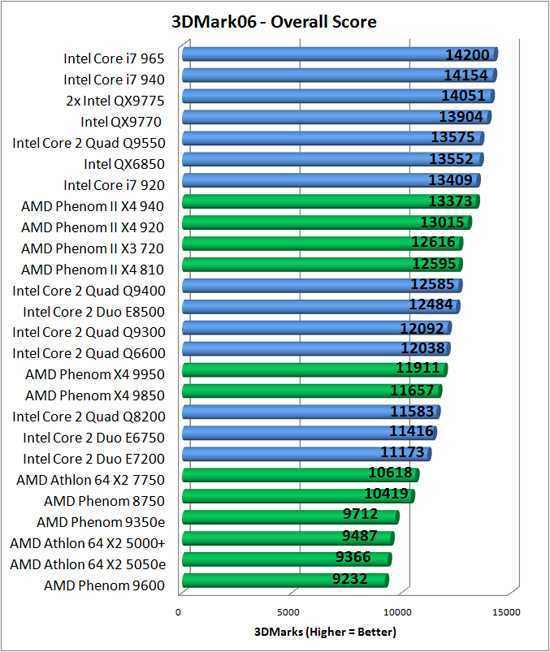
Perhaps the most striking thing about these results is how typical they are of what we’ve seen elsewhere. The Athlon 64 X2 6000+ falls behind not only the Core 2 Duo E6700 but the E6600, as well, and the Core 2 Extreme QX6700 is all alone at the topagain.
STARS Euler3d computational fluid dynamics
Our next benchmark is also a relatively new one for us. Charles O’Neill works in the Computational Aeroservoelasticity Laboratory at Oklahoma State University, and he contacted us recently to suggest we try the computational fluid dynamics (CFD) benchmark based on the STARS Euler3D structural analysis routines developed at CASELab. This benchmark has been available to the public for some time in single-threaded form, but Charles was kind enough to put together a multithreaded version of the benchmark for us with a larger data set. He has also put a web page online with a downloadable version of the multithreaded benchmark, a description, and some results here. (I believe the score you see there at almost 3Hz comes from our eight-core Clovertown test system. )
)
In this test, the application is basically doing analysis of airflow over an aircraft wing. I will step out of the way and let Charles explain the rest:
The benchmark testcase is the AGARD 445.6 aeroelastic test wing. The wing uses a NACA 65A004 airfoil section and has a panel aspect ratio of 1.65, taper ratio of 0.66, and a quarter-chord sweep angle of 45º. This AGARD wing was tested at the NASA Langley Research Center in the 16-foot Transonic Dynamics Tunnel and is a standard aeroelastic test case used for validation of unsteady, compressible CFD codes.
The CFD grid contains 1.23 million tetrahedral elements and 223 thousand nodes . . . . The benchmark executable advances the Mach 0.50 AGARD flow solution. A benchmark score is reported as a CFD cycle frequency in Hertz.
So the higher the score, the faster the computer. I understand the STARS Euler3D routines are both very floating-point intensive and oftentimes limited by memory bandwidth. Charles has updated the benchmark for us to enable control over the number of threads used. Here’s how our contenders handled the test with different thread counts.
Chalk up another one for the Core 2, especially the quad-core variants. The Quad FX systems stumble, probably due to latency issues related to their NUMA memory subsystems.
[email protected]
Next, we have another relatively new addition to our benchmark suite: a slick little [email protected] benchmark CD created by notfred, one of the members of Team TR, our excellent Folding team. For the unfamiliar, [email protected] is a distributed computing project created by folks at Stanford University that investigates how proteins work in the human body, in an attempt to better understand diseases like Parkinson’s, Alzheimer’s, and cystic fibrosis. It’s a great way to use your PC’s spare CPU cycles to help advance medical research. I’d encourage you to visit our distributed computing forum and consider joining our team if you haven’t already joined one.
The [email protected] project uses a number of highly optimized routines to process different types of work units from Stanford’s research projects. The Gromacs core, for instance, uses SSE on Intel processors, 3DNow! on AMD processors, and Altivec on PowerPCs. Overall, [email protected] should be a great example of real-world scientific computing.
notfred’s Folding Benchmark CD tests the most common work unit types and estimates performance in terms of the points per day that a CPU could earn for a Folding team member. The CD itself is a bootable ISO. The CD boots into Linux, detects the system’s processors and Ethernet adapters, picks up an IP address, and downloads the latest versions of the Folding execution cores from Stanford. It then processes a sample work unit of each type.
On a system with two CPU cores, for instance, the CD spins off a Tinker WU on core 1 and an Amber WU on core 2. When either of those WUs are finished, the benchmark moves on to additional WU types, always keeping both cores occupied with some sort of calculation. Should the benchmark run out of new WUs to test, it simply processes another WU in order to prevent any of the cores from going idle as the others finish. Once all four of the WU types have been tested, the benchmark averages the points per day among them. That points-per-day average is then multiplied by the number of cores on the CPU in order to estimate the total number of points per day that CPU might achieve.
This may be a somewhat quirky method of estimating overall performance, but my sense is that it generally ought to work. We’ve discussed some potential reservations about how it works here, for those who are interested. I have included results for each of the individual WU types below, so you can see how the different CPUs perform on each.
This one’s clear-cut. The Athlon 64 processors dominate the Tinker and Amber work unit types, and the Core 2 processors thrive with the two types of Gromacs WUs. We’ve seen this pattern before, but having so many different CPU speed grades shows how very pronounced it can be. For example, the Athlon 64 X2 4400+ comes out ahead of the Core 2 Extreme X6800 in the Tinker WU test, amazingly enough.
Once we average the different WU types and account for multiple processor cores, though, things snap into perspective. The quad-core systems take a pronounced lead, and the slower dual-core models have under half of their point-production potential.
SiSoft Sandra Mandelbrot
Next up is SiSoft’s Sandra system diagnosis program, which includes a number of different benchmarks. The one of interest to us is the “multimedia” benchmark, intended to show off the benefits of “multimedia” extensions like MMX, SSE, and SSE2. According to SiSoft’s FAQ, the benchmark actually does a fractal computation:
This benchmark generates a picture (640×480) of the well-known Mandelbrot fractal, using 255 iterations for each data pixel, in 32 colours. It is a real-life benchmark rather than a synthetic benchmark, designed to show the improvements MMX/Enhanced, 3DNow!/Enhanced, SSE(2) bring to such an algorithm.
The benchmark is multi-threaded for up to 64 CPUs maximum on SMP systems. This works by interlacing, i.e. each thread computes the next column not being worked on by other threads. Sandra creates as many threads as there are CPUs in the system and assignes [sic] each thread to a different CPU.
We’re using the 64-bit version of Sandra. The “Integer x16” version of this test uses integer numbers to simulate floating-point math. The floating-point version of the benchmark takes advantage of SSE2 to process up to eight Mandelbrot iterations in parallel.
This test underscores the vector math potential of the Core microarchitecture, which can execute a 128-bit SSE2 operation in a single cycle. The Athlon 64 is completely overmatched here, but as I’ve said before, the tables may turn when AMD’s new microarchitecture arrives later this year with similar vector math capabilities.
Power consumption and efficiency
We’re trying something a little different with power consumption. Our Extech 380803 power meter has the ability to log data, so we can capture power use over a span of time. The meter reads power use at the wall socket, so it incorporates power use from the entire systemthe CPU, motherboard, memory, video card, hard drives, and anything else plugged into the power supply unit. (We plugged the computer monitor and speakers into a separate outlet, though.) We measured how each of our test systems used power during a roughly one-minute period, during which time we executed Cinebench’s multithreaded rendering test. All of the systems had their power management features (such as SpeedStep and Cool’n’Quiet) enabled during these tests.
You’ll notice that I’ve not included some members of the Athlon 64 family here. That’s because our “simulated” Athlon 64 CPUs are underclocked versions of faster processors, and we’ve not been able to get Cool’n’Quiet power-saving tech to work when CPU multiplier control is in use. I expect to have in-the-flesh examples of the Athlon 64 X2 4400+ and 5600+ soon, and I’ll provide an update once I’ve tested their power consumption.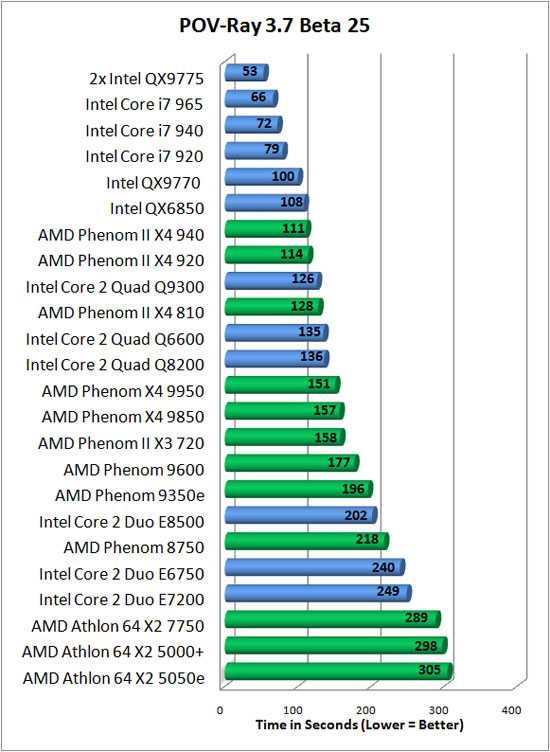
I have included our simulated Core 2 Duo E6600 and E6700, because SpeedStep works fine on the D975XBX2 motherboard alongside underclocking. The simulated processors’ voltage may not be exactly the same as what you’d find on many retail E6600s and E6700s. However, voltage and power use can vary from one chip to the next, since Intel sets voltage individually on each chip at the factory.
The differences between the CPUs are immediately obvious by looking at these plots of the raw data. We can slice up the data in various ways in order to better understand them, though. We’ll start with a look at idle power, taken from the trailing edge of our test period, after all CPUs have completed the render.
Among dual-core setups, the Core 2s have a slight advantage in idle power consumption, but not more than 10 watts or so. There’s a much larger gap between the quad-core rigs, since the Quad FX platform is a dual-socket solution with dual core-logic chipsets. Meanwhile, the Intel quad-core systems draw only about 10-15 watts more than their dual-core brethren.
Next, we can look at peak power draw by taking an average from the five-second span from 10 to 15 seconds into our test period, during which the processors were rendering.
The peak power consumption numbers tell us very good things about the Core 2 processors. The system based on Intel’s power-hungriest dual-core processor, the Core 2 Extreme X6800, draws 15W less under load than the one based on the lowest power AMD processor here, the 65nm version of Athlon 64 X2 5000+. AMD’s 65nm chip does shave off some power drawroughly 12Wversus its 90nm variant. The Athlon 64 FX-74, meanwhile, is just plain silly.
Another way to gauge power efficiency is to look at total energy use over our time span. This method takes into account power use both during the render and during the idle time. We can express the result in terms of watt-seconds, also known as joules.
The Core 2-based systems led in terms of both peak and idle power draw, so it’s unsurprising they do so well over the total duration of our test period.
However, we can quantify efficiency even better by considering the amount of energy used to render the scene. Since the different systems completed the render at different speeds, we’ve isolated the render period for each system. We’ve chosen to identify the end of the render as the point where power use begins to drop from its steady peak. There seems to be some disk paging going on after that, but we don’t want to include that more variable activity in our render period.
We’ve computed the amount of energy used by each system to render the scene. This method should account for both power use and, to some degree, performance, because shorter render times may lead to less energy consumption.
These results tell us several things. First, multi-core processors can be very energy efficient when handling parallel tasks like rendering. The quad-core Q6600 and QX6700 run away with the top two positions, and the FX-70 turns out to be the most efficient Athlon 64, even with its considerable built-in platform power handicap. Second, Intel’s Core 2 processors are much more efficient overall than the current Athlon 64s. It’s really no contest. And finally, the Athlon 64 does gain some efficiency when moving to AMD’s 65nm process, but not yet enough to put it back into contention against the Core 2.
Conclusions
The fact that Intel retains the overall performance crown comes as no surprise. As we said at the outset, AMD has no real answer to the Core 2 Extreme X6800 among its dual-core processors. Also, Intel’s quad-core CPUs tend to scale better than AMD’s Quad FX platform, especially for typical desktop-class applications. Our move to Windows Vista x64 has done little to alter this dynamic. At the same time, Core 2 processors tend to draw less power and to be more energy efficientsometimes markedly sothan Athlon 64s. Right now, Intel has the magic combination of a superior processor microarchitecture and a more mature, fully realized 65nm manufacturing capability working together on its side.
This one-two punch has allowed Intel to maintain a performance edge at most price points, despite standing pat through AMD’s aggressive pricing moves and new model introductions. AMD’s current weaknesses manifest themselves most fully in its high-end models, like the Athlon 64 X2 6000+, which draws more power at peak than the Core 2 Extreme QX6700 yet is often outperformed by the less expensive Core 2 Duo E6600. The Athlon 64 looks more competitive in its lower-end incarnations like the X2 5000+ and 4400+, which match up better on both performance and power characteristics against the Core 2 Duo E6300 and E6400. These processors have the benefit of being available in 65nm form, and I’d say the minor performance penalty one pays in performance at 65nm (due to the slower L2 cache) is worth it for the reduced power draw.
This low-to-mid-range territory, incidentally, is where I’d be looking to buy. Many of our tests have shown the benefits of quad-core processors, but honestly, finding applications that will make good use of four cores is not easyand the list of games that really use four cores is approximately zero. I’d probably grab a Core 2 Duo E6400 and overclock it until it started to glow, if I were putting together a system right now. I must admit, though, that I have an almost irrational fondness for the Core 2 Quad Q6600, probably because it’s the most energy efficient processor in our Cinebench power test. The thing is by no means a great dealtwo E6600s will set you back over $200 less than a single Q6600but it’s easy to imagine a near-silent multitasking monster built around one.
AMD would do well to expand its 65nm offerings into higher clock frequencies as soon as it can reasonably do so. That may take a while yet, given the limited overclocking headroom we’ve seen from early 65nm Athlon 64 X2s. Meanwhile, Intel isn’t likely to sit still for much longer. Rumors of an April price cut abound, and in light of the Core 2’s ample frequency headroom, higher speed grades are a definite possibility, as well. For AMD, its next-generation microarchitecture can’t come a moment too soon.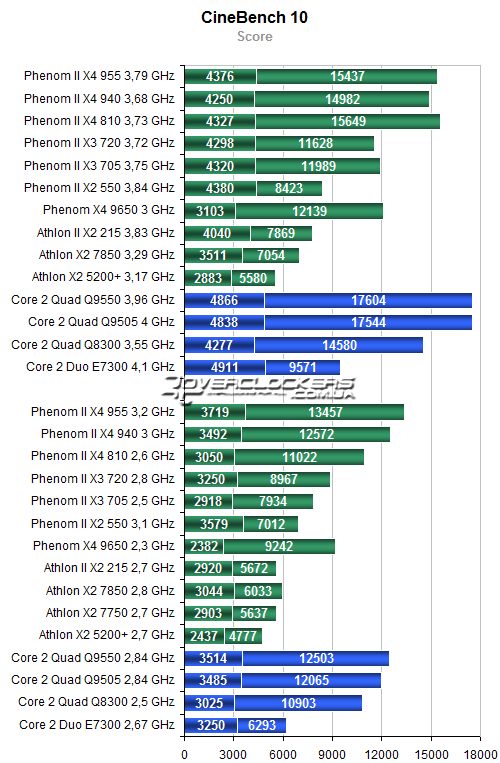
Encuesta AMD Athlon 64 X2 vs Intel Core 2 Duo
|
25/10/2006, 13:23 |
||||
|
||||
|
Encuesta AMD Athlon 64 X2 vs Intel Core 2 Duo Hola amigos quiero cambiar mi equipo x uno nuevo pero estoy en la eleccion de k micro me compro espero me puedan ayudar, pienso meterle una mobo Asrock, 1gb en ram y un disko sata x lo pronto ya k las piezas salen caras jejeje los k ya tengan uno de estos 2 micros o hayan tenido experiencias dejen sus comentarios, grax, saludos. Que opcion elegirias? 2.- Procesador Intel Core 2 Duo E6300 a 1.86 GHz, Socket LGA 775, BUS de 1066MHz, 2MB L2 Cache, Dual Core, EM64T Por Que? |
|
26/10/2006, 12:08 |
||||
|
||||
|
Core 2 Duo __________________ Friedrich Nietzsche |
|
26/10/2006, 13:34 |
||||
|
||||
|
saludos, me quedo con el amd x2, dando grandes resultados a muy buenos precios, de que te sirve que el intel core duo sea una pasada, si su precio es casi el de dos amd x2! __________________ |
 212
212|
27/10/2006, 21:37 |
|||
|
|||
|
el Intel. |
|
29/10/2006, 16:50 |
||||
|
||||
|
Es mejor el Core 2 Duo E6300 pero no estoy seguro de que la diferencia de precio valga la pena. |
|
29/10/2006, 20:44 |
||||
|
||||
|
Definitivamente, me quedo con el Core 2 Duo. __________________ |
|
29/10/2006, 20:52 |
||||
|
||||
|
Bien, creo que con respecto a la relacion prestaciones/precio, definitivamente me quedo con el AMD. He visto correr ambos en maquinas para diseño grafico, y tengo que decirte que el AMD X2 no tien nada qeu envidiarle al Intel Core Duo. Al margen de cual de los 2 te convenga mas,ambos te van a funcionar bastante bien, pon mas atencion al resto de lso componentes de la PC, no sirve de nada que te compres u INtel con 2MB de cahe, si le vas a poner un motherboard PCCHIPS con 256MB marca ACME. En estos casos creoq ue un mother Intel o ASUS se desempeñan bastante bien. __________________ |
 352
352|
31/10/2006, 15:51 |
||||
|
||||
|
Hola bueno amigos ya tome una decision al fin, despues de tanto investigarle y estar viendo cual me convenia mas decidi y me compre el Intel Core 2 Duo aunk un pokito mas caro pero ps vale la pena gastar unos pesitos mas, x k como saben los Intel siempre son mejores en multitareas y luego tener varios programas de diseo abiertos ps alenta algo la makina y consume muchos recursos pero vaya k me sorprendio el core 2 duo muy potente la vdd se los recomiendo, saludos y mil grax x sus opiniones =D __________________ |
 534
534|
03/09/2010, 15:30 |
|||
|
|||
|
Respuesta: Encuesta AMD Athlon 64 X2 vs Intel Core 2 Duo Si son justo como dices las especificaciones, mejor cómprate el AMD X2, porque una Intel Core 2 Dúo a velocidad 1. |
 80GHz no rinde nada, tendría que ser mínimo 2.4GHz para que rinda decente un Core 2 Dúo.
|
03/09/2010, 15:58 |
||||
|
||||
|
Respuesta: Encuesta AMD Athlon 64 X2 vs Intel Core 2 Duo Por favor no revivas temas tan antiguos.. |
AMD Athlon II X2 270 vs Intel Core 2 Duo E8400
General
-
AM3
Soket
LGA 775
-
3.
 4 GHz
4 GHzKecepatan
3 GHz
-
Dual
Core
Dual
-
2 MB
L2 Cache
6 MB
Basic Info
-
Nama Produk
-
Kategori
-
Brand
-
Tahun Rilis
Technical Detail
-
64 bit
Data Width
64 bit
-
Socket
-
Speed
-
45 nm
Lithograpy
45 nm
-
65 W
Thermal
65 W
-
Hyper-Threading
-
Core
Cache
-
128 KB
L1 Cache
128 KB
-
2 MB
L2 Cache
6 MB
-
—
L3 Cache
—
Memory
-
DDR3
Memory Type
DDR2
-
1866 MHz
Memory Speed
800 MHz
-
2
Memory Slot
2
GPU
-
—
GPU Clock Speed
—
-
Integrated Graphics
Review
-
Review
Perbandingan Terpopuler
AMD A6-6400K APU
Intel Core i3-3240
Bandingkan
AMD A6-6400K APU
Intel Core i5-3470
Bandingkan
AMD A8-7650K
Intel Core i5-3470
Bandingkan
Intel Core i3-2100
Intel Pentium Dual-Core G2030
Bandingkan
Intel Core i3-3220
AMD A4-6300 APU
Bandingkan
Bandingkan dengan
Comparison of Intel Core 2 Duo E8400 and AMD Athlon 64 X2 5000+
Comparative analysis of Intel Core 2 Duo E8400 and AMD Athlon 64 X2 5000+ processors according to all known characteristics in the categories: General information, Performance, Memory, Compatibility, Security and reliability, Technology, Virtualization.
Analysis of processor performance by benchmarks: PassMark — Single thread mark, PassMark — CPU mark, Geekbench 4 — Single Core, Geekbench 4 — Multi-Core, 3DMark Fire Strike — Physics Score, CompuBench 1.5 Desktop — Face Detection (mPixels/s), CompuBench 1.5 Desktop — Ocean Surface Simulation (Frames/s), CompuBench 1.5 Desktop — T-Rex (Frames/s), CompuBench 1.5 Desktop — Video Composition (Frames/s), CompuBench 1.5 Desktop — Bitcoin Mining (mHash/s).
Intel Core 2 Duo E8400
versus
AMD Athlon 64 X2 5000+
Benefits
Reasons to choose Intel Core 2 Duo E8400
- Newer processor, approx. clock speed: 3 GHz vs 2.6 GHz
- Newer manufacturing process of the processor allows it to be more powerful, but with lower power consumption: 45 nm vs 90 nm
- L2 cache is 12 times larger, which means more data can be stored in it for quick access
- About 37% less power consumption: 65 Watt vs 89 Watt
- PassMark — Single thread mark performance by about 55% more: 1241 vs 802
- About 88% more performance in Geekbench 4 — Single Core benchmark: 422 vs 225
- About 73% more performance in Geekbench 4 — Multi-Core benchmark: 738 vs 427
| Issue date | January 2008 vs May 2006 |
| Maximum frequency | 3 GHz vs 2. 6 GHz 6 GHz |
| Process | 45 nm vs 90 nm |
| Level 2 cache | 6144 KB vs 512 KB |
| Power consumption (TDP) | 65 Watt vs 89 Watt |
| PassMark — Single thread mark | 1241 vs 802 |
| Geekbench 4 — Single Core | 422 vs 225 |
| Geekbench 4 — Multi-Core | 738 vs 427 |
Reasons to choose AMD Athlon 64 X2 5000+
- L1 cache is 2 times larger, which means more data can be stored in it for quick access
- Performance in PassMark benchmark — CPU mark about 29% higher: 1507 vs 1172
| L1 cache | 256 KB vs 128 KB |
| PassMark — CPU mark | 1507 vs 1172 |
Benchmark comparison
CPU 1: Intel Core 2 Duo E8400
CPU 2: AMD Athlon 64 X2 5000+
| PassMark — Single thread mark |
|
|||
| PassMark — CPU mark |
|
|||
| Geekbench 4 — Single Core |
|
|||
| Geekbench 4 — Multi-Core |
|
| Name | Intel Core 2 Duo E8400 | AMD Athlon 64 X2 5000+ |
|---|---|---|
| PassMark — Single thread mark | 1241 | 802 |
| PassMark — CPU mark | 1172 | 1507 |
| Geekbench 4 — Single Core | 422 | 225 |
| Geekbench 4 — Multi-Core | 738 | 427 |
| 3DMark Fire Strike — Physics Score | 2400 | |
CompuBench 1.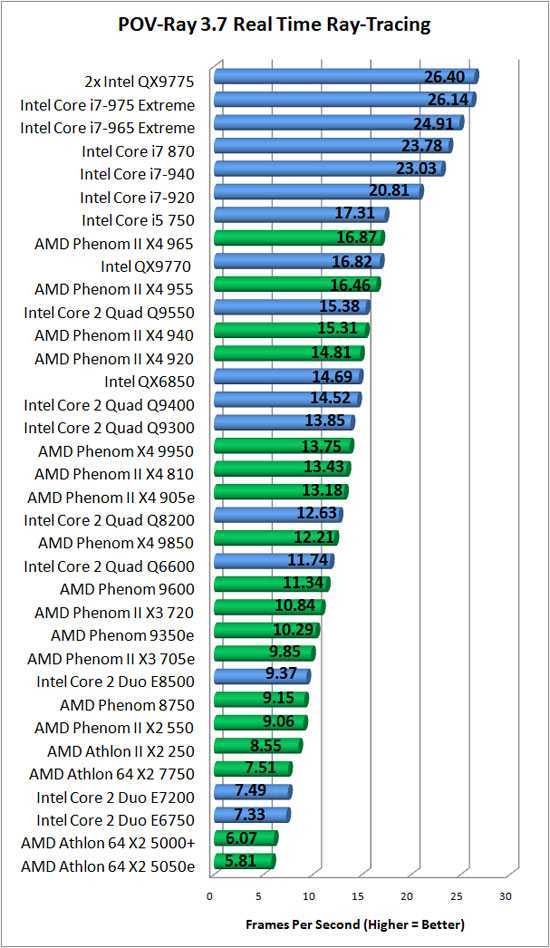 5 Desktop — Face Detection (mPixels/s) 5 Desktop — Face Detection (mPixels/s) |
0.33 | |
| CompuBench 1.5 Desktop — Ocean Surface Simulation (Frames/s) | 26.311 | |
| CompuBench 1.5 Desktop — T-Rex (Frames/s) | 0.099 | |
| CompuBench 1.5 Desktop — Video Composition (Frames/s) | 0.68 | |
| CompuBench 1.5 Desktop — Bitcoin Mining (mHash/s) | 2.408 |
Performance comparison
| Intel Core 2 Duo E8400 | AMD Athlon 64 X2 5000+ | |
|---|---|---|
| Architecture name | Wolfdale | Windsor |
| Production date | January 2008 | May 2006 |
| Place in the ranking | 2361 | 2350 |
| Price now | $129. |
$331.49 |
| Processor Number | E8400 | |
| Series | Legacy Intel® Core™ Processors | |
| Status | Discontinued | |
| Price/performance ratio (0-100) | 4.87 | 1.17 |
| Applicability | Desktop | Desktop |
| Support 64 bit | ||
| Base frequency | 3. 00 GHz 00 GHz |
|
| Bus Speed | 1333 MHz FSB | |
| Crystal area | 107 mm2 | 220mm |
| Level 1 cache | 128KB | 256KB |
| Level 2 cache | 6144KB | 512KB |
| Process | 45nm | 90 nm |
| Maximum case temperature (TCase) | 72 °C | |
| Maximum core temperature | 72. 4°C 4°C |
|
| Maximum frequency | 3 GHz | 2.6 GHz |
| Number of cores | 2 | 2 |
| Number of transistors | 410 million | 154 million |
| Permissible core voltage | 0.8500V-1.3625V | |
| Supported memory types | DDR1, DDR2, DDR3 | |
| Low Halogen Options Available | ||
| Maximum number of processors in | 1 | 1 |
| Package Size | 37. 5mm x 37.5mm 5mm x 37.5mm |
|
| Supported sockets | LGA775 | AM2 |
| Power consumption (TDP) | 65 Watt | 89 Watt |
| Execute Disable Bit (EDB) | ||
| Intel® Trusted Execution Technology (TXT) | ||
| Enhanced Intel SpeedStep® Technology | ||
| Parity FSB | ||
| Idle States | ||
| Intel 64 | ||
| Intel® AES New Instructions | ||
| Intel® Demand Based Switching | ||
| Intel® Hyper-Threading Technology | ||
| Intel® Turbo Boost Technology | ||
| Thermal Monitoring | ||
| Intel® Virtualization Technology (VT-x) | ||
| Intel® Virtualization Technology for Directed I/O (VT-d) |
Comparison AMD Athlon 64 X2 5600+ vs Intel Core 2 Duo E8400 which is better?
| General | |
|
Type |
|
| Desktop | Desktop |
|
Architecture code name |
|
| Windsor | Wolfdale |
|
Cores A large number of cores improves performance in multi-threaded applications. |
|
| 2 | 2 |
|
Threads More threads help the cores process information more efficiently. Real performance will be noticeable in very specific tasks (video editing, databases). |
|
| 2 | 2 |
|
Process |
|
| 90 nm | 45 nm
-45 nm (-50%) better than |
|
Chip size |
|
| 220 mm2 | 104 mm2 |
|
Number of transistors |
|
| 227 million | 410 million
183 million (80.6%) better than |
|
Maximum frequency Higher clock speed processors perform more calculations per second and thus provide better performance. |
|
2. 9GHz 9GHz |
3 GHz
Better than at 0.1 GHz (3.4%) |
|
Support 64 bit |
|
|
Max. number of processors in configuration |
|
| 1 | 1 |
|
Socket |
|
| AM2 | LGA775 |
|
Value for money The sum of all the advantages of the device divided by its price. The more%, the better the quality per unit price in comparison with all analogues. |
|
| 92% | 96.7%
4.7% (5.1%) better than |
|
Maximum core temperature |
|
| n/a | 72 °C |
|
TXT Intel Trusted Execution Technology for hardware-based malware protection. For each protected program, the processor allocates its own isolated section of RAM. |
|
|
Demand Based Switching |
|
| n/a | — |
|
FSB parity |
|
| n/a | — |
|
Level 1 Cache The fastest level of cache that works directly with the core. |
|
| 256 Kb | 64K (per core) |
|
Level 2 cache |
|
| 512K | 6 MB (total) |
|
Maximum case temperature (TCase) |
|
| n/a | 72 °C |
|
Power Demand (TDP) The calculated heat output shows the average heat dissipation in load operation, |
|
| 89W | 65 W
-24 W (-27%) better than |
|
EDB |
|
| n/a | + |
|
Permissible core voltage |
|
| n/a | 0.85V-1.3625V |
 The larger the cache, the better the performance.
 | Technology and additional instructions | |
|
Turbo Boost |
|
| n/a | — |
|
Idle States |
|
|
Enhanced SpeedStep (EIST) Technology from Intel that allows the processor to slow down to a minimum frequency to save power when the processor is idle. |
|
|
Thermal Monitoring |
|
|
Hyper-Threading Intel hardware technology that allows multiple threads to be processed on each processor core. For server applications, the performance improvement is up to 30%. |
|
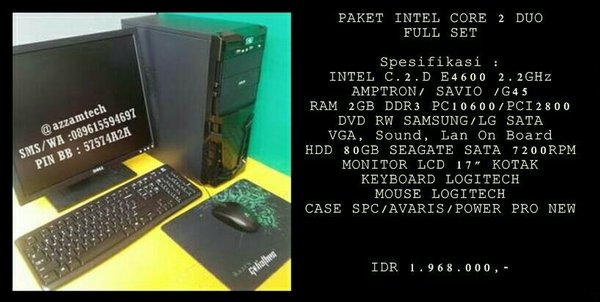
| Virtualization technologies | |||||||||||||||||||||||||||||||||||||||||||||||||||||||||||||||||||||||||||||||||||||||||||||||||||||||||||||||||||||||||||||||||||||||
|
VT-d Intel virtualization technology allows you to forward devices on the PCI bus to the guest operating system so that it can work with them using its standard tools. The speed of caches and working with RAM is also important. Speed in office useAthlon 64 X2 Dual Core 4200+ 35.3 Core2 Duo E6550 35.6 (+0.8%) Performance in everyday work, e.g. The performance of 1 core has the greatest impact on the result, since most of these applications use only one, ignoring the rest. Similarly, many professional applications such as various CADs ignore multi-threaded performance. Speed in heavy applicationsAthlon 64 X2 Dual Core 4200+ 15.6 Core2 Duo E6550 15.7 (+0.6%) maximum The performance of all cores and their number have the greatest impact on the result, since most of these applications willingly use all the cores and increase the speed accordingly. At the same time, certain periods of work may be demanding on the performance of one or two cores, for example, applying filters in the editor. Data obtained from tests by users who tested their systems with and without overclocking. Thus, you see the average values corresponding to the processor. Speed of numerical operations
Different tasks require different CPU strengths. A system with few fast cores and low memory latency will be fine for the vast majority of games, but will be inferior to a system with a lot of slow cores in a rendering scenario. We believe that a minimum of 4/4 (4 physical cores and 4 threads) processor is suitable for a budget gaming computer. At the same time, some games can load it at 100%, slow down and freeze, and performing any tasks in the background will lead to a drop in FPS. Ideally, the budget shopper should aim for a minimum of 4/8 and 6/6. A gamer with a big budget can choose between 6/12, 8/8 and 8/16. Processors with 10 and 12 cores can perform well in games with high frequency and fast memory, but are overkill for such tasks. Also, buying for the future is a dubious undertaking, since in a few years many slow cores may not provide sufficient gaming performance. When choosing a processor to work with, consider how many cores your programs use. For example, photo and video editors can use 1-2 cores when working with filtering, and rendering or converting in the same editors already uses all threads. Data obtained from tests by users who tested their systems both with overclocking (maximum value in the table) and without (minimum). A typical result is shown in the middle, the fuller the color bar, the better the average result among all tested systems. Benchmarks Benchmarks were run on stock hardware, that is, without overclocking and with factory settings. PassmarkAMD Athlon 64 X2 Dual Core 4200+ 651 Intel Core2 Duo E6550 881 (+ 26.1%) Characteristics Data Data still not filled out, so there may be no information on the tables to be taken out of the tables. existing features.Basic
Video core
RAM
PCI
Data Security
Decoration
Which is betterAMD Athlon 64 X2 Dual Core 4200+
Intel Core2 Duo E6550
How are 9 similar?0017
Compare Intel Core 2 Duo SU9300 vs AMD Athlon 64 X2 4000+
| |||||||||||||||||||||||||||||||||||||||||||||||||||||||||||||||||||||||||||||||||||||||||||||||||||||||||||||||||||||||||||||||||||||||
 1 (+2%)
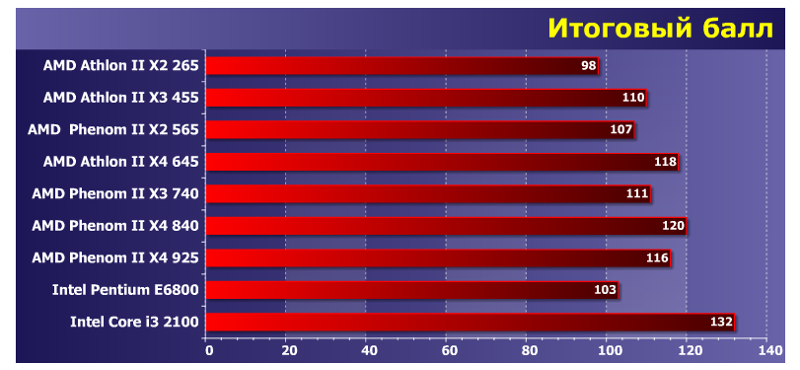
 Therefore, on overclocked systems, the points can noticeably differ upwards. Also, small performance changes may be due to the BIOS version.
  The smaller the technical process, the more perfect the technology, the lower the heat dissipation and power consumption.

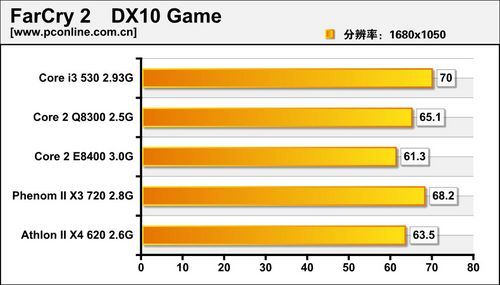
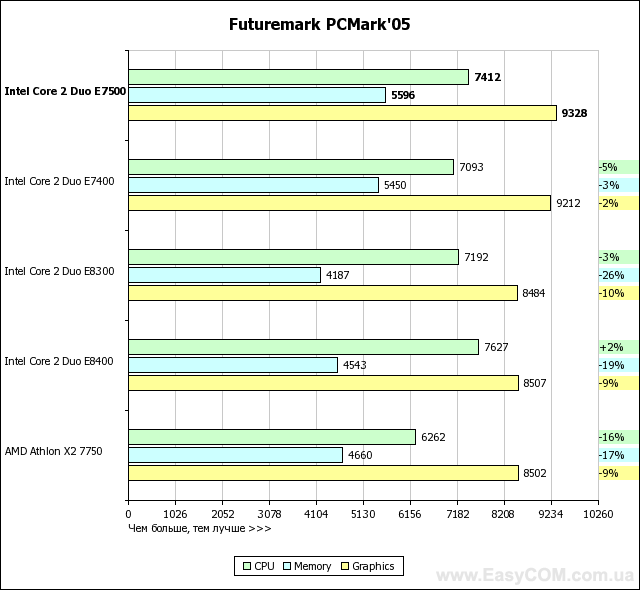
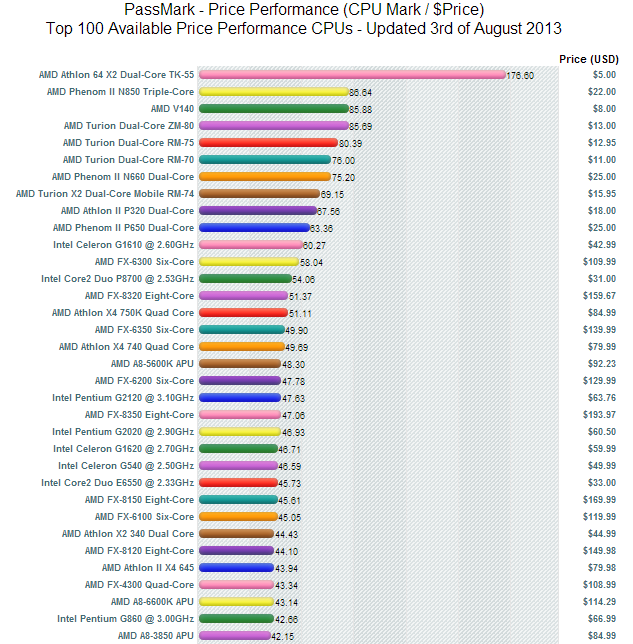
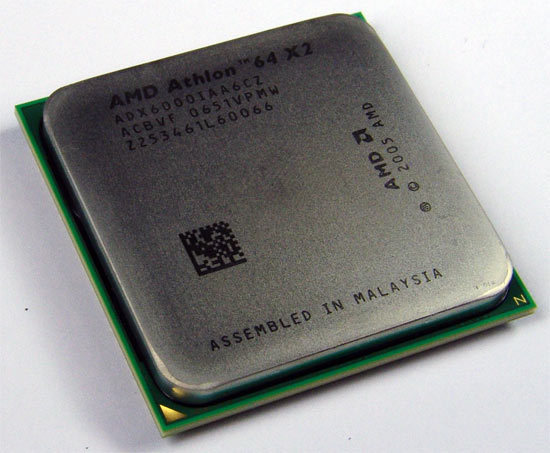
| Intel Core 2 Duo SU9300 | AMD Athlon 64 x2 4000+ | |
|---|---|---|
| two processors appeared at the same time | ||
| CPUs 2300 seriously loses in terms of base frequency, 1200 MHz versus 2000 MHz | Athlon 64 X2 4000+ significantly outperforms in terms of base clock frequency, 2000 MHz versus 1200 MHz Core 2 Duo SU9300 | Athlon 64 X2 4000+ is less technologically advanced, because its technical process is significantly larger and amounts to 90 Nanometers |
| In the Core 2 Duo SU9300 processor much more transistors, 410 million versus 153 million | Model Athlon 64 X2 4000+ contains significantly less transistors, 153 million | |
| The Athlon 64 X2 4000+ will need a more powerful cooling system, since its heat dissipation is 65 watts | ||
Core 2 Duo SU9300 has a much higher temperature threshold of 105 degrees. And this is an undeniably significant plus And this is an undeniably significant plus |
The maximum core temperature limit for Athlon 64 X2 4000+ reaches 72 degrees Celsius. Slightly inferior to the Core 2 Duo SU9300 | |
| The Core 2 Duo SU9300 has a much smaller die area of 107 mm 2 | The Athlon 64 X2 4000+ has a much larger die area of 290 sq. mm0040 | |
| L1 cache of CPU Core 2 Duo SU9300 is much smaller compared to Athlon 64 X2 4000+ and is 128 Kilobytes | equals 256 KB | |
Comparison of instructions and technologies

| Technology or instruction name | Intel Core 2 Duo SU9300 | AMD Athlon 64 X2 4000+ | Short description |
|---|---|---|---|
| EIST (Enhanced Intel SpeedStep) | — | Enhanced Intel SpeedStep Power Saving Technology. | |
| Stop Grant state | — | Energy saving status. | |
| Sleep state | — | Sleep state. | |
| Deep Sleep state | — | Deep sleep state. | |
| Deeper Sleep state | — | Deeper sleep state. | |
| Enhanced Deeper Sleep state | — | Improved state of deeper sleep.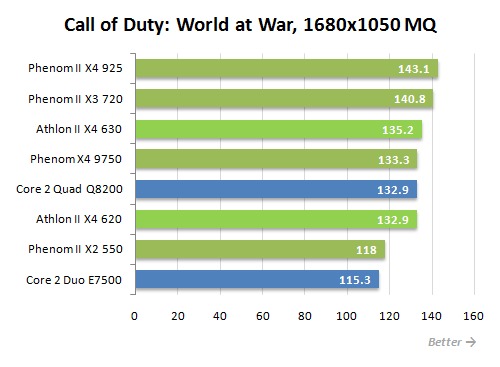 |
|
| Stop Grant mode | — | Energy saving status. | |
| Cool’n’Quiet | — | Coolness and silence. |
| Technology or instruction name | Intel Core 2 Duo SU9300 | AMD Athlon 64 X2 4000+ | Short description |
|---|---|---|---|
| MMX (Multimedia Extensions) | Multimedia extensions. | ||
| SSE (Streaming SIMD Extensions) | Streaming SIMD processor extension. | ||
| SSE2 (Streaming SIMD Extensions 2) | Processor Streaming SIMD Extension 2. | ||
| SSE3 (Streaming SIMD Extensions 3) | Streaming SIMD Processor Extension 3.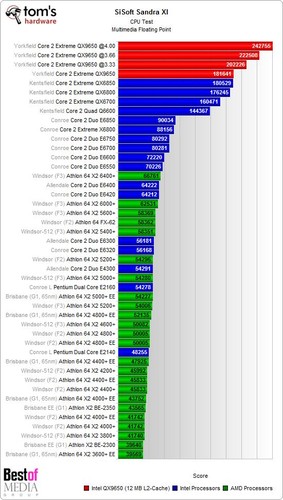 |
||
| SSSE3 (Supplemental Streaming SIMD Extension 3) | — | Additional SIMD extensions for streaming 3. | |
| EM64T (Extended Memory 64-bit Technology) | — | 64-bit extended memory technology. | |
| NX (Execute disable bit) | — | Execution inhibit bit. | |
| SSE4.1 (Streaming SIMD Extensions 4.1) | — | Processor 4.1 streaming SIMD extension. | |
| AMD64 | — | 64-bit microprocessor architecture developed by AMD. | |
| 3DNow! | — | Optional MMX extension for AMD processors. |
| Technology or instruction name | Intel Core 2 Duo SU9300 | AMD Athlon 64 X2 4000+ | Short description |
|---|---|---|---|
| TXT (Trusted Execution Technology) | — | Trusted Execution Technology. |
|
| EVP (Enhanced Virus Protection) | — | Improved virus protection. | |
| EDB (Execute Disable Bit) | — | Execute trip bit. |
| Technology or instruction name | Intel Core 2 Duo SU9300 | AMD Athlon 64 X2 4000+ | Short description |
|---|---|---|---|
| VT-x (Virtualization technology) | — | Virtualization technology. | |
| AMD-V | — | AMD-V Virtualization Technology. |
| Technology or instruction name | Intel Core 2 Duo SU9300 | AMD Athlon 64 X2 4000+ | Short description |
|---|---|---|---|
| Hyper Threading | — | Hyperthreading technology. |
|
| Dynamic FSB frequency switching | — | Dynamic FSB frequency switching. | |
| DBS (Demand Based Switching) | — | Switching on request. |
Benchmarks
Overall performance rating
Main rating is calculated according to the formula, taking into account all the data, such as benchmark test results, release year, temperature data, architecture, instructions, number of cores, threads, frequency, socket, technology automatic overclocking, and other characteristics. The results of the overall rating showed that Athlon 64 X2 4000+ surpasses its rival Core 2 Duo SU9 in most parameters300. The Core 2 Duo SU9300 barely scores 585.99 points compared to its competitor.
PassMark CPU Mark
Almost all of our CPUs have passed PassMark tests. It includes a wide range of tools for evaluating personal computer data, in particular CPUs.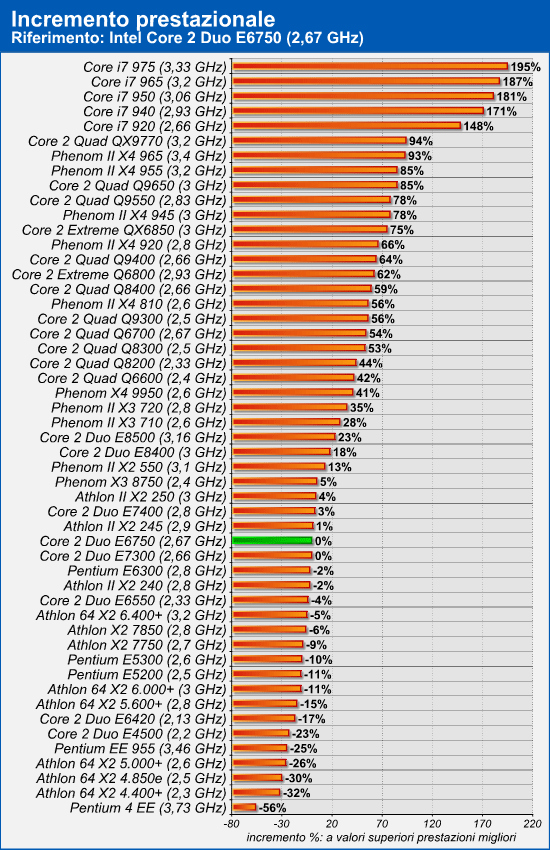 Diagnostics include compression, game physics calculations, floating point calculations, integer calculations, encryption, extended instruction checking, multi-threaded and single-threaded tests. At the same time, it is possible to compare the results obtained with other configurations in the database. This is perhaps the most popular benchmark tester in Runet. Performance Test showed a clear advantage of the Athlon 64 X2 4000+ processor (632 points) over the Core 2 Duo SU9300 (485 points). The Core 2 Duo SU9300 with a score of 485 clearly loses in this test.
Cinebench 10 (32 bit) Single-threaded test
This benchmark for testing video cards and processors is very outdated nowadays. Single-Thread in its work uses only one core and one thread for rendering. The main mode of testing for speed is working with light, imitation of global illumination, photorealistic rendering of a 3D scene, spatial light sources, multilevel reflections, and procedural shaders. Released by MAXON, it was based on the Cinema 4D 3D editor. It uses a method of geometric optics — ray tracing. Works on Mac OS, Windows. It is possible to check multi-processor systems.
Cinebench 10 (32 bit) Multi-thread test
Multi-Thread is another test method in Cinebench R10, which already uses multi-thread and multi-core test method. Keep in mind that the possible number of threads in this version of the program is limited to sixteen.
Cinebench 11.5 (64-bit) Multi-threaded test
Multi-threaded version of the CINEBENCH 11.5 benchmark — which has the ability to load the processor at 100 percent, using all threads and cores. Unlike previous versions of the program, 64 threads are already used here. Testing Core 2 Duo SU9300 in the Cinebench 11.5 benchmark showed a result of 0.77 points, slightly ahead of its competitor. At this time, Athlon 64 X2 4000+ gets its 0.74 points, which fully justifies their close positions in the rating.
Cinebench 11.5 (64-bit) Single-threaded test
Good old multifunctional Cinebench version 11.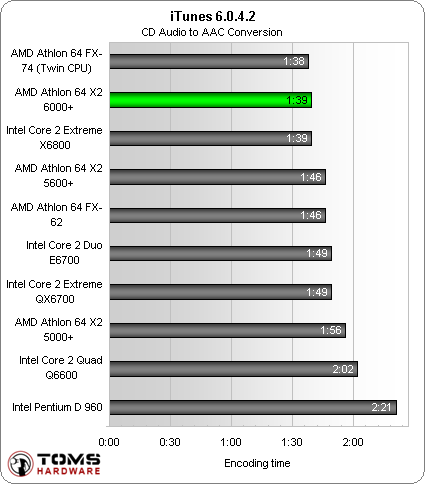 5 from Maxon. His tests have not lost their relevance today. In this case, Single-Core tests are performed by using one core and one thread. In tests, as before, the ray tracing process is used, a complex 3D room is rendered with many glass and crystal and translucent balls. The result of the check is the value «number of frames per second». Testing in single-threaded mode of the Core 2 Duo SU9 processor300 in Cinebench 11.5 Single-Core showed that with a score of 0.36 points, it is not far ahead of the competitor. But the Athlon 64 X2 4000+ scored 0.31 points in this test.
Cinebench 15 (64-bit) Multi-threaded test
Multi Core version Cinebench 15 — tests your build to the fullest, showing everything it can. All CPU cores and threads are involved in rendering complex 3D models. The program is ideal for testing modern multithreaded CPUs from AMD and Intel. it can use 256 threads. Core 2 Duo SU9300, with a score of 66.31, doesn’t outperform the Cinebench r15 multi-thread benchmark.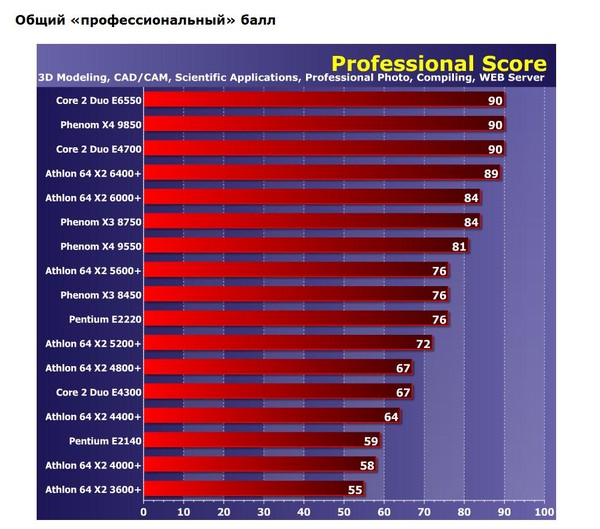 The Athlon 64 X2 4000+ is slightly behind it with 65.08 points.
Cinebench 15 (64-bit) Single-threaded test
Cinebench Release 15 is the most up-to-date benchmark from Finns from Maxon. A complex 3D scene is being rendered with many light sources, complex objects and reflections. In this version of the Single Core program, only one thread is involved in rendering. The system is being checked: both CPU and video cards. For processors, the result of the calculation is the number of PTS points, and for video controllers, the number of frames per second FPS. The single-threaded test of the Athlon 64 X2 4000+ processor in the Cinebench R15 program showed a result of 32.85 points, slightly ahead of the competitor. With a score of 30.08 in this test, the Core 2 Duo SU9300 is not far behind him.
Geekbench 4.0 (64-bit) Multi-threaded test
This is a 64-bit multi-threaded Geekbench 4 benchmark. It is the wide cross-platform support for different devices and operating systems that makes Geekbench tests the most valuable now.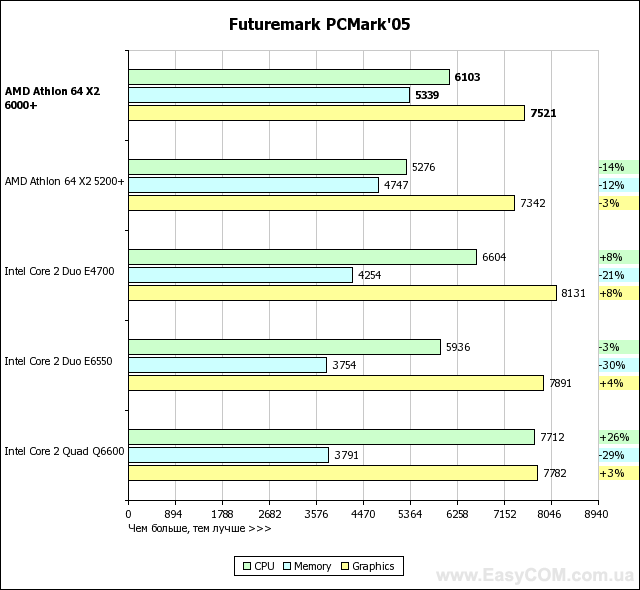 In Geekbench 4, the 64-bit multi-core Core 2 Duo SU9300 scored 1494.69, slightly better than the Athlon 64 X2 4000+. In this test, the Athlon 64 X2 4000+ scores 1376.95 points.
Geekbench 4.0 (64-bit) Single-threaded test
The Single-Core version uses one processor thread. The program, like its earlier versions, runs on OS running Linux, Windows, Mac OS. For the first time ever, iOS and Android smartphones are also supported in this version of the program. The current single-thread version of Geekbench 4 for testing laptops and home PCs. Core 2 Duo SU9300 scores higher in Geekbench 4 single-thread test with a score of 904.49 points, but not much ahead of the opponent. But the Athlon 64 X2 4000+ itself also showed a good score of 805.65 points, slightly losing its place to the Core 2 Duo SU9300.
Geekbench 3 (32 bit) Multi-Thread Benchmark
Multi-Thread benchmark Geekbench 3 — allows you to make a great stress test on your PC and demonstrate how stable your system is.
Geekbench 3 (32 bit) Single-threaded test
The 32-bit version of the test loads no more than one processor core and one thread. The Geekbench cross-platform tester is usually used to test the system under Mac, but it can be run on both Windows and Linux. The basic purpose is to test the performance of processors.
Geekbench 2
An old version of the Geekbench 2 program. There are about two hundred CPU models on our website that have test data in this program. Today there are more recent versions, the fifth and 4v.
X264 HD 4.0 Pass 1
In essence, this is a practical test of processor performance by transcoding HD video files to the new H.264 format or the so-called MPEG 4 x264 codec. This test is faster than Pass 2 because it renders at the same rate. This is the most suitable test for multi-core and multi-threaded CPUs. The number of frames processed per second is the result of the check. MPEG 4 video processing speed for Core 2 Duo SU9300 is slightly higher than that of the Athlon 64 X2 4000+ at 19. 17 FPS. Athlon 64 X2 4000+ managed to score 17.51 FPS, slightly behind the first processor.
X264 HD 4.0 Pass 2
This is a slightly different, slower test based on video file compression. It is important to be aware that a real task is being simulated, and the x264 codec is used in many encoders. As a result, we get a better quality video file. The same MPEG4 x264 codec is used, but the processing is already happening at a variable rate. The result obtained is also determined by frames per second. Therefore, the test results really reflect the performance of the platform. While encoding a video file with a Core 2 Duo SU9 processor300 to mpeg4 format — a processing speed of 4.16 Frames / s was obtained. While the Athlon 64 X2 4000+ is slightly behind with 4.07 FPS.
3DMark06 CPU
This test is often used by overclockers, overclockers and gamers. Benchmark for testing CPU and video systems. Created using the DirectX 9.0 library by Futuremark. CPUs are tested in two ways: the game’s AI calculates the pathfinding, and the second test simulates the game’s physics engine using PhysX. The Athlon 64 X2 4000+ showed itself a little faster in the gaming physics and pathfinding tests, scoring up to 1067.55 points. The Core 2 Duo SU9 also coped with these tasks.300 showing a good result of 1028 points.
3DMark Fire Strike Physics
We can say that approximately 200 CPUs on our website have data in the 3DMark Fire Strike Physics test. It includes a test that performs game physics calculations.
WinRAR 4.0
A familiar file archiver. Checks were made under the control of the Windows system. The speed of compression in the RAR archive was tested, for these purposes large amounts of random data were used. The resulting speed during compression «Kb / s» — this is the result of the test. Core 2 Duo SU9300 is slightly ahead of its competitor in WinRAR file compression speed, the result of data encoding is 526. 12 Kb/s. The Athlon 64 X2 4000+ delivered an encoding speed of 446.46 Kbps.
TrueCrypt AES
This is not quite a tester, but the results of its work can give an assessment of the performance of the entire system. The program includes the function of instant encryption of disk partitions. It can fully function in various operating systems Mac OS X, Linux and Windows. It so happened that support for this project was stopped on May 28, 2014. Our site shows the results of encryption speed in gigabytes per second using the AES algorithm.
|
3DNews Processors and memory AMD processors Testing of junior AMD Athlon 64 X2 for… The most interesting news
Comparing Athlon 64 X2 3600+ with 3800+, Pentium 4 D915, D945 and Core 2 Duo 6300 ⇣ Contents
For a long time, dual-nuclear wars went unnoticed by the middle strata of the population — everyone knew about them, but few could afford to participate in them. Both leaders of the dual-core processor market have ways of waging war that are both similar and different at the same time. Similar in total price reduction — a new type of auction «Who is less?». AMD, resting on its laurels for a long time, presented the «most productive» processors at not the most affordable price, but Intel’s aggressive pricing policy forced it to reconsider prices and plans. At first, hoping to win, I had to seriously reduce the prices for existing and new Socket AM2 processors. But this was not enough — without a new, even cheaper and more affordable dual-core in any way. And armed with the idea “Dual-core AMD processors to the masses!”, engineers with a flick of the wrist turn Athlon 64 X2 3800+ into Athlon 64 X2 3600+ by cutting the second-level cache memory on each of the cores by half — it was 512 KB, and now 256 KB. AMD Athlon 64 X2 3600+ AM2
The Athlon 64 X2 3600+ test sample came to us in an antistatic bag. The junior model of the dual-core family of AMD processors is still very rare in boxed, so-called «boxed» delivery options — most often OEM. A very popular distribution method, both for collectors and for our retailers.
The Athlon 64 X2 3600+ processor has a slightly unusual ADO3600IAA4CU marking, which stands for something like this: ADO — Athlon 64 with a thermal package up to 65 W for workstations (the processor consumes less power and heats up less), 3600 — processor rating, I — package type 940 pin OµPGA (Socket AM2), A — core supply voltage ≈1.25-1.35 V, A — maximum allowable case temperature ≈55-70°C, 4 — total L2 cache size 512 KB (2×256 KB), CU — Winsdor core (the same is used in other Athlon 64 X2 processors with 2×512 KB L2 cache). Judging by the markings, we have an Athlon 64 X2 3800+ with half of the L2 hardware blocked for each core, which made it cheaper and more economical in terms of power consumption. And now a complete information summary about this processor and the GEIL DDR2-800 memory used during its testing, obtained using the CPU-Z utility.
An attempt to overclock the Athlon 64 X2 3600+ turned out to be quite successful, considering that we used the «boxed» cooler out of the box with the Athlon 64 X2 3800+. Even without raising the voltage, the processor worked stably at a frequency of 2600 MHz, while the memory worked like DDR2-866, but with Command Rate 2T. It was not possible to overclock the processor even more — although its temperature did not rise above 60 ° C, the stability of the system disappeared. Apparently, this is the limit of this instance.
In addition, the Athlon 64 X2 3800+ processor for Socket 939 is taking part in the testing — with its help we will check what the Athlon 64 X2 benefits from accelerating the memory subsystem, from the ability to use DDR2-400/533/667/800, from switching to socketAM2.
And before getting acquainted with the competitor’s processors, there are updated tables with the main characteristics of new and outgoing AMD Athlon 64 X2 models. Athlon 64 X2 Socket AM2
Athlon 64 X2 Socket 939
Intel Pentium D 915
But the processors from Intel were tested in boxed versions in order to save the testlab from searching for a suitable cooler (as if it were so hard?) and bring the results, especially overclocking, closer to the average.
There is no point in dwelling on the configuration, because. it has not changed for a long time, and the standard cooler has remained standard, but the processor itself …
At Intel, with the decoding of capabilities, everything is a little simpler — all the main characteristics are printed on the heat-distributing cover. The processor operates at a frequency of 2.8 GHz, has 4 MB of L2 cache (2 MB per core), and uses an 800 MHz system bus. PCG 05A is the required CPU power mode that the motherboard must provide (13 A DC, 16.5 A peak current for a minimum of 10 ms). More detailed information about the processor and the mode of operation of the RAM should be provided by the CPU-Z utility.
But it turned out that CPU-Z version 1.36 could not correctly recognize the Intel Pentium D 915 processor. To dispel doubts about the tested processor, we arm ourselves with the sSpec of the processor — SL9DA and go to processorfinder.
The manufacturer’s website reports that this is indeed an Intel Pentium D 915 and tells all the details about it; Please note — Intel Virtualization Technology is not supported. Having got acquainted with the processor, we tried to overclock it — yet this is one of the most interesting moments. The result impressed us at first — the system booted at a frequency of 3790 MHz.
But, as the first tests showed, the standard cooling system was unable to cool the processor, to the frequency of which an extra gigahertz was added — the core temperature rose above 66 ° C, and Thermal Throttling began. In the process of searching for a frequency at which the processor would work stably, overclocking had to be reduced by as much as 300 MHz. The final frequency of the «successfully» overclocked Intel Pentium D 915 was 3500 MHz, but using a more impressive cooling system, the overclocking potential can be easily increased.
As the main opponents for the Intel Pentium D 915, we chose a couple more processors that appeared this summer. The first is the Intel Pentium D 945, which has the same set of features and technologies, but operates at a frequency of 3.4 GHz, which, after overclocking, turned out to be on the shoulder of the Intel Pentium D 915.
The second is the Intel Core 2 Duo E6300, the youngest member of the family that revolutionized the industry.
And just before testing, updated tables with specifications for Intel Pentium D processor lines. Intel Pentium D9xx LGA775
Intel Pentium D 8xx LGA775
Testing
A fairly large set of processors was selected for testing, and therefore it became possible to answer not one question “Who is faster?”, But several at once:
To answer these questions, three stands were assembled. Test stand for AMD Socket 939:
Test stand for AMD Socket AM2:
Test bench for Intel LGA775:
But first, let’s see how processors react to changes in the speed of the memory subsystem. Let’s start with the AMD Athlon 64 X2 3600+ combined with DDR2-400/533/667/800.
Despite the fact that the Futuremark PCMark’05 package turned out to be almost indifferent to the performance of RAM, the rest of the packages and tasks showed a performance increase of up to 35% when switching from DDR2-400 to DDR2-800, i.e. In most cases, saving on RAM is not worth it. What about Intel Pentium D 915 ? Unfortunately, the ASUS P5B Deluxe/Wi-Fi-AP motherboard does not allow working with DDR2-400, with a system bus frequency of more than 533 MHz and DDR2-1066 was not available, but the missing results can be approximately calculated from the results obtained.
Based on the results obtained, we can conclude that for Intel Pentium D processors, fast RAM is slightly less important than for AMD Athlon 64 X2. Having dealt with the requirements of test systems for RAM, we proceed to a direct comparison of processor performance in various tasks. Let’s start with synthetics…
SiSoftware Sandra 2007 SP1 equalizes performance of Athlon 64 X2 3600+ and Athlon 64 X2 3800+ despite different cache sizes; the test package shows a slight gap between Athlon 64 X2 3800+ Socket AM2 and Socket 939 in arithmetic at higher memory handling speeds; highlights the excellent performance of the Athlon 64 X2 3600+, especially when overclocked, and compared to the Intel Pentium D 915, and even the Intel Core 2 Duo E6300.
Futuremark PCMark’05 has long complained that it prefers processors with higher clock speeds — which we see in the processor test. Let’s move on to practical tests for information compression (a 1 GB folder with programs and documents is archived), as well as audio encoding (540 MB *.wav to *.mp3) and video (74 MB mpeg video to *.avi). Here, the faster the better.
The WinRar 3.60 archiver, unlike 7-ZIP 4.42, has better optimization for multi-threaded compression on dual-core processors, which is clearly seen in the results. In general, we finally found tasks where the Athlon 64 X2 3600+ lags behind due to the reduced cache, and the Athlon 64 X2 3800+ shows a slight performance increase due to faster memory handling. Media encoding continues to be Intel’s forte, especially when compressing audio using the LAME codec, but overclocking the Athlon 64 X2 3600+ changes the situation and it is ready to compete even with the Intel Core 2 Duo E6300, and the Intel Pentium D 915 he is not a rival at all.
When working in CAD/CAM packages, memory speed is very important, and therefore processors for Socket AM2 outperform Socket 939, even with a smaller L2 volume. But here the Intel Pentium D 915 is already quite a serious competitor, which, after overclocking, almost catches up with the Intel Core 2 Duo E6300.
According to the results of gaming benchmarks from Futuremark, there is a slight dependence of the performance of AMD processors on the size of the L2 cache — there is practically no lag. But DDR2 memory was not as useful as it should be. But this does not prevent Athlon 64 X2 3600+ in new versions of the package from being more productive than Intel Pentium D 9fifteen.
Interesting results are shown by Quake 3, which is very sensitive to the speed of the memory controller. All Intel processors were faster. AMD’s DDR2 controller didn’t stand up to scrutiny.
In games, the Athlon 64 X2 3600+ lags slightly behind the Athlon 64 X2 3800+, but there is a slight increase in performance for Socket AM2 processors. A Intel Pentium D 915 in games does not look as good as in multimedia. And only a significantly larger amount of cache memory keeps it from falling behind the Athlon 64 X2 3600+ catastrophically. Terminals
We will try to summarize the answers to all the questions posed in the review. AMD turned out to be a rather successful dual-core processor Athlon 64 X2 3600+, which is very close behind the Athlon 64 X2 3800+ and is faster than the Intel Pentium D 915 in almost all tasks, despite the reduced L2 cache and the practical absence of the use of using DDR2 memory. Intel’s most affordable dual-core processor was only faster in some areas, which is also good, so don’t write it off. We express our gratitude to the company PF Service LLC (Dnepropetrovsk) for the processors and other equipment provided for testing.
⇣ Contents If you notice an error, select it with the mouse and press CTRL+ENTER. Related materials Permanent URL: https://3dnews.ru/185509/page-1.html ⇣ Comments |
The tale of how processor overclocking died
This material was written by a site visitor and rewarded for it.
Prologue.
From time immemorial, people have accelerated technology. This gave a powerful increase in performance per clock. And it’s completely free. Anyone could freely add 10, 50, 100 or more percent of additional speed.
This was especially true for central processing units. Their architecture is designed in such a way that it is impossible to physically create a device that would operate only at factory frequencies. There will always be an opportunity to add more. And enthusiasts took advantage of it. And it seemed that it would always be so.
recommendations
Introduction. Celeron 300A. The dawn of overclocking.
Let’s start with the divine Celeron 300A. In the late 90s it marked the dawn of overclocking (pity the decline was so quick). With a frequency of 300 MHz, the Celeron 300A overclocked to an impressive 450 MHz without the slightest problem, and some conquered all 500. This is as if the Core i5-12400F could now be run at 7 GHz.
It was tearful to look at those who overpaid ten times more for divine top-end Pentiums. They were unaware that students who ate doshirak had a much higher FPS in games. The Pentium III following the 300A set a new bar, and could go from just over 1 GHz to almost 2 GHz. It was a pattern break. Any most incredible tasks at such a frequency were up to him.
Part 1. Pentium IV vs Athlon XP / 64. Sworn enemies.
The early 2000s saw an epic battle between marketing and common sense. On the one hand, Pentium IV is a processor with high-budget advertising support, on the other hand, Athlon XP and Athlon 64 are extremely successful «stones», thanks to which AMD managed to capture a significant market share.
What overclockers love about Pentium IV is the fact that the NetBurst architecture, on which it is based, is tuned for operation at high frequencies. Yes, even if they were «corn», but, on the other hand, they so attracted lovers of large numbers. The Celeron D 352, which has set a record among all Intel processors to date, can be noted separately. He obeyed the frequency of 8543.7 MHz!
AMD kept up. In practice, CPUs on sockets 462, 939 and AM2 allowed squeezing out another 10, 20 or more percent of additional megahertz. Significantly lower cost with almost the same overclocking performance made them bestsellers.
Part 2. Socket 775. To infinity and beyond.
The Intel Research Center is already hard at work on a processor that will bury AMD for 11 long years. You had to think fast. Athlon 64 X2 proved to be so good that it quickly «captured the planet».
The challenge was to achieve both high performance and low power consumption. Or at least the first one. But everything worked out, and exceeded the plan. Pentium M mobile chips were taken as the basis. Enthusiasts had already «planted» them on the desktop Socket 478 through a special adapter. At the same time, at a much lower frequency, the Pentium M in many cases outperformed the fastest Pentium IV and Athlon XP / 64. in the mobile segment on the Intel Centrino platform). But, most importantly, the frequency potential of new products was not just high, but truly incredible.
The budget Penitum E2XX0/7X00 and younger Core E4X00/6XX0 beat the expensive $1000 Core 2 Extreme and even the Core 2 Quad with a couple of BIOS manipulations, since multi-threaded applications were not particularly common. This was a crushing defeat for AMD before rehab with Ryzen a decade later.
Part 3. Sandy Bridge. Sunset overclocking.
In 2011, something happened that made Intel Corporation both loved and hated by all overclockers in the world. She released the legendary Sandy Bridge.
Barrel of honey: 30% performance increase over the previous generation and excellent overclocking potential. Moreover, it is air-cooled, without the use of «special equipment». Anyone could get the treasured 5 GHz. Fly in the ointment: overclocking is available only on expensive motherboards with P67 and Z68 chipsets and expensive processors with the K index.
Sandy Bridge completely destroyed the whole sacred meaning of overclocking as the essence of being a computer enthusiast — to squeeze out the maximum additional performance without investing money. Now the entire increase that the user can receive has already been taken into account by the manufacturer.
Due to the lack of competition, this misunderstanding continued for the next six years. «Corn» AMD FX were of no interest to anyone, as they required expensive motherboards with a high-quality element base, and the «exhaust» was with Gulkin’s nose due to the fact that the basic performance of the FX’s themselves was simply no.
Part 4: Ryzen. Shadow of overclocking.
As always, sunset is followed by sunrise. And it happened, but it was more of a skylight. For more than five years, the Blues reigned supreme in the ocean of overclocking available only to the elite. AMD, having gained strength, once again burst into the world of overclocking with its Ryzen, dealing a crushing blow to the Intel monopoly.
Inexpensive B350 chipsets and all Ryzen models were completely free to overclock to any available values. No restrictions were laid in principle. Cheap Ryzen 1600s have become absolute hits. «Penny» motherboards and 4 GHz trampled the entire HEDT segment of Intel, including expensive platforms for non-poor enthusiasts based on Socket LGA 2011-3.
But all this collapsed with the arrival of the latest Ryzen series for Socket AM4. The miserable overclocking potential of new products leveled all hopes for AMD. There was no point in squeezing out a few extra hundreds of megahertz, wasting money on cooling, since the performance did not increase significantly.