Intel Core 2 Duo T5600 Benchmarks
Benchmark results for the Intel Core 2 Duo T5600 can be found below. The data on this chart is gathered from user-submitted Geekbench 5 results from the Geekbench Browser.
Geekbench 5 scores are calibrated against a baseline score of 1000 (which is the score of an Intel Core i3-8100). Higher scores are better, with double the score indicating double the performance.
CPU Benchmark Scores
224
Single-Core Score
409
Multi-Core Score
Processor Information
| Processor | Intel Core 2 Duo T5600 |
| Frequency | 1830 MHz |
| Cores | 2 |
| Threads | 2 |
| TDP | 34 W |
| Codename | Merom |
| Package | PBGA479, PPGA478 |
Merom Benchmarks
- Single-Core
- Multi-Core
| Processor | Score | |
|---|---|---|
|
Intel Core 2 Extreme X7900
2. |
625 |
|
|
Intel Core 2 Duo T7700
2.4 GHz (2 cores) |
554 |
|
|
Intel Core 2 Duo T7800
2.6 GHz (2 cores) |
517 |
|
|
Intel Core 2 Duo T5850
2.2 GHz (2 cores) |
493 |
|
|
Intel Core 2 Duo T7600
2.3 GHz (2 cores) |
472 |
|
|
Intel Core 2 Duo T7400
2.2 GHz (2 cores) |
469 |
|
|
Intel Core 2 Duo T5900
2.2 GHz (2 cores) |
466 |
|
|
Intel Core 2 Duo T7300
2.0 GHz (2 cores) |
465 |
|
|
Intel Core 2 Duo T7500
2.2 GHz (2 cores) |
459 |
|
|
Intel Core 2 Duo L7700
1.8 GHz (2 cores) |
455 |
|
|
Intel Core 2 Duo T5870
2. |
445 |
|
|
Intel Core 2 Duo T7250
2.0 GHz (2 cores) |
436 |
|
|
Intel Core 2 Duo T7200
2.0 GHz (2 cores) |
431 |
|
|
Intel Pentium T3400
2.2 GHz (2 cores) |
425 |
|
|
Intel Core 2 Duo T5750
2.0 GHz (2 cores) |
418 |
|
|
Intel Core 2 Duo T5800
2.0 GHz (2 cores) |
413 |
|
|
Intel Core 2 Duo T7100
1.8 GHz (2 cores) |
412 |
|
|
Intel Core 2 Duo T5670
1.8 GHz (2 cores) |
411 |
|
|
Intel Core 2 Duo T5550
1.8 GHz (2 cores) |
409 |
|
|
Intel Core 2 Duo T5600
1.8 GHz (2 cores) |
409 |
|
|
Intel Celeron T1700
1. |
397 |
|
|
Intel Celeron T1600
1.7 GHz (2 cores) |
396 |
|
|
Intel Pentium T2410
2.0 GHz (2 cores) |
396 |
|
|
Intel Pentium T3200
2.0 GHz (2 cores) |
394 |
|
|
Intel Core 2 Duo T5300
1.7 GHz (2 cores) |
389 |
|
|
Intel Core 2 Duo T5500
1.7 GHz (2 cores) |
363 |
|
|
Intel Pentium T2370
1.7 GHz (2 cores) |
359 |
|
|
Intel Core 2 Duo L7500
1.6 GHz (2 cores) |
355 |
|
|
Intel Pentium T2330
1.6 GHz (2 cores) |
352 |
|
|
Intel Core 2 Duo T5270
1.4 GHz (2 cores) |
349 |
|
|
Intel Pentium T2390
1.9 GHz (2 cores) |
337 |
|
|
Intel Pentium T2310
1. |
324 |
|
|
Intel Core 2 Duo T5200
1.6 GHz (2 cores) |
321 |
|
|
Intel Core 2 Duo T5470
1.6 GHz (2 cores) |
317 |
|
|
Intel Core 2 Duo T5250
1.5 GHz (2 cores) |
314 |
|
|
Intel Core 2 Duo T5450
1.7 GHz (2 cores) |
308 |
|
|
Intel Core 2 Duo U7700
1.3 GHz (2 cores) |
307 |
|
|
Intel Core 2 Duo U7600
1.2 GHz (2 cores) |
262 |
|
|
Intel Core 2 Duo U7500
1.1 GHz (2 cores) |
247 |
|
|
Intel Core 2 Duo L7100
1.2 GHz (2 cores) |
237 |
|
|
Intel Celeron 560
2.1 GHz (1 core) |
219 |
|
|
Intel Celeron M 530
1. |
218 |
|
|
Intel Celeron 550
2.0 GHz (1 core) |
208 |
|
|
Intel Celeron 540
1.9 GHz (1 core) |
178 |
|
 0 GHz (2 cores)
 8 GHz (2 cores)
 5 GHz (2 cores)
 7 GHz (1 core)
Core 2 Duo T5600 [in 5 benchmarks]
Intel
Core 2 Duo T5600
Buy
- Interface
- Core clock speed
- Max video memory
- Memory type
- Memory clock speed
- Maximum resolution
Summary
Intel started Intel Core 2 Duo T5600 sales 28 July 2006 at a recommended price of $241. This is Merom architecture notebook processor primarily aimed at office systems. It has 2 cores and 2 threads, and is based on 65 nm manufacturing technology, with a maximum frequency of 1830 MHz and a locked multiplier.
Compatibility-wise, this is PPGA478, PBGA479 processor with a TDP of 34 Watt.
It provides poor benchmark performance at
0.66%
of a leader’s which is AMD EPYC 7h22.
Core 2
Duo T5600
vs
EPYC
7h22
General info
Core 2 Duo T5600 processor market type (desktop or notebook), architecture, sales start time and pricing.
| Place in performance rating | 2581 | |
| Market segment | Laptop | |
| Series | Intel Core 2 Duo | |
| Architecture codename | Merom (2006−2008) | |
| Release date | 28 July 2006 (16 years ago) | |
| Launch price (MSRP) | $241 | of 305 (Core i7-870) |
| Current price | $31 (0. 1x MSRP) 1x MSRP) |
of 14999 (Xeon Platinum 9282) |
Technical specs
Basic microprocessor parameters such as number of cores, number of threads, base frequency and turbo boost clock, lithography, cache size and multiplier lock state. These parameters can generally indicate CPU performance, but to be more precise you have to review its test results.
| Physical cores | 2 (Dual-core) | |
| Threads | 2 | |
| Base clock speed | 1.83 GHz | of 4.7 (FX-9590) |
| Boost clock speed | 1.83 GHz | of 5.8 (Core i9-13900K) |
| Bus support | 667 MHz | |
| L1 cache | 64 KB | of 1536 (EPYC Embedded 3401) |
| L2 cache | 2 MB | of 12 (Core 2 Quad Q9550) |
| L3 cache | 0 KB | of 32768 (Ryzen Threadripper 1998) |
| Chip lithography | 65 nm | of 5 (Apple M1) |
| Die size | 143 mm2 | |
| Maximum core temperature | 100 °C | of 110 (Atom x7-E3950) |
| Number of transistors | 291 Million | of 57000 (Apple M1 Max) |
| 64 bit support | + | |
| Windows 11 compatibility | — | |
| Unlocked multiplier | — | |
| VID voltage range | 1. 0375V-1.3V 0375V-1.3V |
Compatibility
Information on Core 2 Duo T5600 compatibility with other computer components and devices: motherboard (look for socket type), power supply unit (look for power consumption) etc. Useful when planning a future computer configuration or upgrading an existing one.
Note that power consumption of some processors can well exceed their nominal TDP, even without overclocking. Some can even double their declared thermals given that the motherboard allows to tune the CPU power parameters.
| Number of CPUs in a configuration | 1 | of 8 (Opteron 842) |
| Socket | PPGA478, PBGA479 | |
| Thermal design power (TDP) | 34 Watt | of 400 (Xeon Platinum 9282) |
Technologies and extensions
Technological capabilities and additional instructions supported by Core 2 Duo T5600. You’ll probably need this information if you require some particular technology.
| Enhanced SpeedStep (EIST) | + | |
| Enhanced SpeedStep (EIST) | + | |
| Turbo Boost Technology | — | |
| Hyper-Threading Technology | — | |
| Idle States | — | |
| Demand Based Switching | — | |
| FSB parity | — |
Security technologies
Processor technologies aimed at improving security, for example, by protecting against hacks.
| TXT | — | |
| EDB | + |
Virtualization technologies
Supported virtual machine optimization technologies. Some are specific to Intel only, some to AMD.
Benchmark performance
Single-core and multi-core benchmark results of Core 2 Duo T5600. Overall benchmark performance is measured in points in 0-100 range, higher is better.
Overall score
This is our combined benchmark performance rating. We are regularly improving our combining algorithms, but if you find some perceived inconsistencies, feel free to speak up in comments section, we usually fix problems quickly.
Core 2 Duo T5600
0.66
- Passmark
- GeekBench 5 Single-Core
- GeekBench 5 Multi-Core
- 3DMark06 CPU
Passmark
Passmark CPU Mark is a widespread benchmark, consisting of 8 different types of workload, including integer and floating point math, extended instructions, compression, encryption and physics calculation. There is also one separate single-threaded scenario measuring single-core performance.
Benchmark coverage: 68%
Core 2 Duo T5600
662
GeekBench 5 Single-Core
GeekBench 5 Single-Core is a cross-platform application developed in the form of CPU tests that independently recreate certain real-world tasks with which to accurately measure performance. This version uses only a single CPU core.
Benchmark coverage: 37%
Core 2 Duo T5600
224
GeekBench 5 Multi-Core
GeekBench 5 Multi-Core is a cross-platform application developed in the form of CPU tests that independently recreate certain real-world tasks with which to accurately measure performance. This version uses all available CPU cores.
Benchmark coverage: 37%
Core 2 Duo T5600
409
3DMark06 CPU
3DMark06 is a discontinued DirectX 9 benchmark suite from Futuremark. Its CPU part contains two scenarios, one dedicated to artificial intelligence pathfinding, another to game physics using PhysX package.
Benchmark coverage: 19%
Core 2 Duo T5600
1560
Relative perfomance
Overall Core 2 Duo T5600 performance compared to nearest competitors among notebook CPUs.
Intel Celeron N3060
100
AMD Turion X2 RM-75
100
Intel Celeron Dual-Core T3000
100
Intel Core 2 Duo T5600
100
Intel Celeron T3000
100
AMD Athlon II N330
100
Intel Celeron B800
98.48
AMD equivalent
We believe that the nearest equivalent to Core 2 Duo T5600 from AMD is Athlon II N330, which is nearly equal in speed and higher by 3 positions in our rating.
Athlon II
N330
Compare
Here are some closest AMD rivals to Core 2 Duo T5600:
AMD E2-3000M
101.52
AMD Turion X2 RM-75
100
AMD Athlon II N330
100
Intel Core 2 Duo T5600
100
AMD Athlon II M300
98.48
AMD A4-3320M
95.45
AMD Athlon 64 X2 TK-57
95.45
Similar processors
Here is our recommendation of several processors that are more or less close in performance to the one reviewed.
Turion X2
RM-75
Compare
Celeron Dual
Core T3000
Compare
Celeron M
585
Compare
Core 2
Duo T5900
Compare
Core 2
Duo T5850
Compare
Core 2
Duo L7200
Compare
Recommended graphics cards
These graphics cards are most commonly used with Core 2 Duo T5600 according to our statistics.
GeForce Go
7400
10%
GeForce Go
7600
10%
GMA
950
10%
GeForce GT
220
5%
GeForce Go
7300
5%
GeForce GTX
260 Core 216 Rev. 2
2.5%
HD
Graphics
2.5%
Graphics Media
Accelerator (GMA) 3600
2. 5%
5%
Graphics Media
Accelerator (GMA) 950
2.5%
GeForce
945M
2.5%
User rating
Here is the rating given to the reviewed processor by our users. Let others know your opinion by rating it yourself.
Questions and comments
Here you can ask a question about Core 2 Duo T5600, agree or disagree with our judgements, or report an error or mismatch.
Please enable JavaScript to view the comments powered by Disqus.
Intel Core 2 Duo T5600 processor review: CPU specs, performance benchmarks
Buy on Amazon
Core 2 Duo T5600 processor released by Intel; release date: 28 July 2006. At the time of release, the processor cost $241. The processor is designed for mobile-computers and based on Merom microarchitecture.
CPU is locked to prevent overclocking. Total number of cores — 2, threads — 2. Maximum CPU clock speed — 1.83 GHz. Maximum operating temperature — 100°C. Manufacturing process technology — 65 nm. Cache size: L1 — 64 KB, L2 — 2048 KB.
Supported socket types: PPGA478, PBGA479. Maximum number of processors in a configuration — 1. Power consumption (TDP): 34 Watt.
Benchmarks
| PassMark Single thread mark |
|
|
|||
| PassMark CPU mark |
|
|
|||
| Geekbench 4 Single Core |
|
|
|||
| Geekbench 4 Multi-Core |
|
|
| Name | Value |
|---|---|
| PassMark — Single thread mark | 701 |
| PassMark — CPU mark | 662 |
| Geekbench 4 — Single Core | 1043 |
| Geekbench 4 — Multi-Core | 1639 |
Specifications (specs)
| Architecture codename | Merom |
| Launch date | 28 July 2006 |
| Launch price (MSRP) | $241 |
| Place in performance rating | 1880 |
| Processor Number | T5600 |
| Series | Legacy Intel® Core™ Processors |
| Status | Discontinued |
| Vertical segment | Mobile |
| 64 bit support | |
| Base frequency | 1. 83 GHz 83 GHz |
| Bus Speed | 667 MHz FSB |
| Die size | 143 mm2 |
| Front-side bus (FSB) | 667 MHz |
| L1 cache | 64 KB |
| L2 cache | 2048 KB |
| Manufacturing process technology | 65 nm |
| Maximum core temperature | 100°C |
| Maximum frequency | 1.83 GHz |
| Number of cores | 2 |
| Number of threads | 2 |
| Transistor count | 291 million |
| VID voltage range | 1. 0375V-1.300V 0375V-1.300V |
|
|
|
| Low Halogen Options Available | |
| Max number of CPUs in a configuration | 1 |
| Package Size | 35mm x 35mm |
| Scenario Design Power (SDP) | 0 W |
| Sockets supported | PPGA478, PBGA479 |
| Thermal Design Power (TDP) | 34 Watt |
| Execute Disable Bit (EDB) | |
| Intel® Trusted Execution technology (TXT) | |
| Enhanced Intel SpeedStep® technology | |
| FSB parity | |
| Idle States | |
| Intel 64 | |
| Intel® Demand Based Switching | |
| Intel® Hyper-Threading technology | |
| Intel® Turbo Boost technology | |
| Intel® Virtualization Technology (VT-x) | |
Navigation
Choose a CPU
Compare processors
Compare Intel Core 2 Duo T5600 with others
Intel
Core 2 Duo T5600
vs
Intel
Celeron N3160
Intel
Core 2 Duo T5600
vs
Intel
Atom Z3775
Intel
Core 2 Duo T5600
vs
AMD
GX-420CA
Intel
Core 2 Duo T5600
vs
Intel
Celeron N4120
Intel
Core 2 Duo T5600
vs
AMD
GX-420MC
Intel
Core 2 Duo T5600
vs
AMD
A4-9120e
CPU-Z Benchmark for Intel Core 2 T5600 (1T)
Best CPU performance — 64-bit — October 2022
Intel Core 2 T5600 (1T)
Back to validation
Intel Core i7-7700K
Intel Core i7-6700K
Intel Core i5-6600K
Intel Core i7-4790K
Intel Core i7-6850K
Intel Core i5-4690K
Intel Core i7-6900K
Intel Core i7-6800K
Intel Core i7-6950X
Intel Core i7-5930K
Intel Core i5-6600
Intel Core i7-4770K
Intel Core i7-6700
Intel Core i5-4670K
Intel Core i3-6100
Intel Pentium G3258
Intel Core i7-5820K
Intel Core i7-3770K
Intel Xeon E3-1230 v5
Intel Core i5-3570K
Intel Core i7-4790
Intel Core i7-4930K
Intel Core i7-4820K
Intel Core i5-4690
Intel Core i7-7500U
Intel Core i7-4770
Intel Core i5-6500
Intel Pentium G4400
Intel Core i5-4670
Intel Core i7-5960X
Intel Core i3-4170
Intel Core i7-3770
Intel Xeon E3-1231 v3
Intel Core i7-6820HK
Intel Core i5-4590
Intel Core i3-4160
Intel Core i5-3570
Intel Core i5-6400
Intel Xeon E3-1230 v3
Intel Core i5-2500K
Intel Core i5-4570
Intel Core i7-2700K
Intel Core i5-3550
Intel Core i3-4150
Intel Core i7-2600K
Intel Xeon E3-1230 V2
Intel Core i7-4720HQ
Intel Core i7-3960X
Intel Core i3-4130
Intel Core i5-3470
Intel Core i7-3820
Intel Core i5-7200U
Intel Pentium G3260
Intel Core i5-2550K
Intel Core i7-6700HQ
Intel Core i7-4710HQ
Intel Core i5-4460
Intel Core i7-4710MQ
Intel Core i5-4210H
Intel Core i5-3450
Intel Core i7-3930K
Intel Core i7-3520M
Intel Core i5-4200H
Intel Core i7-4700MQ
Intel Core i7-4700HQ
Intel Core i3-3240
Intel Core i5-4440
Intel Core i7-6500U
Intel Core i7 X 990
Intel Core i5-4430
Intel Core i3-3220
Intel Core i5-6300HQ
Intel Core i5-6300U
Intel Core i7-3630QM
Intel Core i5-3350P
AMD FX -9590
Intel Core i7-2600
Intel Core i5-4210M
Intel Pentium G3220
Intel Core i7-4702MQ
Intel Core i7-5500U
Intel Core i7-3610QM
Intel Core i7 X 980
Intel Core i5-3330
Intel Core i5-3320M
Intel Core i5-2500
Intel Xeon W3690
AMD FX -9370
Intel Pentium G2030
Intel Core i7-4510U
Intel Core i5-6200U
Intel Core i7-3632QM
Intel Core i5-3230M
Intel Core i5-4200M
AMD FX-8370
Intel Pentium G2020
Intel Core i7-3612QM
AMD FX -4350
Intel Core i5-2400
Intel Core i5-3210M
AMD FX -8350
AMD A10-6800K
AMD A10-7890K
Intel Xeon X5675
Intel Xeon X5470
Intel Xeon E5-2683 v3
AMD Athlon X4 880K
AMD FX-8370E
Intel Core i3-2120
Intel Xeon X5670
Intel Core i7-2620M
AMD FX -6350
Intel Core i5-4300U
Intel Core i7 870
Intel Core i5-2320
Intel Core i7 960
Intel Core i5-5200U
AMD Athlon X4 845
AMD A8-6600K
AMD A10-5800K
Intel Core i5-2540M
Intel Xeon E5-2670
AMD A6-6400K
AMD FX -8320
Intel Core i5 760
AMD Athlon X4 870K
AMD A10-7870K
Intel Core i5-2310
AMD Athlon X4 760K
Intel Core i7 950
AMD FX -8300
AMD FX -4300
AMD FX -6300
AMD Athlon X4 860K
AMD FX-8320E
Intel Core i3-2100
AMD A10-7850K
Intel Core i5 650
Intel Core 2 Duo E8600
Intel Xeon X5460
Intel Core i5-2520M
Intel Core i5-2300
Intel Core i7 860
Intel Core i3-6100U
AMD Athlon X4 750K
AMD A10-7860K
AMD A6-5400K
AMD A8-5600K
Intel Core i5 750
Intel Core i3 550
Intel Core i7-2670QM
Intel Core 2 Duo E8500
Intel Xeon E5450
AMD A10-7700K
AMD A10-7800
Intel Core i5-3337U
Intel Core i7 930
Intel Core i5-2430M
Intel Core i3 540
Intel Core 2 Quad Q9650
Intel Core i5 M 560
Intel Xeon X5650
AMD A8-7600
Intel Xeon X5450
Intel Core i5-2450M
Intel Xeon X3440
AMD A8-7650K
Pentium E5700
Intel Core 2 Duo E8400
Intel Core i5-2410M
Intel Core 2 Quad Q9550
AMD Athlon X4 740
Intel Core 2 Duo E6850
Intel Core i7-2630QM
Intel Xeon E5440
Intel Core i3-3110M
Intel Core 2 Duo E7500
Intel Core i7 920
Pentium E6500
Intel Core i3 530
Intel Core i5 M 480
Intel Pentium G620
Intel Core 2 Duo E7400
Pentium E5500
Intel Core 2 Quad Q9450
Intel Core i5 M 460
Intel Core i5 M 520
Intel Core 2 Quad Q9400
Intel Core i3-5005U
Intel Core 2 Duo E7300
Pentium E5400
Intel Core 2 Quad Q8400
Pentium E5300
Intel Core 2 Duo E6750
Intel Core 2 Quad Q9300
AMD FX -8150
Pentium E5200
Intel Xeon L5420
Intel Core 2 Quad Q8300
Intel Core i3 M 380
Intel Core i3-2350M
Intel Core i5 M 430
Intel Core i7 Q 720
AMD FX -8120
Intel Core i3 M 370
Intel Core i3-4030U
Intel Core 2 Quad Q6600
Intel Core i3-2330M
Intel Core 2 Quad
AMD FX -6100
AMD FX -4100
Intel Core 2 Quad Q8200
Intel Core 2 Duo E6550
Intel Core i3-2310M
AMD A10-8700P
Intel Core i3 M 350
Intel Core i3-3217U
Intel Core i3-4005U
AMD Phenom II X6 1100T
AMD Phenom II X6 1090T
Intel Core 2 Duo E4500
Intel Core i3 M 330
AMD Phenom II X6 1055T
AMD Phenom II X4 965
AMD A8-7410
AMD Phenom II X4 B55
AMD Phenom II X4 955
AMD A8-6410
AMD A8-4500M
AMD Phenom II X4 840
AMD Phenom II X4 B50
AMD A6-6310
AMD Phenom II X4 945
AMD Athlon II X2 250
AMD Athlon II X4 640
(YOU) Intel Core 2 T5600
AMD Athlon II X2 245
AMD Phenom II X4 925
AMD Athlon II X4 630
AMD Athlon II X2 240
AMD Athlon II X4 620
AMD Athlon 64 X2 6000+
AMD Athlon 64 X2 5200+
AMD Athlon 64 X2 5000+
Intel Pentium N3540
Intel Celeron N2840
Intel Celeron N3050
Intel Atom x5-Z8300
Test System And Benchmarks — Dell Precision T5600: Two Eight-Core CPUs In A Workstation
Skip to main content
Tom’s Hardware is supported by its audience. When you purchase through links on our site, we may earn an affiliate commission. Here’s why you can trust us.
iBuyPower provides our reference workstation hardware, and we continue using the company’s P500X as the baseline point of comparison in our workstation coverage. Check out our review of that system in iBuyPower P500X And P900DX Workstations, Reviewed.
| Test System Specifications | ||
|---|---|---|
| iBuyPower P500X | Dell T5600 | |
| CPU | Intel Xeon E3-1270 v2 (Ivy Bridge), 3.5 GHz, Quad-Core, LGA 1155, 8 MB Shared L3, Hyper-Threading enabled, Power-savings enabled | 2 x Intel Xeon E5-2687W (Sandy Bridge-EP), 3.1 GHz, Octa-Core, LGA 2011, 20 MB Shared L3, Hyper-Threading enabled, Power-savings enabled |
| Cooler | Asetek 550LC | 2 x Dell Heat Sink and Fan Combo |
| Motherboard | Asus P8B WS, Intel C206 PCH, BIOS 2009 | Dell 0Y56T3, Intel C602 PCH, BIOS A08 |
| RAM | 2 x Kingston KVR1333D3E9S/4G, ECC DDR3-1333 CAS9 | 8 x Hynix HMT325R7CFR8C, ECC DDR3-1333 CAS9 |
| Graphics | PNY Quadro 2000 1 GB625 MHz GPU, 1300 MHz Memory128-bit GDDR5, 42 GB/s Memory Bandwidth292 CUDA cores | PNY Quadro K5000 4 GB706 MHz GPU, 1350 MHz Memory256-bit GDDR5, 173 GB/s Memory Bandwidth2536 CUDA cores |
| RAID Controller | N/A | Dell PowerEdge RAID Controller h410, SAS/SATA RAID, PCIe 2. 0 x8 0 x8 |
| SSD | Kingston Hyper-X Sh200S3B/120G, 120 GB MLC SSD | 2 x Samsung PM830 MZ-7PC256D, 256 GB MLC SSD |
| Hard Drive | HGST HDS732020BLA642 2 TB, 7K3000, 7200 RPM | N/A |
| Optical | Lite-On iHAS124-04(C) 24x Dual-Layer DVD±RW Writer | Samsung/Toshiba SN-208 Slimline 8x DVD+/-RW SATA |
| Sound | Echo Digital Audio AudioFire 2 (not included in price) | Echo Digital Audio AudioFire 2 (not included in price)Creative Labs Sound Blaster Recon3D PCIe (not used in testing) |
| Networking | Integrated Intel 82574L | Integrated Intel 82579 |
| FireWire | Integrated VIA 6308S | LSI L-FW323-07 Three-Port PCI FireWire Card |
| Power Supply | Corsair TX650 V2, 80 PLUS Bronze, 650 W | Dell H825EF-00, 825 W |
| Case | Cooler Master Silencio 550 | Dell T5600 Case |
| Software | ||
| Operating System | Windows 7 Professional x64 | Windows 7 Professional x64 |
| Graphics Driver | Quadro Driver 320. 49 49 |
Quadro Driver 320.49 |
| Audio Driver | 5.8 | 5.8 |
| ASIO Driver | Included in audio driver | Included in audio driver |
| Warranty and Price | ||
| Warranty | Three-year labor, one-year parts | Three-year basic hardware service with three-year NBD on-site service after remote diagnostic |
| Price As Configured | $1999 | $8012 |
Since our last workstation review, Adobe shipped its Creative Cloud suite, while Autodesk released the 2014 versions of their apps. So, the workstation tests are updated to reflect those changes.
| Application Benchmarks and Settings | |
|---|---|
| Compression/Archiving | |
| 7-Zip | Version 9.28: THG-Workload (1.3 GB) to .7z, command line switches «a -t7z -r -m0=LZMA2 -mx=5» |
| WinRAR | Version 4. 2: THG-Workload (1.3 GB) to RAR, command line switches «winrar a -r -m3» 2: THG-Workload (1.3 GB) to RAR, command line switches «winrar a -r -m3» |
| WinZip | Version 17.0 Pro: THG-Workload (1.3 GB) to ZIP, command line switches «-a -ez -p -r» |
| Content Creation | |
| Newtek Lightwave 3D 11.5 | Custom workload: High-polygon-count Tom’s Hardware logo, Modeler test: Scripted cloning of surface details across a segment of the logo, Render test: 1920×1080 render of logo with photoreal motion blur, ray-traced shadows, global illumination, OpenGL Test: Generate OpenGL preview of animation for real-time playback on screen |
| Blender | Version: 2.68a Syntax blender -b thg.blend -f 1, Resolution: 1920×1080, Anti-Aliasing: 8x, Render: THG.blend frame 1, Cycles renderer and internal tile renderer (9×9) |
| e-on SoftwareVue 11 Infinite PLE | Custom workload: Landscape (generated in Vue 8 full version and imported into PLE) |
| Autodesk 3ds Max 2014 | Space Flyby Mentalray, Frame 248, 1440×1080 Tom’s Hardware Logo render in V-Ray, 1920×1080, global illumination, photorealistic motion blur, ray-traced shadows, Create Nitrous preview of logo scene, to Y: RAM drive, Autodesk chair scene in iray, 1920×1080, 250 passes, GPU (CUDA) only rendering, Car render in V-Ray RT, 1920×1080, 256 passes, CUDA-only |
| Autodesk Maya 2014 | Tom’s Hardware Logo render in mental ray, 1920×1080, global illumination, photo-realistic motion blur, ray-traced shadows, OpenGL Test: Generate Playblast (OpenGL preview) animation to Y: RAM drive |
Maxon Cinebench r11. 5 5 |
3D Rendering and OpenGL Benchmarks, built-in benchmarks with default settings |
| Adobe Premiere Pro CC | Custom Workload: Edit of 59.94 fps 720p DVCProHD footage, with transitions and some color correction, Render To H.264 720p |
| Adobe Photoshop CC | Filter 15.7 MB TIF Image: Radial Blur, Shape Blur, Median, Polar Coordinates filters |
| Adobe After Effects CC | Custom Workload: SD motion graphics sequence with three picture-in-picture frames sourced from 720p HD QuickTime, Same scene rendered using a frame sequence instead of from QuickTime sources, HD redo of the project using frame sequences, to 1080p |
| Adobe Acrobat XI | Version 11: Print PDF from 115 Page PowerPoint, 128-bit RC4 Encryption |
| Reaper v.4.402 | DAWBench Universal 2012: Test number of simultaneous copies of ReaXComp that the system can effectively run, Custom Workload: Render and mix down to . wav custom score project, multiple tracks of audio, VST synthesizers and effects wav custom score project, multiple tracks of audio, VST synthesizers and effects |
| Visual Studio 2010 | Compile Chrome project (1/31/2012) with devenv.com /build Release |
| Encoding Benchmarks and Settings | |
| HandBrake CLI | Version: 0.9.9Video: Big Buck Bunny (720×480, 23.972 frames) 5 Minutes, Audio: Dolby Digital, 48,000 Hz, Six-Channel, English, to Video: AVC Audio: AC3 Audio2: AAC (High Profile) |
| TotalCode Studio 2.5 | Version: 2.5.0.10677: MPEG-2 to H.264, MainConcept H.264/AVC Codec, 28 sec HDTV 1920×1080 (MPEG-2), Audio: MPEG-2 (44.1 kHz, 2 Channel, 16-Bit, 224 Kb/s), Codec: H.264 Pro, Mode: PAL 50i (25 FPS), Profile: H.264 BD HDMV |
| LAME MP3 | Version 3.98.3: Audio CD «Terminator II SE», 53 min, convert WAV to MP3 audio format, Command: -b 160 —nores (160 Kb/s) |
| Synthetic Benchmarks and Settings | |
| SPECviewperf 11 | Default GUI options; Workloads: CATIA, EnSight, LightWave, Maya, Pro/E, SolidWorks, Teamcenter Visualization Mockup, Siemens NX |
LuxMark 2. 0 0 |
OpenCL-based rendering benchmark, default settings |
| CASE Euler3D | CFD simulation over NACA 445.6 aeroelastic test wing at Mach 0.5 |
| Thesycon DPCLat | DPC Latency Checker, run with default settings |
| SiSoftware Sandra | CPU Test=CPU Arithmetic/Multimedia, Memory Test=Bandwidth Benchmark, Cryptography |
| Iometer 1.1.0 | Workers = 1, 16 GB repeating data, 4 KB random, 128 KB sequential |
| AS SSD 1.7.4739 | Sequential, 4 KB Random, and 4K-64 THRD tests |
Current page:
Test System And Benchmarks
Prev Page Inside And Outside Of Dell’s Precision T5600 Workstation
Next Page Results: Adobe Creative Cloud
Tom’s Hardware is part of Future US Inc, an international media group and leading digital publisher. Visit our corporate site .
©
Future US, Inc. Full 7th Floor, 130 West 42nd Street,
New York,
NY 10036.
Historical Performance Benchmarks
Introduction
The specific benchmark used was a molecular dynamics simulation which involved
simulating a calcium aluminosilicate glass consisting of 6500 atoms at room
temperature under atmospheric pressure for 25,000 timesteps, or 25ps. The
radial cutoff distance was 5.5 Å. All of the data was able to fit into the
physical RAM of each system, resulting in no swapping. However, the simulation
code used tabulates the potentials and forces rather than recalculating them
at each time step, making the performance depend heavily on memory performance
(latency and bandwidth) and the cache hierarchy in addition to floating point
arithmetic.
All binaries were compiled with optimizations for the platform on which the
benchmark was being run, including any special SIMD instruction sets that the
compiler could generate on its own. There are differences in the optimizations
performed by the compilers, but I’ve tried to use each compiler’s most
sensible set of optimization options.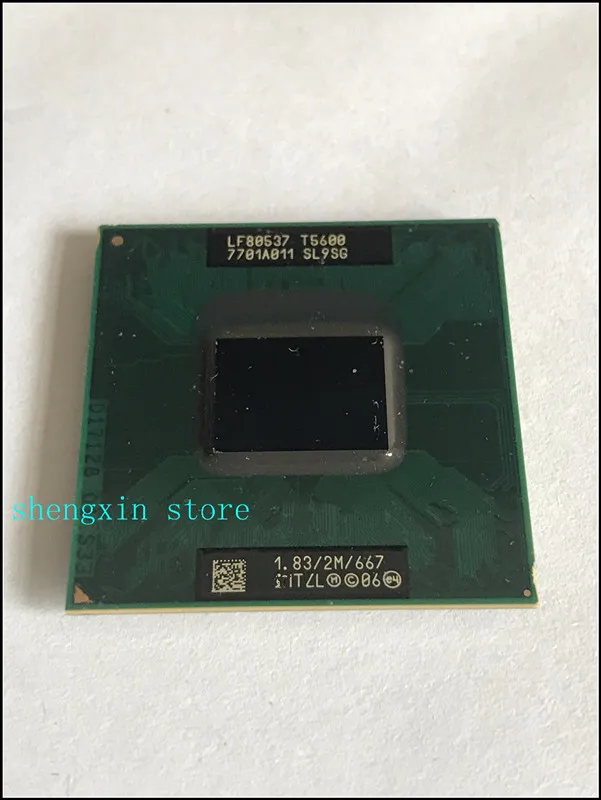 To see the exact options I used for
each benchmark, in addition to a plethora of other metadata, you can view the
raw data used to generate this page in my website’s git repository.
Here is a graphical respresentation of the performance data:
Some measurements below also have an «Optimized Time» column. This measurement
was made on a version of the application that periodically sorts the atomic
positions in memory to increase cache hit rate. Because this optimization was
not available at the time I started doing these benchmarks, many of the older
systems do not have it.
SPARC Processors
| System | Processor | Clock | Time (sec) |
|---|---|---|---|
| Sun Ultra 10 | UltraSPARC IIi | 1 × 360 MHz | 5829 |
| Sun Enterprise 4500 | UltraSPARC II | 1 × 400 MHz | 5639 |
| Sun Netra T1 | UltraSPARC IIi | 1 × 440 MHz | 5686 |
| Sun Ultra 60 | UltraSPARC II | 1 × 360 MHz | 5561 |
| Sun Ultra 60 | UltraSPARC II | 1 × 450 MHz | 4974 |
| Sun Blade 100 | UltraSPARC IIe | 1 × 500 MHz | 8634 |
| Sun Fire v100 | UltraSPARC IIi | 1 × 548 MHz | 5640 |
| Sun Blade 150 | UltraSPARC IIi | 1 × 550 MHz | 5249 |
| Sun Blade 150 | UltraSPARC IIi | 1 × 650 MHz | 5023 |
| Sun Blade 1000 | UltraSPARC III | 1 × 750 MHz | 2520 |
| Sun Blade 1000 | UltraSPARC III Cu | 1 × 900 MHz | 2030 |
| Sun Fire v210 | UltraSPARC IIIi | 1 × 1. 0 GHz 0 GHz |
2053 |
| Sun Blade 1500 (Red) | UltraSPARC IIIi | 1 × 1.1 GHz | 1862 |
| Sun Fire v240 | UltraSPARC IIIi | 1 × 1.5 GHz | 1558 |
| Sun Blade 1500 (Silver) | UltraSPARC IIIi | 1 × 1.5 GHz | 1501 |
| Sun Blade 2500 (Silver) | UltraSPARC IIIi | 1 × 1.6 GHz | 1428 |
MIPS Processors
| System | Processor | Clock | Time (sec) |
|---|---|---|---|
| SGI O2 | MIPS R5000 | 1 × 180 MHz | 25299 |
| SGI O2 | MIPS R10000 | 1 × 195 MHz | 14064 |
| SGI Indigo2 | MIPS R10000 | 1 × 195 MHz | 8438 |
| SGI Octane | MIPS R10000 | 1 × 225 MHz | 5744 |
| SGI Fuel | MIPS R14000 | 1 × 500 MHz | 2507 |
| SGI Fuel | MIPS R14000 | 1 × 600 MHz | 1787 |
POWER/PowerPC Processors
| System | Processor | Clock | Time (sec) |
|---|---|---|---|
| IBM RS/6000 43p 150 | PowerPC 604e | 1 × 375 MHz | 10889 |
| Apple Power Mac G4 | PowerPC 7450 | 1 × 733 MHz | 7291 |
| Apple Power Mac G4 | PowerPC 7450 | 1 × 933 MHz | 4533 |
| Apple Power Mac G5 | PowerPC 970 | 1 × 1. 6 GHz 6 GHz |
2317 |
| IBM Blue Gene/P | PowerPC 450 | 1 × 850 MHz | 3030 |
| IBM Blue Gene/P | PowerPC 450 | 4 × 850 MHz | 1720 |
| IBM Power 550 Express | POWER6 | 1 × 4.2 GHz | 646 |
| IBM Power 550 Express | POWER6 | 4 × 4.2 GHz | 414 |
PA-RISC Processors
| System | Processor | Clock | Time (sec) |
|---|---|---|---|
| HP C8000 | PA-8800 | 1 × 1.0 GHz | 801 |
Itanium Processors
| System | Processor | Clock | Time (sec) | Optimized Time (sec) |
|---|---|---|---|---|
| HP rx2600 | Itanium 2 900 | 1 × 900 MHz | 1294 | 1212 |
| HP rx2600 | Itanium 2 900 | 2 × 900 MHz | 1094 | 986 |
ARM Processors
| System | Processor | Clock | Time (sec) | Optimized Time (sec) |
|---|---|---|---|---|
| Raspberry Pi Model B | ARM1176JZF-S | 1 × 700 MHz | 16459 | 10000 |
| BeagleBone Black Rev C | ARM Cortex-A8 | 1 × 1. 0 GHz 0 GHz |
9781 | 8213 |
| Terasic DE10-Nano | ARM Cortex-A9 | 1 × 800 MHz | 3639 | 2501 |
| Terasic DE10-Nano | ARM Cortex-A9 | 2 × 800 MHz | 3203 | 2011 |
| BeagleBone AI | ARM Cortex-A15 | 1 × 1.5 GHz | 1220 | 1004 |
| BeagleBone AI | ARM Cortex-A15 | 2 × 1.5 GHz | 1146 | 946 |
| Raspberry Pi 3 | ARM Cortex-A53 | 1 × 1.2 GHz | 2531 | 1463 |
| Raspberry Pi 3 | ARM Cortex-A53 | 2 × 1.2 GHz | 2427 | 1489 |
| Raspberry Pi 3 | ARM Cortex-A53 | 4 × 1.2 GHz | 2508 | 1939 |
| Raspberry Pi 4 | ARM Cortex-A72 | 1 × 1. 5 GHz 5 GHz |
879 | 732 |
| Raspberry Pi 4 | ARM Cortex-A72 | 2 × 1.5 GHz | 815 | 592 |
| Raspberry Pi 4 | ARM Cortex-A72 | 3 × 1.5 GHz | 939 | 589 |
| Raspberry Pi 4 | ARM Cortex-A72 | 4 × 1.5 GHz | 1146 | 639 |
| NVIDIA Jetson Nano | ARM Cortex-A57 | 1 × 1.4 GHz | 876 | 778 |
| NVIDIA Jetson Nano | ARM Cortex-A57 | 2 × 1.4 GHz | 738 | 592 |
| NVIDIA Jetson Nano | ARM Cortex-A57 | 3 × 1.4 GHz | 707 | 541 |
| NVIDIA Jetson Nano | ARM Cortex-A57 | 4 × 1.4 GHz | 667 | 528 |
| MacBook Air M1 | Apple M1/Rosetta | 1 × 3. 2 GHz 2 GHz |
118 | 108 |
| MacBook Air M1 | Apple M1/Rosetta | 2 × 3.2 GHz | 93 | 83 |
| MacBook Air M1 | Apple M1/Rosetta | 3 × 3.2 GHz | 84 | 77 |
| MacBook Air M1 | Apple M1/Rosetta | 4 × 3.2 GHz | 78 | 73 |
| MacBook Air M1 | Apple M1/Rosetta | 8 × 3.2 GHz | 80 | 78 |
| MacBook Air M1 | Apple M1 | 1 × 3.2 GHz | 94 | 86 |
| MacBook Air M1 | Apple M1 | 2 × 3.2 GHz | 73 | 67 |
| MacBook Air M1 | Apple M1 | 3 × 3.2 GHz | 66 | 61 |
| MacBook Air M1 | Apple M1 | 4 × 3. 2 GHz 2 GHz |
61 | 59 |
| MacBook Air M1 | Apple M1 | 8 × 3.2 GHz | 65 | 65 |
| MacBook Pro M1 Pro | Apple M1 Pro | 1 × 3.2 GHz | 93 | 106 |
| MacBook Pro M1 Pro | Apple M1 Pro | 2 × 3.2 GHz | 72 | 65 |
| MacBook Pro M1 Pro | Apple M1 Pro | 4 × 3.2 GHz | 60 | 60 |
| MacBook Pro M1 Pro | Apple M1 Pro | 6 × 3.2 GHz | 60 | 61 |
| MacBook Pro M1 Pro | Apple M1 Pro | 8 × 3.2 GHz | 63 | 64 |
| D64pls_v5 | Ampere Altra Q80-30 | 1 × 3.0 GHz | 212 | 195 |
| D64pls_v5 | Ampere Altra Q80-30 | 2 × 3. 0 GHz 0 GHz |
163 | 148 |
| D64pls_v5 | Ampere Altra Q80-30 | 3 × 3.0 GHz | 144 | 136 |
| D64pls_v5 | Ampere Altra Q80-30 | 4 × 3.0 GHz | 136 | 134 |
| D64pls_v5 | Ampere Altra Q80-30 | 8 × 3.0 GHz | 144 | 145 |
| D64pls_v5 | Ampere Altra Q80-30 | 16 × 3.0 GHz | 196 | 197 |
| D64pls_v5 | Ampere Altra Q80-30 | 32 × 3.0 GHz | 313 | 310 |
| D64pls_v5 | Ampere Altra Q80-30 | 64 × 3.0 GHz | 548 | 557 |
x86 Processors
| System | Processor | Clock | Time (sec) | Optimized Time (sec) |
|---|---|---|---|---|
| Dell Inspiron 8100 | Pentium III M | 1 × 1.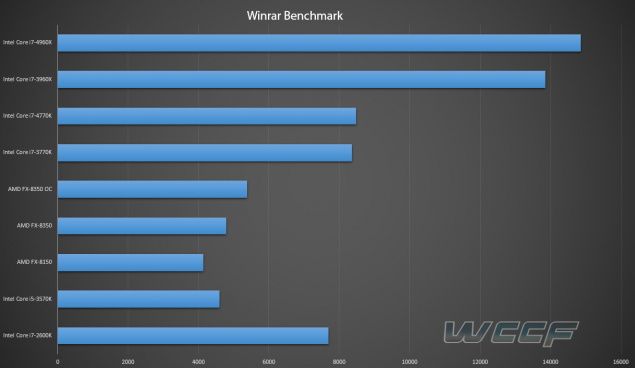 1 GHz 1 GHz |
3680 | |
| Tyan MPX S2466 | Athlon MP 1900+ | 1 × 1.6 GHz | 3660 | |
| Dell OptiPlex GX260 | Pentium 4 (Northwood) | 1 × 1.8 GHz | 2170 | |
| Dell OptiPlex GX260 | Pentium 4 (Northwood) | 1 × 2.4 GHz | 1661 | |
| Gateway E-4650 | Pentium 4 (Northwood) | 1 × 2.2 GHz | 1743 | |
| Dell PowerEdge 2850 | Xeon 2.8 (Nocona) | 1 × 2.8 GHz | 974 | |
| — | Pentium D | 1 × 3.2 GHz | 929 | |
| Asus Z70va | Pentium M 760 | 1 × 2.0 GHz | 731 | |
| Sun Fire X4100 | Opteron 275 | 1 × 2.2 GHz | 806 | |
| Sun Fire X2200 M2 | Opteron 2214 | 1 × 2.2 GHz | 873 | |
| Sun Fire X2200 M2 | Opteron 2376 | 1 × 2. 3 GHz 3 GHz |
592 | |
| Supermicro | Opteron 2216 | 1 × 2.4 GHz | 713 | |
| Supermicro X8DTT | Xeon X5560 | 1 × 2.8 GHz | 304 | |
| Dell | Core 2 Duo E6700 | 1 × 2.7 GHz | 439 | |
| Dell OptiPlex 760 | Core 2 Duo E7500 | 1 × 2.9 GHz | 346 | |
| Dell OptiPlex 990 | Core i7-2600 | 1 × 3.4 GHz | 201 | |
| HP dc7800p | Core 2 Duo E8400 | 1 × 3.0 GHz | 318 | |
| HP e9180f | Core i7 920 | 1 × 2.7 GHz | 334 | |
| HP ProLiant SL390s G7 | Xeon X5672 | 1 × 3.2 GHz | 310 | |
| HP ProLiant DL360 G7 | Xeon X5672 | 1 × 3.2 GHz | 308 | |
| — | Xeon X5650 | 1 × 2. 7 GHz 7 GHz |
316 | |
| — | Xeon X5680 | 1 × 3.3 GHz | 313 | |
| — | Xeon W5590 | 1 × 3.3 GHz | 273 | |
| Supermicro H8DGT | Opteron 6212 | 1 × 2.6 GHz | 353 | |
| — | Opteron 6176 | 1 × 2.3 GHz | 575 | |
| Supermicro SC818TQ-1400LPB | Opteron 6136 | 1 × 2.2 GHz | 565 | 483 |
| Supermicro SC818TQ-1400LPB | Opteron 6136 | 2 × 2.2 GHz | 477 | 419 |
| Supermicro SC818TQ-1400LPB | Opteron 6136 | 4 × 2.2 GHz | 412 | 407 |
| Supermicro SC818TQ-1400LPB | Opteron 6136 | 8 × 2.2 GHz | 476 | 470 |
| Appro gB222X | Xeon E5530 | 1 × 2. 4 GHz 4 GHz |
416 | |
| Appro gB222X | Xeon E5530 | 2 × 2.4 GHz | 306 | |
| Appro gB222X | Xeon E5530 | 4 × 2.4 GHz | 265 | |
| Appro gB222X | Xeon E5530 | 8 × 2.4 GHz | 256 | |
| HP ProLiant SL230s G8 | Xeon E5-2660 | 1 × 3.0 GHz | 270 | |
| HP ProLiant SL230s G8 | Xeon E5-2660 | 2 × 3.0 GHz | 208 | |
| HP ProLiant SL230s G8 | Xeon E5-2660 | 4 × 3.0 GHz | 171 | |
| HP ProLiant SL230s G8 | Xeon E5-2660 | 8 × 3.0 GHz | 171 | |
| HP ProLiant SL230s G8 | Xeon E5-2660 | 16 × 3.0 GHz | 164 | |
| Appro gB512X | Xeon E5-2670 | 1 × 2.6 GHz | 292 | 237 |
| Appro gB512X | Xeon E5-2670 | 4 × 2. 6 GHz 6 GHz |
175 | 155 |
| Appro gB512X | Xeon E5-2670 | 8 × 2.6 GHz | 164 | 141 |
| Dell T5600 | Xeon E5-2687W | 1 × 3.1 GHz | 205 | |
| Dell T5600 | Xeon E5-2687W | 2 × 3.1 GHz | 165 | |
| Dell T5600 | Xeon E5-2687W | 4 × 3.1 GHz | 133 | |
| Dell T5600 | Xeon E5-2687W | 8 × 3.1 GHz | 128 | |
| Dell PowerEdge C8220X | Xeon Phi SE10P | 8 × 1.1 GHz | 1802 | 1209 |
| Dell PowerEdge C8220X | Xeon Phi SE10P | 16 × 1.1 GHz | 1589 | |
| Dell PowerEdge C8220X | Xeon Phi SE10P | 32 × 1.1 GHz | 1479 | 1106 |
| Cray XC30 | Xeon E5-2695 v2 | 1 × 2.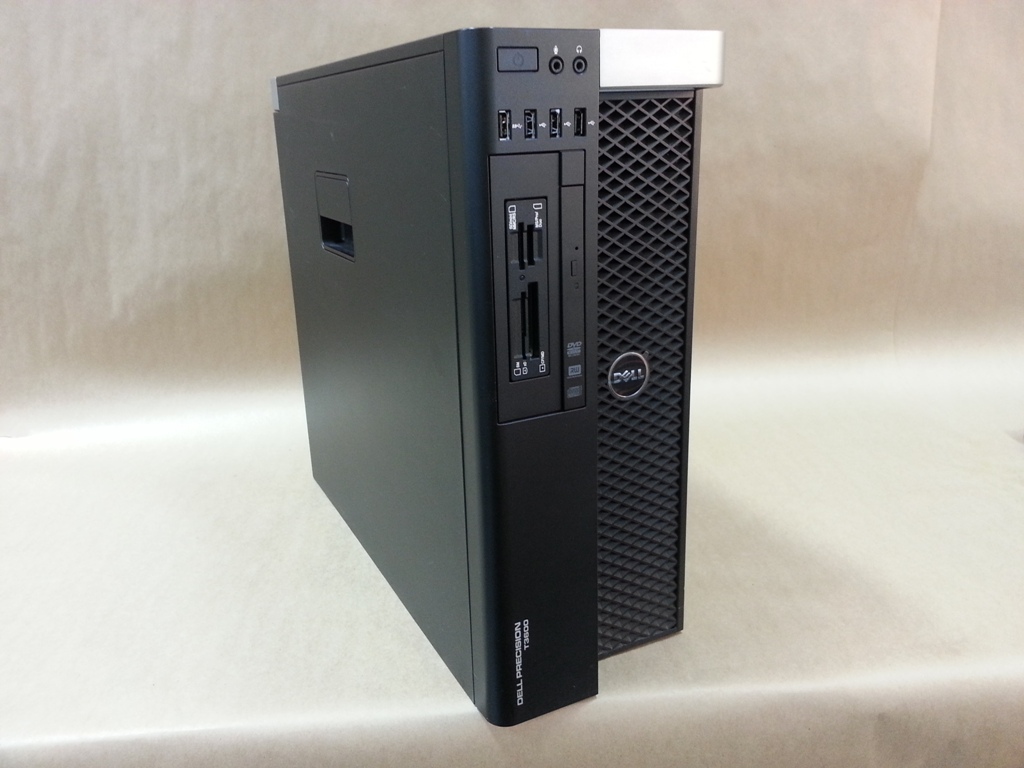 4 GHz 4 GHz |
279 | 225 |
| Cray XC30 | Xeon E5-2695 v2 | 2 × 2.4 GHz | 216 | 173 |
| Cray XC30 | Xeon E5-2695 v2 | 4 × 2.4 GHz | 180 | 163 |
| Cray XC30 | Xeon E5-2695 v2 | 6 × 2.4 GHz | 176 | 154 |
| Cray XC30 | Xeon E5-2695 v2 | 12 × 2.4 GHz | 163 | 149 |
| Cray XC30 | Xeon E5-2695 v2 | 24 × 2.4 GHz | 166 | 153 |
| Cray XC40 | Xeon E5-2698 v3 | 1 × 2.3 GHz | 232 | 178 |
| Cray XC40 | Xeon E5-2698 v3 | 2 × 2.3 GHz | 176 | 137 |
| Cray XC40 | Xeon E5-2698 v3 | 4 × 2.3 GHz | 150 | 130 |
| Cray XC40 | Xeon E5-2698 v3 | 8 × 2. 3 GHz 3 GHz |
150 | 132 |
| Cray XC40 | Xeon E5-2698 v3 | 16 × 2.3 GHz | 149 | 136 |
| Cray XC40 | Xeon E5-2698 v3 | 32 × 2.3 GHz | 152 | 143 |
| — | Xeon E5-2643 v4 | 1 × 3.4 GHz | 202 | 160 |
| — | Xeon E5-2643 v4 | 2 × 3.4 GHz | 154 | 122 |
| — | Xeon E5-2643 v4 | 3 × 3.4 GHz | 132 | 110 |
| — | Xeon E5-2643 v4 | 6 × 3.4 GHz | 116 | 102 |
| Cray XC40 | Xeon Phi 7250 | 4 × 1.4 GHz | 1259 | 839 |
| Cray XC40 | Xeon Phi 7250 | 4 × 1.4 GHz | 1009 | 774 |
| Cray XC40 | Xeon Phi 7250 | 4 × 1. 4 GHz 4 GHz |
858 | 687 |
| Cray XC40 | Xeon Phi 7250 | 4 × 1.4 GHz | 763 | 667 |
| Cray XC40 | Xeon Phi 7250 | 4 × 1.4 GHz | 725 | 667 |
| Cray XC40 | Xeon Phi 7250 | 4 × 1.4 GHz | 713 | 674 |
| Cray XC40 | Xeon Phi 7250 | 4 × 1.4 GHz | 744 | 712 |
| Apple iMac 18,3 | Core i5-7600K | 1 × 3.8 GHz | 189 | 143 |
| Apple iMac 18,3 | Core i5-7600K | 2 × 3.8 GHz | 125 | 107 |
| Apple iMac 18,3 | Core i5-7600K | 4 × 3.8 GHz | 115 | 97 |
| Apple MacBookPro 15,2 | Core i7-8559U | 1 × 2. 7 GHz 7 GHz |
147 | 118 |
| Apple MacBookPro 15,2 | Core i7-8559U | 2 × 2.7 GHz | 117 | 98 |
| Apple MacBookPro 15,2 | Core i7-8559U | 3 × 2.7 GHz | 106 | 87 |
| Apple MacBookPro 15,2 | Core i7-8559U | 4 × 2.7 GHz | 97 | 84 |
| — | AMD EPYC 7702 | 1 × 2.0 GHz | 160 | 146 |
| — | AMD EPYC 7702 | 2 × 2.0 GHz | 123 | 112 |
| — | AMD EPYC 7702 | 4 × 2.0 GHz | 101 | 98 |
| — | AMD EPYC 7702 | 8 × 2.0 GHz | 106 | 105 |
| — | AMD EPYC 7702 | 16 × 2.0 GHz | 122 | 119 |
| — | AMD EPYC 7702 | 32 × 2. 0 GHz 0 GHz |
163 | 163 |
| — | AMD EPYC 7702 | 64 × 2.0 GHz | 303 | 302 |
| Mac Mini 8,2 | Intel i7-8700B | 1 × 3.2 GHz | 169 | 100 |
| Mac Mini 8,2 | Intel i7-8700B | 2 × 3.2 GHz | 127 | 96 |
| Mac Mini 8,2 | Intel i7-8700B | 3 × 3.2 GHz | 113 | 96 |
| Mac Mini 8,2 | Intel i7-8700B | 4 × 3.2 GHz | 107 | 104 |
| Mac Mini 8,2 | Intel i7-8700B | 6 × 3.2 GHz | 109 | 137 |
| Cray EX235n | AMD EPYC 7763 | 1 × 2.5 GHz | 141 | 124 |
| Cray EX235n | AMD EPYC 7763 | 2 × 2.5 GHz | 145 | 121 |
| Cray EX235n | AMD EPYC 7763 | 3 × 2. 5 GHz 5 GHz |
116 | 104 |
| Cray EX235n | AMD EPYC 7763 | 4 × 2.5 GHz | 114 | 101 |
| Cray EX235n | AMD EPYC 7763 | 8 × 2.5 GHz | 105 | 98 |
| Cray EX235n | AMD EPYC 7763 | 16 × 2.5 GHz | 127 | 118 |
| Cray EX235n | AMD EPYC 7763 | 32 × 2.5 GHz | 180 | 160 |
| Cray EX235n | AMD EPYC 7763 | 64 × 2.5 GHz | 237 | 233 |
| Cray EX235n | AMD EPYC 7763 | 128 × 2.5 GHz | 472 | 425 |
| Lenovo P14s Gen2 | Intel i7-1185G7 | 1 × 3.0 GHz | 116 | 97 |
| Lenovo P14s Gen2 | Intel i7-1185G7 | 2 × 3. 0 GHz 0 GHz |
89 | 83 |
| Lenovo P14s Gen2 | Intel i7-1185G7 | 3 × 3.0 GHz | 86 | 81 |
| Lenovo P14s Gen2 | Intel i7-1185G7 | 4 × 3.0 GHz | 89 | 85 |
| Lenovo P14s Gen2 | Intel i7-1185G7 | 8 × 3.0 GHz | 172 | 127 |
| Intel NUC 12 Extreme | Intel i7-12700 | 1 × 2.1 GHz | 88 | 82 |
| Intel NUC 12 Extreme | Intel i7-12700 | 2 × 2.1 GHz | 72 | 66 |
| Intel NUC 12 Extreme | Intel i7-12700 | 4 × 2.1 GHz | 61 | 64 |
| Intel NUC 12 Extreme | Intel i7-12700 | 8 × 2.1 GHz | 69 | 68 |
| Intel NUC 12 Extreme | Intel i7-12700 | 10 × 2. 1 GHz 1 GHz |
74 | 75 |
| Intel NUC 12 Extreme | Intel i7-12700 | 20 × 2.1 GHz | 125 | 134 |
Core 2 Duo T5600 [in 5 benchmarks]
Intel
Core 2 Duo T5600
- Interface
- Core frequency
- Video memory size
- Memory type
- Memory frequency
- Maximum resolution
Description
Intel started Intel Core 2 Duo T5600 sales on July 28, 2006 at a suggested price of $241. This is a notebook processor based on the Merom architecture, primarily designed for office systems. It has 2 cores and 2 threads and is manufactured using 65 nm process technology, the maximum frequency is 1830 MHz, the multiplier is locked.
In terms of compatibility, this is a processor for socket PPGA478, PBGA479 with a TDP of 34W.
It provides poor benchmark performance at
0. 66%
66%
from the leader, which is AMD EPYC 7h22.
Core 2
Duo T5600
or
EPYC
7h22
General information
Information about the type (desktop or laptop) and architecture of the Core 2 Duo T5600, as well as when sales started and cost at the time.
| place in performance rating | 2581 | |
| 282) |
Features
Core 2 Duo T5600 quantitative parameters such as number of cores and threads, clock speeds, manufacturing process, cache size and multiplier lock state. They indirectly speak about the performance of the processor, but for an accurate assessment, you need to consider the results of the tests.
| Core | 2 | |||
| Thread | 2 0060 | |||
| Cache 2nd level | 2 MB | out of 12 (Core 2 QUAD Q9550) | ||
| levels | 0 KB | |||
| Technological process | 65 nm | of 5 (Apple M1) | ||
| Crystal size | 143 mm 2 9006
| Free multiplier |
— |
|
|
| Permissible nucleus voltage | 1. 0375V -1.3V 0375V -1.3V |
compliance
1 9000
Information on Core 2 Duo T5600 compatibility with other computer components. Useful, for example, when choosing the configuration of a future computer or to upgrade an existing one.
Please note that the power consumption of some processors can significantly exceed their nominal TDP even without overclocking. Some may even double their claims if the motherboard allows you to adjust the power settings of the processor.
| Enhanced SpeedStep (EIST) | + | ||||||||||||||||||||||||||||||||||||||||||||||||||||||||||||||||||||||||||||||||||||||||||||||||||||||||||||||||||||||||||||||||||||||||||||||||||||||||||||||||||||||||||||||||||||||||||||||||||||||||||||||||||||||||||||||||||||||||||||||||||||||||||||||||||||||||||||||||||||||||||||||||||||||||||||||||||||||||||||||||||||||||||||||||||||||||||||||||||||||||||||||||||||||||||||||||||||||||||||||||||||||||||||||||||||||||||||||||||||||
| Enhanced SpeedStep (EIST) | + | ||||||||||||||||||||||||||||||||||||||||||||||||||||||||||||||||||||||||||||||||||||||||||||||||||||||||||||||||||||||||||||||||||||||||||||||||||||||||||||||||||||||||||||||||||||||||||||||||||||||||||||||||||||||||||||||||||||||||||||||||||||||||||||||||||||||||||||||||||||||||||||||||||||||||||||||||||||||||||||||||||||||||||||||||||||||||||||||||||||||||||||||||||||||||||||||||||||||||||||||||||||||||||||||||||||||||||||||||||||||
| Turbo Boost Technology | — | ||||||||||||||||||||||||||||||||||||||||||||||||||||||||||||||||||||||||||||||||||||||||||||||||||||||||||||||||||||||||||||||||||||||||||||||||||||||||||||||||||||||||||||||||||||||||||||||||||||||||||||||||||||||||||||||||||||||||||||||||||||||||||||||||||||||||||||||||||||||||||||||||||||||||||||||||||||||||||||||||||||||||||||||||||||||||||||||||||||||||||||||||||||||||||||||||||||||||||||||||||||||||||||||||||||||||||||||||||||||
| Hyper-Threading Technology | — | ||||||||||||||||||||||||||||||||||||||||||||||||||||||||||||||||||||||||||||||||||||||||||||||||||||||||||||||||||||||||||||||||||||||||||||||||||||||||||||||||||||||||||||||||||||||||||||||||||||||||||||||||||||||||||||||||||||||||||||||||||||||||||||||||||||||||||||||||||||||||||||||||||||||||||||||||||||||||||||||||||||||||||||||||||||||||||||||||||||||||||||||||||||||||||||||||||||||||||||||||||||||||||||||||||||||||||||||||||||||
| 0060 | |||||||||||||||||||||||||||||||||||||||||||||||||||||||||||||||||||||||||||||||||||||||||||||||||||||||||||||||||||||||||||||||||||||||||||||||||||||||||||||||||||||||||||||||||||||||||||||||||||||||||||||||||||||||||||||||||||||||||||||||||||||||||||||||||||||||||||||||||||||||||||||||||||||||||||||||||||||||||||||||||||||||||||||||||||||||||||||||||||||||||||||||||||||||||||||||||||||||||||||||||||||||||||||||||||||||||||||||||||||||
| Demand Based Switching | — | ||||||||||||||||||||||||||||||||||||||||||||||||||||||||||||||||||||||||||||||||||||||||||||||||||||||||||||||||||||||||||||||||||||||||||||||||||||||||||||||||||||||||||||||||||||||||||||||||||||||||||||||||||||||||||||||||||||||||||||||||||||||||||||||||||||||||||||||||||||||||||||||||||||||||||||||||||||||||||||||||||||||||||||||||||||||||||||||||||||||||||||||||||||||||||||||||||||||||||||||||||||||||||||||||||||||||||||||||||||||
| Plains FSB | 9002 9009 | ||||||||||||||||||||||||||||||||||||||||||||||||||||||||||||||||||||||||||||||||||||||||||||||||||||||||||||||||||||||||||||||||||||||||||||||||||||||||||||||||||||||||||||||||||||||||||||||||||||||||||||||||||||||||||||||||||||||||||||||||||||||||||||||||||||||||||||||||||||||||||||||||||||||||||||||||||||||||||||||||||||||||||||||||||||||||||||||||||||||||||||||||||||||||||||||||||||||||||||||||||||||||||||||||||||||||||||||||||||||
| TXT | — | |
| EDB | + |
Virtualization Technologies
Technologies supported by Core 2 Duo T5600 that speed up virtual machines are listed.
Benchmark tests
These are the results of Core 2 Duo T5600 performance tests in non-gaming benchmarks. The overall score is set from 0 to 100, where 100 corresponds to the fastest processor at the moment.
Overall test performance
This is our overall performance rating. We regularly improve our algorithms, but if you find any inconsistencies, feel free to speak up in the comments section, we usually fix problems quickly.
Core 2 Duo T5600
0.66
- Passmark
- GeekBench 5 Single-Core
- GeekBench 5 Multi-Core
- 3DMark06 CPU
Passmark
Passmark CPU Mark is a widely used benchmark that consists of 8 different tests, including integer and floating point calculations, extended instruction tests, compression, encryption, and game physics calculations. Also includes a separate single-threaded test.
Benchmark coverage: 68%
Core 2 Duo T5600
662
GeekBench 5 Single-Core
GeekBench 5 Single-Core is a cross-platform application designed as CPU benchmarks that independently recreate certain real world tasks that can be used to accurately measure performance. This version uses only one processor core.
Benchmark coverage: 37%
Core 2 Duo T5600
224
GeekBench 5 Multi-Core
GeekBench 5 Multi-Core is a cross-platform application designed as CPU benchmarks that independently recreate certain real world tasks that can accurately measure performance. This version uses all available processor cores.
Benchmark coverage: 37%
Core 2 Duo T5600
409
3DMark06 CPU
3DMark06 is an outdated set of benchmarks based on DirectX 9 by Futuremark. Its processor part contains two tests, one of which calculates the pathfinding of game AI, the other emulates game physics using the PhysX package.
Benchmark coverage: 19%
Core 2 Duo T5600
1560
Relative capacity
Overall performance of the Core 2 Duo T5600 compared to its nearest competitor in notebook processors.
Intel Celeron N3060
100
AMD Turion X2 RM-75
100
Intel Celeron Dual-Core T3000
100
Intel Core 2 Duo T5600
100
Intel Celeron T3000
100
AMD Athlon II N330
100
Intel Celeron B800
98.48
AMD competitor
We believe that the nearest equivalent to Core 2 Duo T5600 from AMD is Athlon II N330, which is approximately equal in speed and is 3 positions higher in our rating.
Athlon II
N330
Compare
Here are some of AMD’s closest competitors to the Core 2 Duo T5600:
AMD E2-3000M
101. 52
52
AMD Turion X2 RM-75
100
AMD Athlon II N330
100
Intel Core 2 Duo T5600
100
AMD Athlon II M300
98.48
AMD A4-3320M
95.45
AMD Athlon 64 X2 TK-57
95.45
Other processors
Here we recommend several processors that are more or less similar in performance to the reviewed one.
Turion X2
RM-75
Compare
Celeron Dual
Core T3000
Compare
Core 2
Duo T5900
Compare
Celeron M
585
Compare
Pentium Dual
Core T3400
Compare
Core 2
Duo L7200
Compare
Recommended video cards
According to our statistics, these video cards are most often used with Core 2 Duo T5600:
GeForce Go
7400
10%
GeForce Go
7600
10%
GMA
950
10%
GeForce GT
220
5%
GeForce Go
7300
5%
GeForce GTX
260 Core 216 Rev. 2
2
2.5%
HD
Graphics
2.5%
Graphics Media
Accelerator (GMA) 3600
2.5%
Graphics Media
Accelerator (GMA) 950
2.5%
GeForce
945M
2.5%
User rating
Here you can see the evaluation of the processor by users, as well as put your own rating.
Tips and comments
Here you can ask a question about Core 2 Duo T5600, agree or disagree with our judgements, or report errors or inaccuracies on the site.
Please enable JavaScript to view the comments powered by Disqus.
Comparison of Intel Core 2 Duo T5670 and Intel Core 2 Duo T5600
Comparative analysis of Intel Core 2 Duo T5670 and Intel Core 2 Duo T5600 processors by all known characteristics in the categories: General information, Performance, Compatibility, Security and reliability, Technologies, Virtualization.
Analysis of processor performance by benchmarks: PassMark — Single thread mark, PassMark — CPU mark, Geekbench 4 — Single Core, Geekbench 4 — Multi-Core.
Intel Core 2 Duo T5670
versus
Intel Core 2 Duo T5600
Advantages
reasons to choose the Intel Core 2 Duo T5670
- Release processor, the difference in release 1 year (s)
- GEECBENCHBENCHBENCHBENS Single Core about 5% more: 1097 vs 1043
- Geekbench 4 — Multi-Core about 5% more performance: 1713 vs 1639
| Production date | 1 March 2008 vs 28 July 2006 |
| Geekbench 4 — Single Core | 1097 vs 1043 |
| Geekbench 4 — Multi-Core | 1713 vs 1639 |
Reasons to choose Intel Core 2 Duo T5600
- About 2% more clock speed: 1.
 83 GHz vs 1.8 GHz
 - About 3% less power consumption: 34 Watt vs 35 Watt
- About 8% more performance in PassMark — Single thread mark: 701 vs 650
- Performance in PassMark benchmark — CPU mark about 16% higher: 662 vs 573
| Maximum frequency | 1.83 GHz vs 1.8 GHz |
| Power consumption (TDP) | 34 Watt vs 35 Watt |
| PassMark — Single thread mark | 701 vs 650 |
| PassMark — CPU mark | 662 vs 573 |
Benchmark comparison
CPU 1: Intel Core 2 Duo T5670
CPU 2: Intel Core 2 Duo T5600
| PassMark — Single thread mark |
|
|||
| PassMark — CPU mark |
|
|||
| Geekbench 4 — Single Core |
|
|||
| Geekbench 4 — Multi-Core |
|
| Name | Intel Core 2 Duo T5670 | Intel Core 2 Duo T5600 |
|---|---|---|
| PassMark — Single thread mark | 650 | 701 |
| PassMark — CPU mark | 573 | 662 |
| Geekbench 4 — Single Core | 1097 | 1043 |
| Geekbench 4 — Multi-Core | 1713 | 1639 |
Performance comparison
| Intel Core 2 Duo T5670 | Intel Core 2 Duo T5600 | |
|---|---|---|
| Architecture name | Merom | Merom |
| Production date | March 1, 2008 | July 28, 2006 |
| Rank | 1879 | 1880 |
| Processor Number | T5670 | T5600 |
| Series | Legacy Intel® Core™ Processors | Legacy Intel® Core™ Processors |
| Status | Discontinued | Discontinued |
| Applicability | Mobile | Mobile |
| Price at first issue date | $241 | |
| Support 64 bit | ||
| Base frequency | 1. 80 GHz 80 GHz |
1.83 GHz |
| Bus Speed | 800 MHz FSB | 667 MHz FSB |
| Crystal area | 143 mm2 | 143 mm2 |
| System bus (FSB) | 800MHz | 667MHz |
| Level 2 cache | 2048KB | 2048 KB |
| Process | 65nm | 65nm |
| Maximum core temperature | 100°C | 100°C |
| Maximum frequency | 1. 8 GHz 8 GHz |
1.83 GHz |
| Number of cores | 2 | 2 |
| Number of threads | 2 | 2 |
| Number of transistors | 291 million | 291 million |
| Permissible core voltage | 1.0375V-1.30V | 1.0375V-1.300V |
| Level 1 cache | 64KB | |
| Low Halogen Options Available | ||
| Package Size | 35mm x 35mm | 35mm x 35mm |
| Power consumption (TDP) | 35 Watt | 34 Watt |
| Maximum number of processors per configuration | 1 | |
| Scenario Design Power (SDP) | 0 W | |
| Supported sockets | PPGA478, PBGA479 | |
| Execute Disable Bit (EDB) | ||
| Intel® Trusted Execution Technology (TXT) | ||
| Enhanced Intel SpeedStep® Technology | ||
| Parity FSB | ||
| Idle States | ||
| Intel 64 | ||
| Intel® Demand Based Switching | ||
| Intel® Hyper-Threading Technology | ||
| Intel® Turbo Boost Technology | ||
| Intel® Virtualization Technology (VT-x) |
90,000 characteristics Intel Core2 T5600 Merom, Price, Test, competitors
- Home
- >
- Processors
- Intel
- T5600
9000>
Processor Core2 T5600, price new on amazon and ebay — 99 USD
Quantity of cores — 2, manufactured according to 65 nm process technology, Merom architecture.
Core2 T5600 base frequency — 1.83 GHz. The maximum frequency in Intel Turbo Boost mode reaches 1.8 GHz. Please note that the Intel Core2 T5600 cooler must cool processors with a TDP of at least 34W at stock frequencies. When overclocked, the requirements increase.
Price in Russia
Do you want to buy Core2 T5600 cheaply? Look at the list of stores that already sell the processor in your city.
Family
- Core2 T5200
- Core2 T5300
- Core2 T5500
Benchmarks Intel Core2 T5600
The performance of 4 cores, if any, and performance per core has the greatest impact on the result, since most games do not fully use more than 4 cores.
The speed of caches and working with RAM is also important.
Speed in office use
Performance in everyday work such as browsers and office applications.
The performance of 1 core has the greatest impact on the result, since most of these applications use only one, ignoring the rest.
Similarly, many professional applications such as various CADs ignore multi-threaded performance.
Speed in heavy applications
Performance in resource-intensive tasks loading a maximum of 8 cores.
The performance of all cores and their number has the greatest impact on the result, since most of these applications willingly use all the cores and increase the speed accordingly.
At the same time, certain periods of work can be demanding on the performance of one or two cores, for example, applying filters in the editor.
Data obtained from tests by users who tested their systems with and without overclocking. Thus, you see the average values corresponding to the processor.
Speed of numerical operations
Simple household tasks |
|||||||||||||||||||||||||||||||||||||||||||||||||||||||||||||||||||||||||||||||||||||||||||||||||||||||||||||||||||||||||||||||||||||||||||||||||||||||||||||||||||||||||||||||||||||||||||||||||||||||||||||||||||||||||||||||||||||||||||||||||||||||||||||||||||||||||||||||||||||||||||||||||||||||||||||||||||||||||||||||||||||||||||||||||||||||||||||||||||||||||||||||||||||||||||||||||||||||||||||||||||||||||||||||||||||||||||||||||||||||
| Minimum | Average | Maximum | |||||||||||||||||||||||||||||||||||||||||||||||||||||||||||||||||||||||||||||||||||||||||||||||||||||||||||||||||||||||||||||||||||||||||||||||||||||||||||||||||||||||||||||||||||||||||||||||||||||||||||||||||||||||||||||||||||||||||||||||||||||||||||||||||||||||||||||||||||||||||||||||||||||||||||||||||||||||||||||||||||||||||||||||||||||||||||||||||||||||||||||||||||||||||||||||||||||||||||||||||||||||||||||||||||||||||||||||||||||
| 36 | Memory: 57 | ||||||||||||||||||||||||||||||||||||||||||||||||||||||||||||||||||||||||||||||||||||||||||||||||||||||||||||||||||||||||||||||||||||||||||||||||||||||||||||||||||||||||||||||||||||||||||||||||||||||||||||||||||||||||||||||||||||||||||||||||||||||||||||||||||||||||||||||||||||||||||||||||||||||||||||||||||||||||||||||||||||||||||||||||||||||||||||||||||||||||||||||||||||||||||||||||||||||||||||||||||||||||||||||||||||||||||||||||||||||
|
Memory 60.3 |
||
| 14 | 1 core: 26 | 29 |
|
1 core 12.5 |
||
| 24 | 2 cores: 48 | 57 |
|
2 cores 11.8 |
||
Demanding games and tasks |
|||||||||||||||||||||||||||||||||||||||||||||||
| Minimum | Average | Maximum | |||||||||||||||||||||||||||||||||||||||||||||
| 26 | 4 Cores: 49 | ||||||||||||||||||||||||||||||||||||||||||||||
|
4 cores 6. |
||
| 26 | 8 cores: 50 | 57 |
|
8 cores 3.2 |
 2
2
Extreme |
||
| Minimum | Average | Maximum |
| 27 | All cores: 51 | 07 9006 |
|
All cores 0.9 |
Different tasks require different CPU strengths. A system with few fast cores and low memory latency will be fine for the vast majority of games, but will be inferior to a system with a lot of slow cores in a rendering scenario.
We believe that a minimum of 4/4 (4 physical cores and 4 threads) processor is suitable for a budget gaming PC. At the same time, some games can load it at 100%, slow down and freeze, and performing any tasks in the background will lead to a drop in FPS.
Ideally, the budget shopper should aim for a minimum of 4/8 and 6/6. A gamer with a big budget can choose between 6/12, 8/8 and 8/16. Processors with 10 and 12 cores can perform well in games with high frequency and fast memory, but are overkill for such tasks. Also, buying for the future is a dubious undertaking, since in a few years many slow cores may not provide sufficient gaming performance.
When choosing a processor to work with, consider how many cores your programs use. For example, photo and video editors can use 1-2 cores when working with filtering, and rendering or converting in the same editors already uses all threads.
Data obtained from tests by users who tested their systems both with overclocking (maximum value in the table) and without (minimum).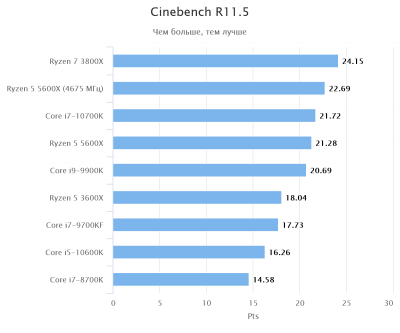 A typical result is shown in the middle, the more filled in the color bar, the better the average result among all tested systems.
Tests in games
FPS measured by us in popular games on Intel Core2 T5600 and compliance with system requirements. Please note that the official requirements of developers in games do not always match the data of real tests. Also, the result is strongly influenced by the overclocking of the system and the graphic settings in the game. We test at high settings in FullHD resolution to get numbers close to real gameplay.
On average for all gaming tests, the processor scored 27.
- no data
SSD
- 850 EVO 500GB
- MTS400 M.2 256GB
- SSDNOW V300 120GB
We have collected a list of components most often by collecting a computer based on Core2 T5600. Also with these components, the best results in tests and stable operation are achieved.
The most popular config: motherboard for Intel Core2 T5600 — Dell MP061, video card — GeForce GTX 570M, SSD — 850 Evo 500GB.
Characteristics
The data is not yet filled in, so the tables may lack information or existing functions may be omitted.
Basic
| Manufacturer | Intel |
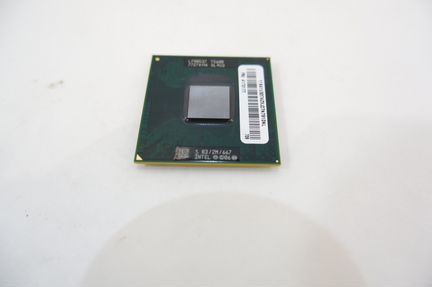
| DescriptionInformation about the processor, taken from the official website of the manufacturer. | Intel® Core™2 Duo Processor T5600 (2M Cache, 1.83 GHz, 667 MHz FSB) |
| ArchitectureCode name for the microarchitecture generation. | Merom |
| Process The manufacturing process, measured in nanometers. The smaller the technical process, the more perfect the technology, the lower the heat dissipation and power consumption. | 65 nm |
| Date of release The month and year the processor was released. | 10-2016 |
| Model Official name. | T5600 |
Cores The number of physical cores. |
2 |
| ThreadsNumber of threads. The number of logical processor cores that the operating system sees. | 2 |
| Multi-Threading Technology With Intel’s Hyper-threading and AMD’s SMT technology, one physical core is recognized by the operating system as two logical cores, thereby increasing processor performance in multi-threaded applications. | Missing |
| Base frequencyGuaranteed frequency of all processor cores at maximum load. Performance in single-threaded and multi-threaded applications and games depends on it. It is important to remember that speed and frequency are not directly related. For example, a new processor at a lower frequency may be faster than an old one at a higher one. | 1.83 GHz |
Turbo frequencyThe maximum frequency of one processor core in turbo mode. Manufacturers allow modern processors to independently increase the frequency of one or more cores under heavy load, due to which performance is noticeably increased. It may depend on the nature of the load, the number of loaded cores, temperature and the specified limits. Significantly affects the speed in games and applications that are demanding on the frequency of the CPU. It may depend on the nature of the load, the number of loaded cores, temperature and the specified limits. Significantly affects the speed in games and applications that are demanding on the frequency of the CPU. |
1.8 GHz |
| L3 cache size The third level cache acts as a buffer between the computer’s RAM and the processor’s level 2 cache. Used by all cores, the speed of information processing depends on the volume. | 2 MB |
| Instructions | 64-bit |
| Embedded Options Available Two housing versions. Standard and designed for mobile devices. In the second version, the processor can be soldered on the motherboard. | No |
| Bus frequency The speed of communication with the system. | 667 MHz FSB |
TDPThermal Design Power is an indicator that determines the heat dissipation in standard operation. The cooler or water cooling system must be rated for a larger value. Remember that with a factory bus or manual overclocking, TDP increases significantly. The cooler or water cooling system must be rated for a larger value. Remember that with a factory bus or manual overclocking, TDP increases significantly. |
34W |
Video core
RAM
PCI
Data protection
Design
Competitors
Please note that competitors are selected automatically based on performance in a specific task. Therefore, some may puzzle you. We are improving our selection algorithm, treat with understanding.
Compare
Intel Core2 T5600 vs AMD A9-9400 APUs (2016 M.SR)
Intel Core2 T5600 vs AMD Turion X2 Dual-Core Mobile RM-70
Intel Core2 T5600 vs AMD E2-3000M APU
Intel Core2 T5600 vs AMD Athlon 64 3200+
Intel Core2 T5600 vs AMD AthlonX2 DualCore QL-60
Intel Core2 T5600 vs AMD AthlonX2 DualCore QL-60
| Intel Celeron N2810 | Intel Core 2 Duo T5600 | |
|---|---|---|
| Celeron N2810 belongs to the Celeron 9 processor family0060 | Core 2 Duo T5600 is slightly inferior in terms of clock frequency, 1800 MHz compared to 2000 MHz Duo T5600 | Core 2 The Duo T5600 is less technologically advanced, since its technical process is much larger and is 65 nanometers |
| Celeron N2810 has a strong advantage in terms of heat dissipation, its TDP is lower than that of the competitor at 7.5W0060 | The Core 2 Duo T5600 processor will need a more powerful cooling system, since its heat dissipation is 34 watts equal to 1.0375V-1.3V | |
| The L1 cache of the Celeron N2810 CPU is slightly less compared to the Core 2 Duo T5600 and equals 112 KB | The L1 cache of the CPU Core 2 Duo T5600 is slightly larger than that of the Celeron N28102 Kilobyte | |
| The Celeron N2810 L2 cache is much smaller compared to the Core 2 Duo T5600 and is 1024 kilobytes |
Comparison of instructions and technologies

| Technology or instruction name | Intel Celeron N2810 | Intel Core 2 Duo T5600 | Short description |
|---|---|---|---|
| EIST (Enhanced Intel SpeedStep) | Enhanced Intel SpeedStep Energy Saving Technology. | ||
| Stop Grant state | — | Energy saving status. | |
| Sleep state | — | Sleep state. | |
| Deep Sleep state | — | Deep sleep state. | |
| Deeper Sleep state | — | Deeper sleep state. | |
| Enhanced Deeper Sleep state | — | Improved state of deeper sleep. |
|
| Dynamic Cache sizing | — | Dynamic cache resizing. | |
| Idle States | Idle states. |
| Technology or instruction name | Intel Celeron N2810 | Intel Core 2 Duo T5600 | Short description |
|---|---|---|---|
| MMX (Multimedia Extensions) | Multimedia extensions. | ||
| SSE (Streaming SIMD Extensions) | Processor streaming SIMD extension. | ||
| SSE2 (Streaming SIMD Extensions 2) | Processor Streaming SIMD Extension 2. | ||
| SSE3 (Streaming SIMD Extensions 3) | Streaming SIMD Processor Extension 3.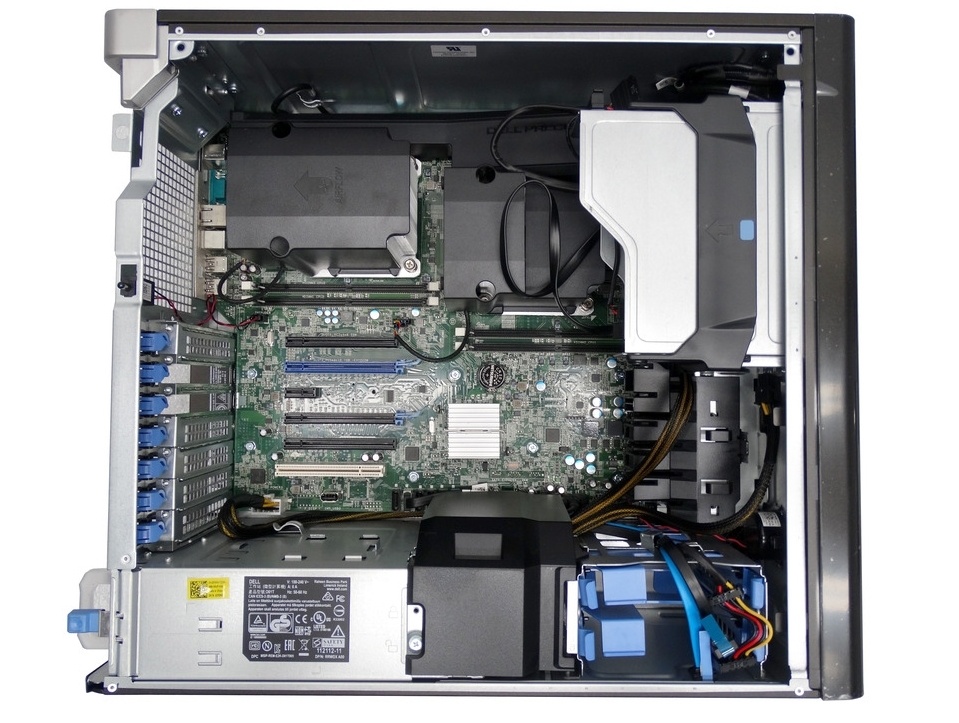 |
||
| SSSE3 (Supplemental Streaming SIMD Extension 3) | Additional SIMD extensions for streaming 3. | ||
| EM64T (Extended Memory 64-bit Technology) | 64-bit extended memory technology. | ||
| NX (Execute disable bit) | Execution inhibit bit. | ||
| SSE4 (Streaming SIMD Extensions 4) | — | Processor Streaming SIMD Extension 4. |
| Technology or instruction name | Intel Celeron N2810 | Intel Core 2 Duo T5600 | Short description |
|---|---|---|---|
| TXT (Trusted Execution Technology) | — | Trusted Execution Technology. |
|
| EDB (Execute Disable Bit) | Execute trip bit. | ||
| Anti-Theft | — | Anti-theft. |
| Technology or instruction name | Intel Celeron N2810 | Intel Core 2 Duo T5600 | Short description |
|---|---|---|---|
| VT-x (Virtualization technology) | Virtualization technology. | ||
| VT-d (Virtualization Technology for Directed I/O) | — | Virtualization technology for directed I/O. |
| Technology or instruction name | Intel Celeron N2810 | Intel Core 2 Duo T5600 | Brief description |
|---|---|---|---|
| Hyper-Threading | Hyperthreading technology. |
||
| Dynamic FSB frequency switching | — | Dynamic FSB frequency switching. | |
| vPro | — | Intel Technology Suite, vPro is a marketing term. | |
| DBS (Demand Based Switching) | — | Switching on request. | |
| Smart Connect Technology | — | Smart connection. | |
| RST (Rapid Storage Technology) | — | Rapid storage technology. |
Integrated video comparison
| Parameter or technology | Intel Celeron N2810 |
|---|---|
| Maximum GPU clock | 756 MHz |
| Clear Video HD | |
| InTru 3D |
| Interface name | Intel Celeron N2810 |
|---|---|
| Maximum number of monitors | 2 |
Other data
| Technology or parameter name | Intel Celeron N2810 |
|---|---|
| USB version | 3. 0 and 2.0 0 and 2.0 |
| Number of SATA ports | 2 |
| Number of USB ports | 5 |
Benchmarks
Overall performance rating
The summary rating is calculated by the formula, taking into account indicators: test results of all benchmarks, structure, socket, instructions, overclocking technologies, temperature data, frequency, number of cores and threads, year of release, and other data. The results of the overall rating showed that the Core 2 Duo T5600 surpasses its rival Celeron N2810 in most parameters. The Celeron N2810 barely scores 561.82 points compared to its competitor.
PassMark CPU Mark
Perhaps the most popular benchmark on the Internet. All our CPUs have been tested in PassMark. It includes a wide range of tools for large-scale evaluation of PC performance, including CPU. Among which are compression, game physics calculations, integer calculations, encryption, floating point calculations, extended instructions checking, multi-threaded and single-threaded tests. It is also possible to compare indicators with other configurations in the database. The Performance Test showed a clear advantage for the Core 2 Duo T5600 (634 points) over the Celeron N2810 (465 points). The Celeron N2810 with a score of 465 clearly loses in this test.
Cinebench 10 (32 bit) Single-threaded test
It is possible to test multiple processor systems. The test is carried out on Windows and Mac operating systems. The main performance test mode is multi-level reflections, spatial light sources, working with light, global illumination simulation, photorealistic rendering of a 3D scene, and procedural shaders. This benchmark for processors and video cards is already obsolete today. Released by MAXON, it was based on the Cinema 4D 3D editor. Single-Core version — in its work it uses only one thread for rendering and one core. It uses the ray tracing method.
Cinebench 10 (32 bit) Multi-thread test
The Multi Core version is another test option in Cinebench R10 that already uses multi-thread and multi-core test mode. It is important to note that the possible number of threads in this version is limited to sixteen.
Cinebench 11.5 (64-bit) Multi-threaded test
Multi-threaded version of CINEBENCH R11.5 benchmark, it can test the processor 100 percent using all threads and cores. Unlike previous versions of the program, 64 threads are already used here. Testing the Core 2 Duo T5600 in Cinebench version R11.5 gave a score of 1.03, which indicates a higher performance of this model. While the Celeron N2810 scores 0.7 points, it is far behind its rival in this test.
Cinebench 11.5 (64-bit) Single-threaded test
Excellent fully functional Cinebench version R11.5 from Maxon. In tests, as before, the ray tracing method is used, a highly detailed three-dimensional room with many translucent and crystalline and glass spheres is rendered. His tests are still up to date. In this Single-Core variant, tests are performed using one core and one thread. The result of the check is the «frames per second» parameter. Core 2 Duo T5600 single-thread test results in Cinebench 11.5 Single-Core showed high performance compared to the competitor, its score was 0.49points. But the Celeron N2810 itself, scoring 0.37 points in this test, is far behind it.
Cinebench 15 (64-bit) Multi-threaded test
Multi Core Cinebench R15 — will boot your system completely, showing what it can do. Cinebench 15 is ideal for testing new multithreaded CPUs from Intel and AMD. it is capable of using 256 threads. All processor cores and threads are involved in the process of rendering highly detailed 3D models. Core 2 Duo T5600 with a score of 92.2 points, unconditionally scores more points in the Multi-Core test from Cinebench 15. While its competitor Celeron N2810 is far behind with 59 points in the test.
Cinebench 15 (64-bit) Single-threaded test
Cinebench R15 is the latest tester from the Finns from Maxon today. In the Single Core version of the program, only 1 thread is involved in rendering. The whole system is tested: both video cards and CPU. For processors, the result of the analysis will be the number of PTS points, and for video adapters, the number of frames per second. FPS. A complex 3D scene is rendered with a large number of light sources, highly detailed objects and reflections. The single-threaded test of the Core 2 Duo T5600 processor in the Cinebench R15 program indicates its high performance, the result is 41.87 points. Compared to it, its competitor Celeron N2810 fails this test with a score of 31 points.
Geekbench 4.0 (64-bit) Multi-threaded test
This is already a 64-bit multi-threaded Geekbench 4 test. It is the multiplatform OS and device support that makes Geekbench tests the most common at the present time. In Geekbench 4, the 64-bit multi-core Core 2 Duo T5600 received a score of 1940, slightly better than the Celeron N2810. In this test, the Celeron N2810 scores 1556 points.
Geekbench 4.0 (64-bit) Single thread test
Geekbench 4’s latest single-threaded version for testing laptops and desktops. The Single-Core test uses one thread. This tester, like its earlier versions, still runs on systems running Windows, Mac OS, Linux. For the first time in this version of the benchmark, tablets and smartphones running iOS and Android operating systems are also supported. The Core 2 Duo T5600 scores the highest in Geekbench 4 single-threaded testing with a score of 1159points, but not much ahead of the opponent. But the Celeron N2810 itself also showed a good score of 960 points, slightly giving way to the Core 2 Duo T5600.
Geekbench 3 (32 bit) Multi-threaded benchmark
Multi-Thread version of Geekbench 3 benchmark — can allow you to make a big synthetic test of your processor and demonstrate the stability of your system.
Geekbench 3 (32 bit) Single-threaded test
Cross-platform Geekbench is often used to evaluate the system under Mac, but it can be run on both Linux and Windows. The main purpose is to test CPU performance. The 32-bit version of the benchmark loads only one CPU core and one thread.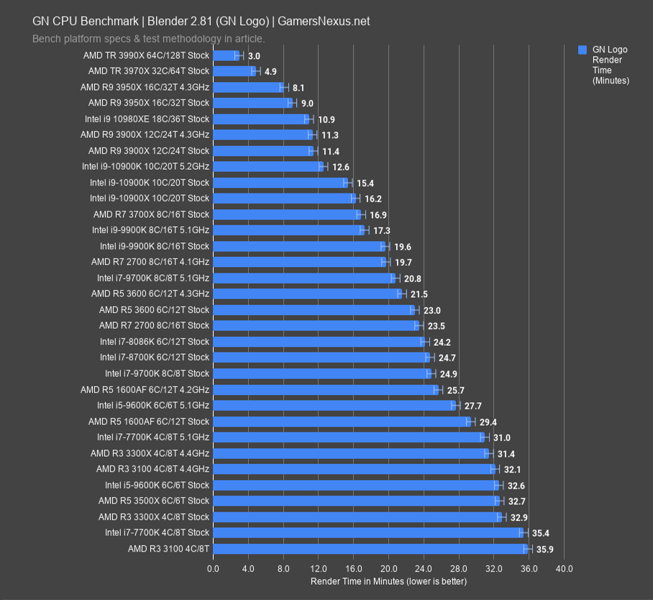
Geekbench 2
Older version of Geekbench 2. There are more recent updates, 5v and 4v. Our archive contains almost 200 CPU models that have test results in this benchmark.
X264 HD 4.0 Pass 1
In essence, this is a practical test of processor performance by transcoding HD files to H.264 format or the so-called MPEG 4 x264 codec. This test is faster than Pass 2 because it renders at a constant speed. This is the most appropriate test for multi-core and multi-thread processors. The number of frames processed per second. is the benchmark for the test. The MPEG 4 video processing speed of the Core 2 Duo T5600 is slightly higher than that of the Celeron N2810, and amounted to 25.73 FPS. Celeron N2810 was able to score 23 FPS, slightly behind the first processor.
X264 HD 4.0 Pass 2
This is a slightly different, slower test based on video file compression. The final figure is also measured in frames per second. As a result, we get better video quality. The same MPEG4 x264 codec is used, but the rendering is already happening at a variable rate. It is important to understand that a very real task is being simulated, and the x264 codec is used in many encoders. Therefore, the results of the checks realistically reflect the effectiveness of the platform. When measuring the speed of video file compression by the Core 2 Duo T5600 processor in mpeg4 format, the result was 5.6 Frames / s. Its competitor Celeron N2810 showed a much lower video encoding rate compared to it — 4 Frames / s.
3DMark06 CPU
This benchmark is often used by gamers, overclockers and overclockers. CPUs are tested in 2 ways: the game AI performs pathfinding, and another test emulates the system using PhysX. Based on DirectX 9.0 by Finnish team Futuremark. Benchmark program for testing CPU and video systems. The Core 2 Duo T5600 performs significantly faster in the pathfinding and game physics tests, with a score of 1560. Celeron N2810 coped worse with this task, receiving 1043 points.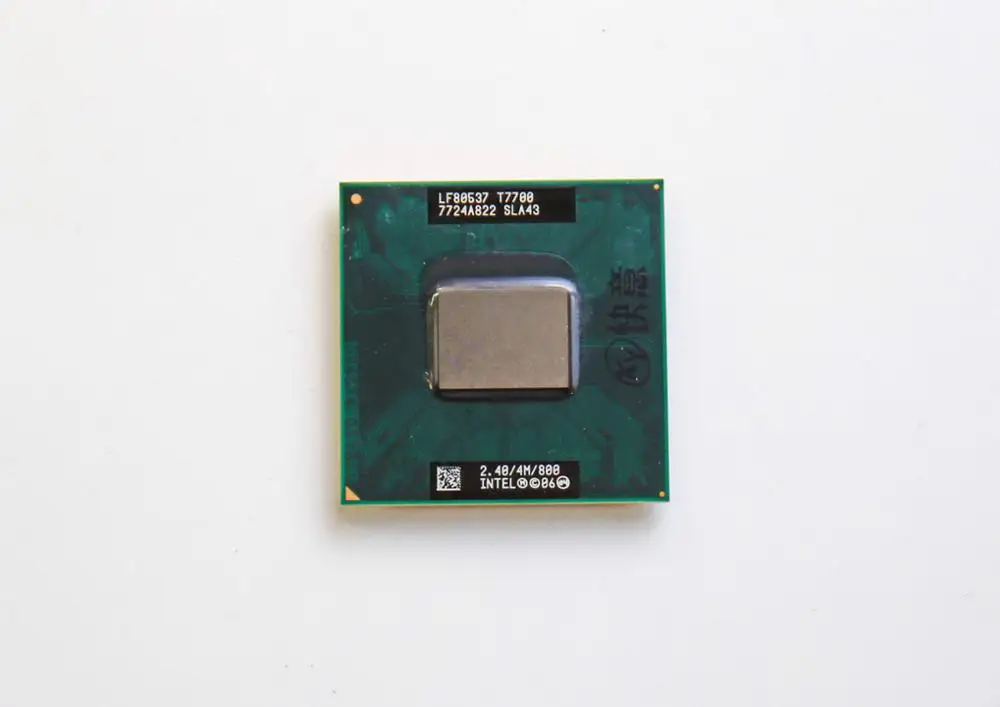
3DMark Fire Strike Physics
It can be argued that almost two hundred CPUs on our Internet resource have data in the 3DMark Physics test. It includes an accurate test that makes calculations in game physics.
WinRAR 4.0
Everyone knows the file archiver. The checks were made under the control of the Windows system. The speed of compression into the RAR format was evaluated; for this, huge volumes of randomly generated files were generated. The resulting speed during compression «kilobytes per second» — this is the test indicator. Core 2 Duo T5600 is slightly ahead of the competitor in WinRAR file compression speed, the data encoding result is 703.33 Kb/s. The Celeron N2810 delivered an encoding rate of 680 Kb/s.
TrueCrypt AES
This is not quite a tester, but the results of its use can evaluate the performance of the entire system. Our site presents the results of encryption speed in Gb / s using the AES algorithm. The program can fully function in different operating systems: Mac OS X, Linux and Windows. Unfortunately, support for this program was stopped on May 28, 2014. It has a built-in ability to quickly encrypt disk partitions.
Intel Core2 Duo T7600
Home / Processors / Intel Core2 Duo T7600
- Edelmark rating — 0 out of 10;
- Release date: August, 2006;
- Number of cores: 2;
- Frequency: 2.33 GHz;
- Power consumption (TDP): 34W;
Characteristics Intel Core2 Duo T7600
General parameters
| Clock frequency | 2.33 GHz |
|---|---|
| Cores | 2 |
| Socket | 479 |
Functions
| NX-bit (XD-bit) present | Yes |
|---|---|
| Trusted Computing Support | No |
| Virtualization support | Yes |
| Instructions supported | MMX SSE SSE2 SSE3 Supplemental SSE3 |
| Support for dynamic frequency scaling (CPU Throttling) | Yes |
Power consumption
| Power consumption | 34W |
|---|---|
| Annual cost of electricity (NON-commercial use) | 8. 19 $/year 19 $/year |
| Capacity per W | 1.49pt/W |
| Average energy consumption | 27.63W |
Bus
| Architecture | FSB |
|---|---|
| Clock frequency | 667MHz |
Parts and Features
| Architecture | x86-64 |
|---|---|
| Threads | 2 |
| Second level cache (L2) | 4MB |
| Second level cache per core (L2) | 2 MB/core |
| Process | 65 nm |
| Number of transistors | 291,000,000 |
| Maximum processors | 1 |
| Processor multiplier | 14 |
| Voltage range | 1.04 — 1.3V |
Overclocking Core2 Duo T7600
| Overclocking Clock | 2.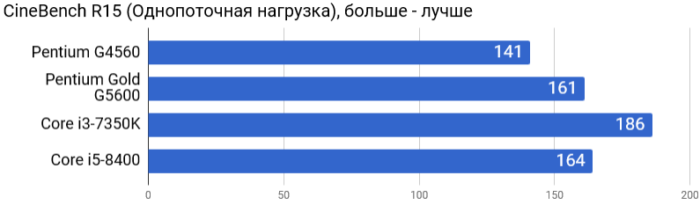 76 GHz 76 GHz |
|---|---|
| Water-cooled boost clock | 2.33GHz |
| Air cooled boost clock | 2.76 GHz |
Integrated (integrated) graphics
| Graphics core | No |
|---|---|
| Brand | No |
| Latest DirectX | No |
| Number of displays supported | No |
| Graphics core clock speed | No |
| Maximum clock frequency | No |
| 3DMark06 | No |
Comparison of Core2 Duo T7600 with similar processors
Performance
Performance using all cores.
| Core2 Duo T7600 | 5.0 out of 10 |
|---|---|
| Core2 Duo T7200 | 4.0 out of 10 |
| Core2 Duo T5600 | 3.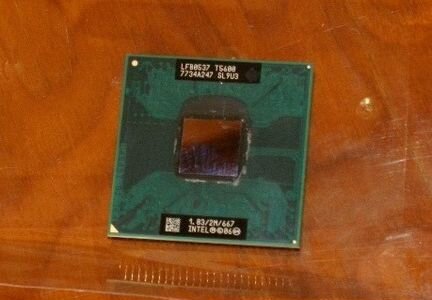 8 out of 10 8 out of 10 |
Performance per core
Base performance per processor core.
| Core2 Duo T7600 | 5.0 out of 10 |
|---|---|
| Core2 Duo T7200 | 4.8 out of 10 |
| Core2 Duo T5600 | 4.7 out of 10 |
Integrated Graphics
Integrated GPU performance for graphics tasks.
| Core2 Duo T7600 | 0.0 out of 10 |
|---|---|
| Core2 Duo T7200 | 0.0 out of 10 |
| Core2 Duo T5600 | 0.0 out of 10 |
Integrated Graphics (OpenCL)
Integrated GPU performance for parallel computing.
| Core2 Duo T7600 | 0.0 out of 10 |
|---|---|
| Core2 Duo T7200 | 0.0 out of 10 |
| Core2 Duo T5600 | 0.0 out of 10 |
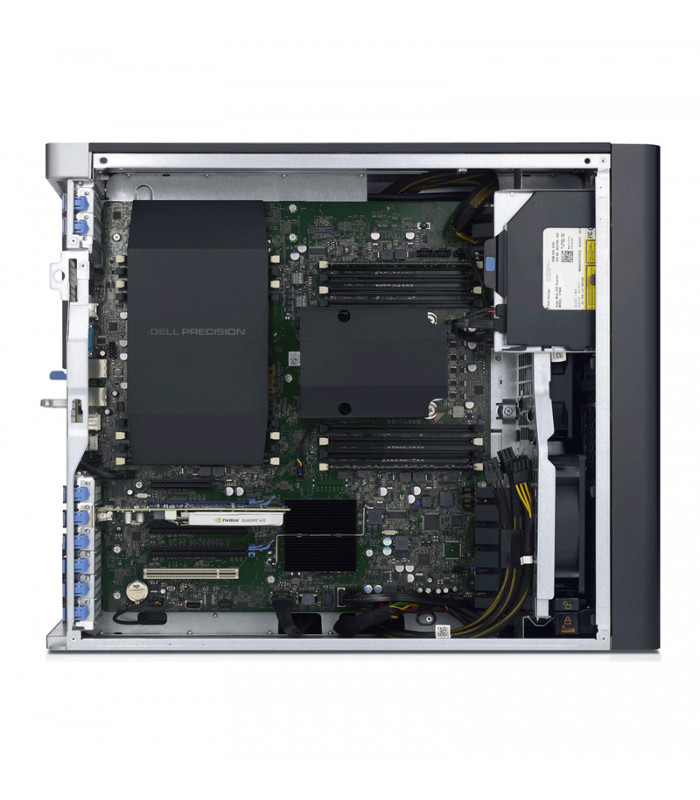 5 Video composition.
 Performance per W
How efficiently the processor uses electricity.
| Core2 Duo T7600 | 2.8 out of 10 |
|---|---|
| Core2 Duo T7200 | 2.7 out of 10 |
| Core2 Duo T5600 | 2.7 out of 10 |
Price-performance ratio
How much you overpay for performance.
| Core2 Duo T7600 | 4.8 out of 10 |
|---|---|
| Core2 Duo T7200 | n/a |
| Core2 Duo T5600 | n/a |
 5 Bitcoin mining, CompuBench 1.5 Face detection, CompuBench 1.5 Ocean Surface Simulation, CompuBench 1.5 T-Rex, CompuBench 1.5 Video composition, PCMark 8 Home 3.0 Accelerated, PassMark, Geekbench 3 Multi-Core, PassMark (Single Core), Geekbench 3 Single Core, Geekbench 3 AES Single Core, System Price (adjusted).
 Total Edelmark rating
Total processor rating.
| Core2 Duo T7600 | 0.0 out of 10 |
|---|---|
| Core2 Duo T7200 | 0.0 out of 10 |
| Core2 Duo T5600 | 0.0 out of 10 |
Benchmarks Core2 Duo T7600
CompuBench 1.5 (Bitcoin mining)
| Core2 Duo T7600 | 1.7 mHash/s |
|---|---|
| Core2 Duo T7200 | n/a |
| Core2 Duo T5600 | n/a |
CompuBench 1.
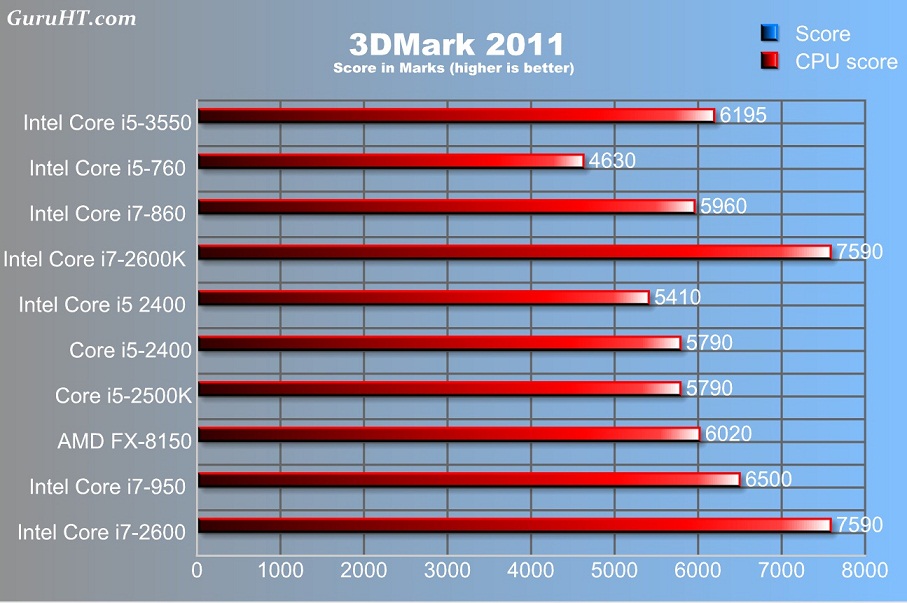 5 (Face detection)
| Core2 Duo T7600 | 0.25 mPixels/s |
|---|---|
| Core2 Duo T7200 | no data |
| Core2 Duo T5600 | n/a |
CompuBench 1.5 (Video composition)
| Core2 Duo T7600 | 0.35 fps |
|---|---|
| Core2 Duo T7200 | n/a |
| Core2 Duo T5600 | n/a |
GeekBench 3 (Multi-core)
| Core2 Duo T7600 | 2.224 |
|---|---|
| Core2 Duo T5600 | 1.761 |
| Core2 Duo T7200 | 1.908 |
GeekBench 3 (Single Core)
| Core2 Duo T7600 | 1.193 |
|---|---|
| Core2 Duo T5600 | 991 |
| Core2 Duo T7200 | 1.076 |
GeekBench 3 (AES single core)
| Core2 Duo T7600 | 99.3 MB/s |
|---|---|
| Core2 Duo T7200 | 80,800 MB/s |
| Core2 Duo T5600 | 74,100 MB/s |
PassMark
| Core2 Duo T7600 | 1. 348 348 |
|---|---|
| Core2 Duo T5600 | 1.024 |
| Core2 Duo T7200 | 1.164 |
PassMark (Single Core)
| Core2 Duo T7600 | 815 | |||||||||||||||||||||||||||||||||||||||||||||
|---|---|---|---|---|---|---|---|---|---|---|---|---|---|---|---|---|---|---|---|---|---|---|---|---|---|---|---|---|---|---|---|---|---|---|---|---|---|---|---|---|---|---|---|---|---|---|
| Core2 Duo T5600 | 651 | |||||||||||||||||||||||||||||||||||||||||||||
Core2 Duo T7200
Tags:2.33GHz, 34W, Core2 Duo T7600, CPU, Intel MSI PR210 Ya Edition notebook review GECID.com. ::>Notebooks and Tablets 09-02-2008 Notebooks have recently begun to be produced, which, in most cases, only the female audience pays attention to. These laptops are easy to spot because they have both an attractive design and a pronounced color scheme. As a rule, they are designed to emphasize their special image and use both in the business environment and in educational institutions, as well as home multimedia entertainment. MSI PR210 Ya Edition At the beginning of last year, the elegant MSI PR210 notebook was introduced, which used a special black glossy finish for that time. Inside, we find a box with a laptop, a branded bag, and a special exclusive folder for easy transportation of the laptop. The box is made in white tone, it has several images of the laptop, the manufacturer’s logo, model, and several main functions. Having unpacked the box, we find a laptop sandwiched with cardboard tabs, as well as another box with a complete set. Specification 0005
As expected, the laptop is not focused on the gaming component, but it will work fine with office applications. Having a webcam allows you to participate in video conferences wherever you are. In addition, the laptop is very compact and does not bring inconvenience during transportation. Complete set The complete set would be normal, if not for the nice bonuses specially prepared for MSI PR210 Ya Edition:
The manufacturer really took care of the users by equipping the laptop with a manipulator, however, not very large in size, just under the female handle. The device is made of plastic, painted to match the color of the laptop. Also included is a special bag that can be used to easily transport the laptop. The bag is made of nylon fabric with leather inserts in areas more likely to rub. There is a strap inside the bag for easy carrying. In Ya Edition, in addition to the bag, there is also a folder for storing and transporting the laptop. The folder is made of soft material wrapped with a mesh fabric and has a laptop color scheme. Appearance and ergonomics The design of the laptop is successful, and therefore immediately attracts attention, not only due to its color scheme, but also due to compactness. Externally, MSI PR210 Ya Edition is made of a combination of pink (outer part of the lid), black (bottom) and silver with a pink tint (insert on the top edge of the lid) colors. The firm’s logo is emblazoned at the top in the center. The front part contains two mini-jack connectors: a microphone input and a headphone output. On the right side there are communication connectors, among which it is worth noting the Express Card slot, card reader, two USB 2.0 connectors, RJ-11, HDMI output, external antenna connector, power connector. Also on this side is a ventilation compartment through which heated air escapes. On the left side are the following connectors: VGA, network RJ45, USB 2.0 port. There is also an optical drive and a Kensington lock, which is designed to protect the laptop from theft. The entire back of the notebook is occupied by the battery. Nothing else fit here. Turning the notebook over reveals the air vents. There are also two buttons for the battery, one of which is a latch, and the second, equipped with a reverse action spring, serves to disconnect the battery. Matrix and input devices This notebook uses a 12. The work area of the PR210 Ya Edition is made of silver plastic with a pink tint. While the touchpad uses just gray plastic, and the keyboard is white. Speaking of the keyboard, it is full-sized and, despite the compactness of the laptop, has not changed much. Basically, the cursor keys succumbed to the reduction. In total, the keyboard holds 87 keys, with which there is no discomfort. Like most laptops, the The touchpad is good and pleasant to work with, but it feels a bit lacking in sensitivity. As usual, under the touchpad are two standard keys, made of the same material as the touchpad itself, and responsible for LMB and RMB. A biometric sensor is installed between the keys, with which you can protect the laptop from unwanted guests. Above the main keyboard there is a metal grill, in the center of which there is an additional block of keys and indicators. The quick launch buttons are used to: launch Windows Media Player; launching the Webcam function; launching a dialog with which you can select the desired function (WLAN, Bluetooth, TV Tuner, 3G and GPS — these functions are optional). Then there are three indicators responsible for enabling/disabling the lock-keys. The last button turns the laptop on and off. Acoustics Acoustic speakers are located on the edges of the same metal grille. The sound produced by the speakers is quite loud and clear, even at maximum volume, but the music lover will not be satisfied. Webcam The webcam sits on the top edge above the LCD as usual. The camera position is fixed, so you’ll have to adjust the screen position to set the desired tilt level. The resolution of the camera module is 1.3 megapixels. There is only one microphone, so you can not hope for stereo sound. Power supply and battery The notebook uses an ADP-65HB BB (65W, 19V, 3.42A) power supply manufactured by DELTA ELECTRONICS, INC. During operation, the power supply practically does not heat up. The battery has a slightly unusual shape due to the slightly rounded outside. It is based on an 8-cell lithium-ion battery — BTY-S27 (14.4 V, 4800 mAh). Testing Two more competitors were selected for testing:
Since we did not test 12″ laptops, we had to choose competitors with approximately the same configuration, but with 15″ matrices. All laptops were running the Windows Vista operating system. First, let’s see what the built-in test in the operating system tells us. The test gave a score of 3.0 to the inside of the laptop. The reason lies in the installed video card, and this is understandable, because. it was not originally designed for games. Thanks to the CPU-Z program, we get information about the frequency characteristics of the core of the installed processor, its multiplier and capabilities, as well as information about the RAM. With the help of the GPU-Z program, we got a complete description of the video card installed in the laptop. The processor does a good job of processing information, but in graphics applications there is a catastrophic lack of performance of the video system, which is based on an entry-level integrated video card. Drives HD-Tune was used to obtain information about the laptop’s disk subsystem. The laptop has a WDC WD1200BEVS-22UST0 hard drive with a capacity of 120 GB and a spindle speed of 5400 rpm. This notebook has an optical drive manufactured by LG. Model HL-DT-ST DVDRAM GSA-T20N, which copes well with almost all discs, regardless of their «old and scratched». In our case, the test was performed with such a disk, but the drive may refuse to read more scratched disks. The result of reading is: And here is the list of drive features. Battery life Using the Battery Eater program, we measured the battery life of the laptop. The measurement took place in the options: at maximum and minimum load. The results were as follows: a charge (4800 mAh) at maximum load was enough for 95 minutes of continuous operation, but during the minimum load, the laptop turned off after 271 minutes of operation, which is a very good result. Note that the tested laptop is running Windows Vista, which drains the battery by only 5%. Results MSI laptops are certainly in demand in the market, but not as much as their competitors. Therefore, MSI began to produce special editions of its products, many remember the Crystal series of notebooks, for example, which helped to establish the company as something of a standout notebook manufacturer. Now MSI has released a multi-colored Ya Edition series, which many have reached out to because of the compactness and attractiveness of these laptops. Such a model as the PR210 Ya Edition is very convenient for emphasizing one’s individuality, which, in fact, was emphasized. But the filling of the laptop is chosen quite functional, which will allow you to work, study and relax. In addition, a pleasant feature of the tested model is a fairly long battery life. Pros:
|
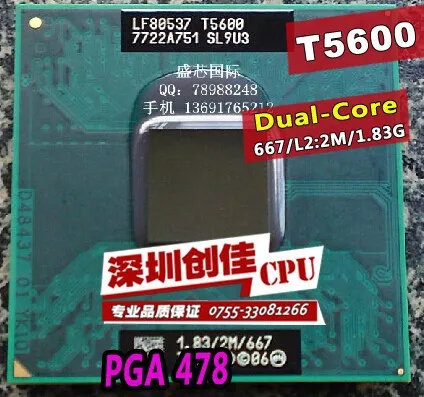 And in the BIOS, you can only configure the boot priority and fan speed, although the mother looks pretty good: heat pipes on mosfets, all polymer conduits, SLI support …. But there is one caveat — the manufacturer of this motherboard has not existed for a long time (((
  Now, the slightly redesigned MSI PR210 Ya Edition series has appeared on the market, which brings three new color schemes, namely: denim blue, wasabi green, coral pink, as well as exclusive accessories. These color variations will appeal to both the male and female audience, although, most likely, they are simply youth.
  5 x 200) 65 nm, 512 kb L2
  1″ TFT] WXGA (1280×800), AVC (Amazing Crystal Vision)
 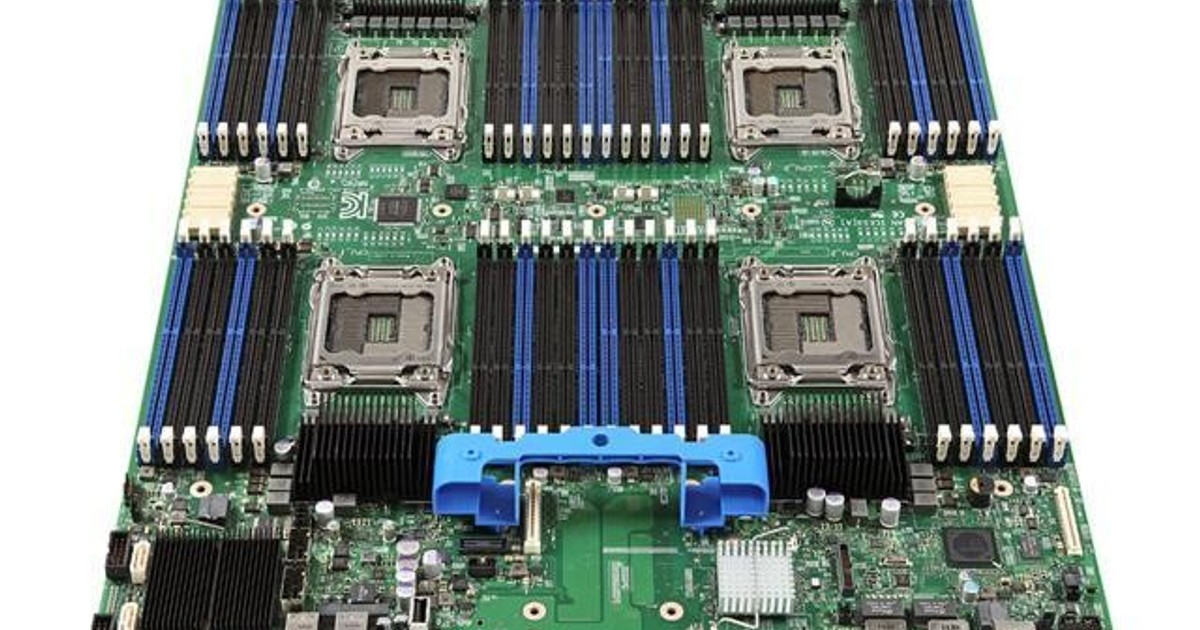 0A, 50-60Hz / 65W, 19V, 3.42A
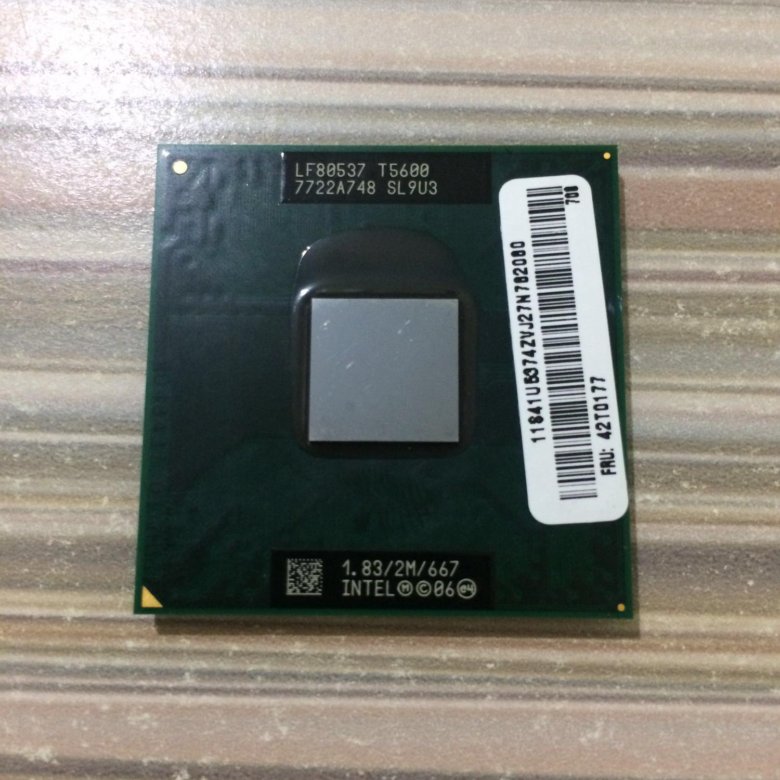
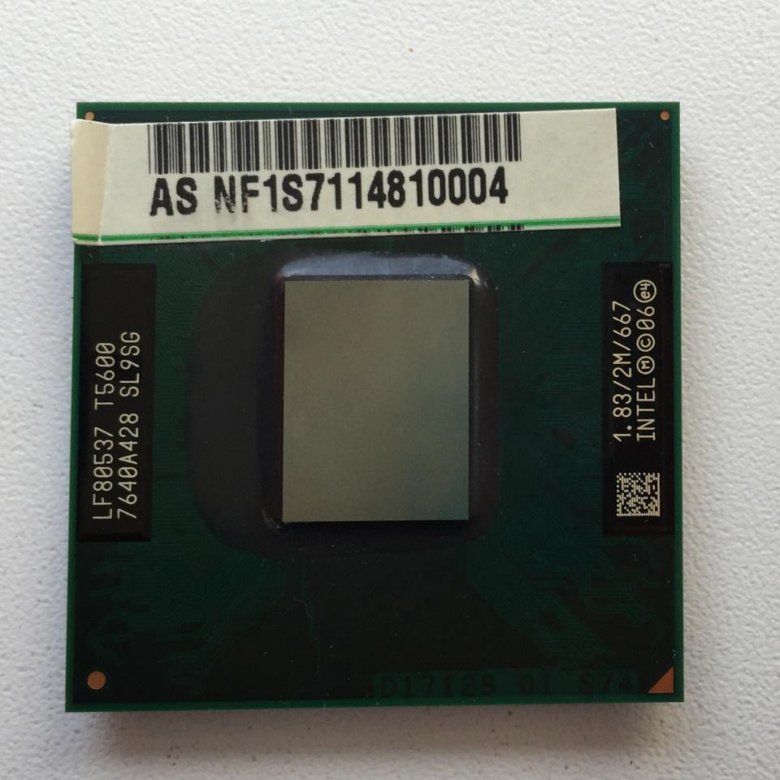
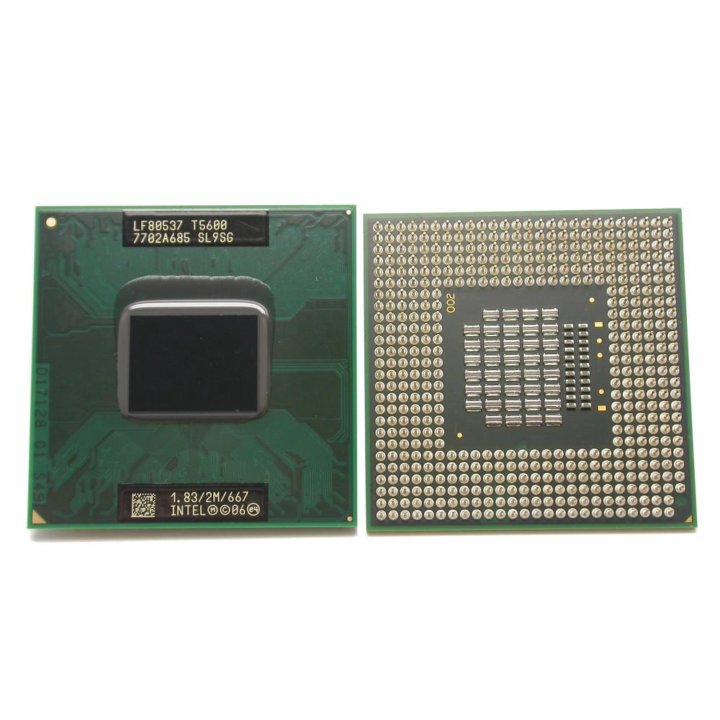 There are also four LED indicators: sleep mode, battery status, wireless network, hard drive usage.
 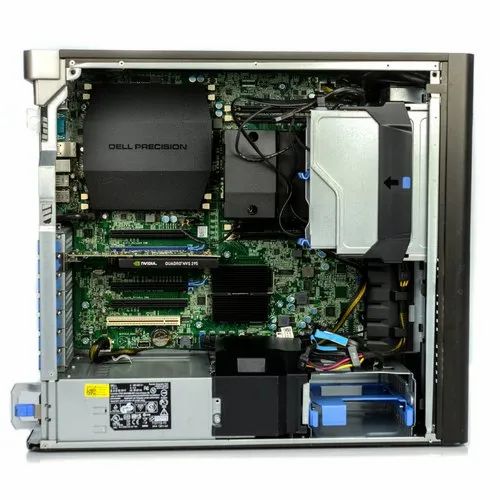 1” AVC LCD display with a resolution of up to 1280×800. A mirror coating was also applied, thanks to which the image on the display remains readable when exposed to direct sunlight. Amazing Crystal Vision (or simply AVC) technology provides a detailed image with high contrast. Thanks to this, the eyes do not feel tired, even after long-term work at the laptop.
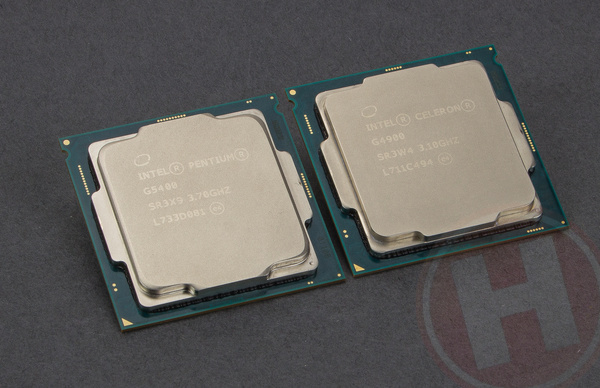 The volume control has about 20 positions, and therefore everyone can set exactly the volume level that is needed at the moment.
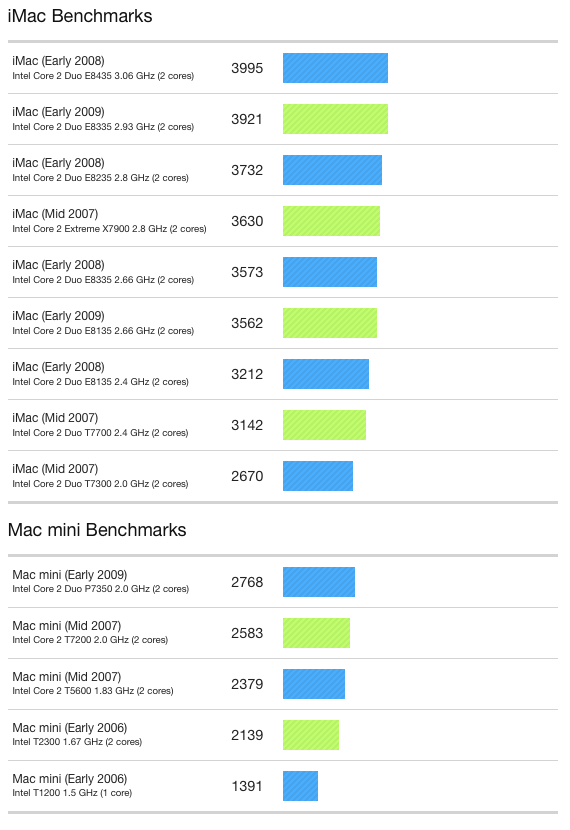 The laptop is simply not designed for games. Its capabilities are only enough for something very simple from the category of office games.
  It takes about 176 minutes to recharge the charge.