UHD Graphics 630 — Intel
UHD Graphics 630 is an integrated graphics processor introduced by Intel in 2017 for the performance desktop Coffee Lake microprocessors. The 630 are the mid-range (GT2) IGP offered by Intel with 24 execution units. UHD Graphics 630 are found in 8th and 9th generation desktop Core i3, Core i5 and Core i7 processors.
The UHD Graphics 630 is simply a rebranding and is otherwise identical to the HD Graphics 630 found in desktop Kaby Lake processors.
| i3-8000 | Core i3 | March 2018 | 4 | 4 | 3.6 GHz
3,600 MHz |
UHD Graphics 630 | 350 MHz
0.35 GHz |
1,100 MHz
1.1 GHz |
||
| i3-8000T | Core i3 | March 2018 | 4 | 4 | 3.1 GHz
3,100 MHz |
UHD Graphics 630 | 350 MHz
0.35 GHz |
1,100 MHz
1. |
||
| i3-8020 | Core i3 | 4 | 4 | UHD Graphics 630 | 350 MHz
0.35 GHz |
|||||
| i3-8020T | Core i3 | 4 | 4 | UHD Graphics 630 | 350 MHz
0.35 GHz |
|||||
| i3-8100 | $ 117.00
€ 105.30 |
Core i3 | 5 October 2017 | 4 | 4 | 3.6 GHz
3,600 MHz |
UHD Graphics 630 | 350 MHz
0.35 GHz |
1,100 MHz
1.1 GHz |
|
| i3-8100H | $ 225.00
€ 202.50 |
Core i3 | 5 July 2018 | 4 | 4 | 3 GHz
3,000 MHz |
UHD Graphics 630 | 350 MHz
0.35 GHz |
1,000 MHz
1 GHz |
|
| i3-8100T | $ 117.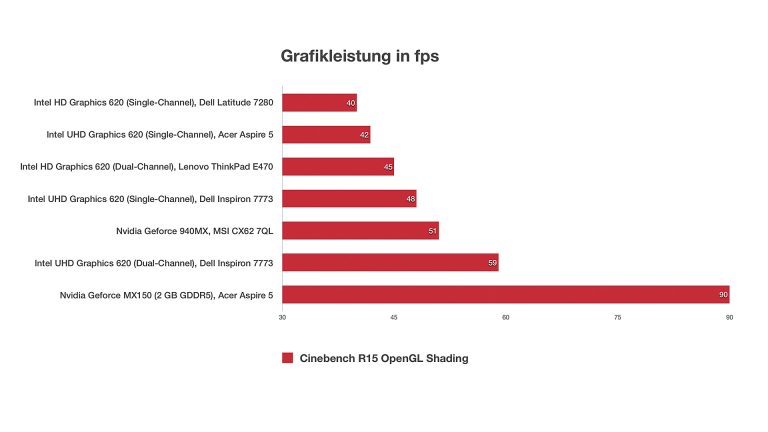 00 00
€ 105.30 |
Core i3 | 2 April 2018 | 4 | 4 | 3.1 GHz
3,100 MHz |
UHD Graphics 630 | 350 MHz
0.35 GHz |
1,100 MHz
1.1 GHz |
|
| i3-8120 | Core i3 | 4 | 4 | 3.7 GHz
3,700 MHz |
UHD Graphics 630 | 350 MHz
0.35 GHz |
||||
| i3-8120T | Core i3 | 4 | 4 | 3.2 GHz
3,200 MHz |
UHD Graphics 630 | 350 MHz
0.35 GHz |
||||
| i3-8300 | $ 138.00
€ 124.20 |
Core i3 | 2 April 2018 | 4 | 4 | 3.7 GHz
3,700 MHz |
UHD Graphics 630 | 350 MHz
0. |
1,150 MHz
1.15 GHz |
|
| i3-8300T | $ 138.00
€ 124.20 |
Core i3 | 2 April 2018 | 4 | 4 | 3.2 GHz
3,200 MHz |
UHD Graphics 630 | 350 MHz
0.35 GHz |
1,100 MHz
1.1 GHz |
|
| i3-8320 | Core i3 | 4 | 4 | 3.8 GHz
3,800 MHz |
UHD Graphics 630 | 350 MHz
0.35 GHz |
||||
| i3-8320T | Core i3 | 4 | 4 | UHD Graphics 630 | 350 MHz
0.35 GHz |
|||||
| i3-8350K | $ 168.00
€ 151.20 |
Core i3 | 5 October 2017 | 4 | 4 | 4 GHz
4,000 MHz |
UHD Graphics 630 | 350 MHz
0. |
1,150 MHz
1.15 GHz |
|
| i3-9000 | Core i3 | 4 | 4 | 3.7 GHz
3,700 MHz |
UHD Graphics 630 | 350 MHz
0.35 GHz |
1,100 MHz
1.1 GHz |
|||
| i3-9000T | Core i3 | 4 | 4 | 3.2 GHz
3,200 MHz |
UHD Graphics 630 | 350 MHz
0.35 GHz |
1,100 MHz
1.1 GHz |
|||
| i3-9100 | $ 122.00
€ 109.80 |
Core i3 | 23 April 2019 | 4 | 4 | 3.6 GHz
3,600 MHz |
4.2 GHz
4,200 MHz |
UHD Graphics 630 | 350 MHz
0.35 GHz |
1,100 MHz
1.1 GHz |
| i3-9100T | $ 122. 00 00
€ 109.80 |
Core i3 | 23 April 2019 | 4 | 4 | 3.1 GHz
3,100 MHz |
3.7 GHz
3,700 MHz |
UHD Graphics 630 | 350 MHz
0.35 GHz |
1,100 MHz
1.1 GHz |
| i3-9300 | $ 143.00
€ 128.70 $ 152.00 € 136.80 |
Core i3 | 23 April 2019 | 4 | 4 | 3.7 GHz
3,700 MHz |
4.3 GHz
4,300 MHz |
UHD Graphics 630 | 350 MHz
0.35 GHz |
1,150 MHz
1.15 GHz |
| i3-9300T | $ 143.00
€ 128.70 |
Core i3 | 23 April 2019 | 4 | 4 | 3.2 GHz
3,200 MHz |
3. 8 GHz 8 GHz
3,800 MHz |
UHD Graphics 630 | 350 MHz
0.35 GHz |
1,100 MHz
1.1 GHz |
| i5-8300H | $ 250.00
€ 225.00 |
Core i5 | 2 April 2018 | 4 | 8 | 2.3 GHz
2,300 MHz |
4 GHz
4,000 MHz |
UHD Graphics 630 | 350 MHz
0.35 GHz |
1,000 MHz
1 GHz |
| i5-8400 | $ 182.00
€ 163.80 |
Core i5 | 5 October 2017 | 6 | 6 | 2.8 GHz
2,800 MHz |
4 GHz
4,000 MHz |
UHD Graphics 630 | 350 MHz
0.35 GHz |
1,050 MHz
1.05 GHz |
| i5-8400B | $ 182. 00 00
€ 163.80 |
Core i5 | 2 April 2018 | 6 | 6 | 2.8 GHz
2,800 MHz |
4 GHz
4,000 MHz |
UHD Graphics 630 | 350 MHz
0.35 GHz |
1,050 MHz
1.05 GHz |
| i5-8400H | $ 250.00
€ 225.00 |
Core i5 | 2 April 2018 | 4 | 8 | 2.5 GHz
2,500 MHz |
4.2 GHz
4,200 MHz |
UHD Graphics 630 | 350 MHz
0.35 GHz |
1,100 MHz
1.1 GHz |
| i5-8400T | $ 182.00
€ 163.80 |
Core i5 | 2 April 2018 | 6 | 6 | 1.7 GHz
1,700 MHz |
3.3 GHz
3,300 MHz |
UHD Graphics 630 | 350 MHz
0. |
1,050 MHz
1.05 GHz |
| i5-8420 | Core i5 | 6 | 6 | UHD Graphics 630 | ||||||
| i5-8420T | Core i5 | 6 | 6 | UHD Graphics 630 | ||||||
| i5-8500 | $ 192.00
€ 172.80 |
Core i5 | 2 April 2018 | 6 | 6 | 3 GHz
3,000 MHz |
4.1 GHz
4,100 MHz |
UHD Graphics 630 | 350 MHz
0.35 GHz |
1,100 MHz
1.1 GHz |
| i5-8500B | $ 192.00
€ 172.80 |
Core i5 | 2 April 2018 | 6 | 6 | 3 GHz
3,000 MHz |
4.1 GHz
4,100 MHz |
UHD Graphics 630 | 350 MHz
0. |
1,100 MHz
1.1 GHz |
| i5-8500T | $ 192.00
€ 172.80 |
Core i5 | 2 April 2018 | 6 | 6 | 2.1 GHz
2,100 MHz |
3.5 GHz
3,500 MHz |
UHD Graphics 630 | 350 MHz
0.35 GHz |
1,100 MHz
1.1 GHz |
| i5-8550 | Core i5 | 6 | 6 | UHD Graphics 630 | ||||||
| i5-8600 | $ 213.00
€ 191.70 |
Core i5 | 2 April 2018 | 6 | 6 | 3.1 GHz
3,100 MHz |
4.3 GHz
4,300 MHz |
UHD Graphics 630 | 350 MHz
0.35 GHz |
1,150 MHz
1.15 GHz |
| i5-8600K | $ 257. 00 00
€ 231.30 |
Core i5 | 5 October 2017 | 6 | 6 | 3.6 GHz
3,600 MHz |
4.3 GHz
4,300 MHz |
UHD Graphics 630 | 350 MHz
0.35 GHz |
1,150 MHz
1.15 GHz |
| i5-8600T | $ 213.00
€ 191.70 |
Core i5 | 2 April 2018 | 6 | 6 | 2.3 GHz
2,300 MHz |
3.7 GHz
3,700 MHz |
UHD Graphics 630 | 350 MHz
0.35 GHz |
1,150 MHz
1.15 GHz |
| i5-8650 | Core i5 | 6 | 6 | UHD Graphics 630 | ||||||
| i5-8650K | Core i5 | 6 | 6 | UHD Graphics 630 | ||||||
| i5-9300H | Core i5 | 23 April 2019 | 4 | 8 | 2. 4 GHz 4 GHz
2,400 MHz |
4.1 GHz
4,100 MHz |
UHD Graphics 630 | 350 MHz
0.35 GHz |
1,000 MHz
1 GHz |
|
| i5-9400 | $ 182.00
€ 163.80 |
Core i5 | 7 January 2019 | 6 | 6 | 2.9 GHz
2,900 MHz |
4.1 GHz
4,100 MHz |
UHD Graphics 630 | 350 MHz
0.35 GHz |
1,050 MHz
1.05 GHz |
| i5-9400H | Core i5 | 23 April 2019 | 4 | 8 | 2.5 GHz
2,500 MHz |
4.3 GHz
4,300 MHz |
UHD Graphics 630 | 350 MHz
0.35 GHz |
1,100 MHz
1.1 GHz |
|
| i5-9400T | $ 182. 00 00
€ 163.80 |
Core i5 | 23 April 2019 | 6 | 6 | 1.8 GHz
1,800 MHz |
3.4 GHz
3,400 MHz |
UHD Graphics 630 | 350 MHz
0.35 GHz |
1,050 MHz
1.05 GHz |
| i5-9500 | $ 192.00
€ 172.80 $ 202.00 € 181.80 |
Core i5 | 23 April 2019 | 6 | 6 | 3 GHz
3,000 MHz |
4.4 GHz
4,400 MHz |
UHD Graphics 630 | 350 MHz
0.35 GHz |
1,100 MHz
1.1 GHz |
| i5-9500T | $ 192.00
€ 172.80 |
Core i5 | 23 April 2019 | 6 | 6 | 2.2 GHz
2,200 MHz |
3. 7 GHz 7 GHz
3,700 MHz |
UHD Graphics 630 | 350 MHz
0.35 GHz |
1,100 MHz
1.1 GHz |
| i5-9600 | $ 213.00
€ 191.70 $ 224.00 € 201.60 |
Core i5 | 23 April 2019 | 6 | 6 | 3.1 GHz
3,100 MHz |
4.6 GHz
4,600 MHz |
UHD Graphics 630 | 350 MHz
0.35 GHz |
1,150 MHz
1.15 GHz |
| i5-9600K | $ 262.00
€ 235.80 $ 263.00 € 236.70 |
Core i5 | 19 October 2018 | 6 | 6 | 3.7 GHz
3,700 MHz |
4.6 GHz
4,600 MHz |
UHD Graphics 630 | 350 MHz
0. |
1,150 MHz
1.15 GHz |
| i7-8086K | $ 425.00
€ 382.50 |
Core i7 | 8 June 2018 | 6 | 12 | 4 GHz
4,000 MHz |
5 GHz
5,000 MHz |
UHD Graphics 630 | 350 MHz
0.35 GHz |
1,200 MHz
1.2 GHz |
| i7-8670 | Core i7 | 6 | 12 | UHD Graphics 630 | 350 MHz
0.35 GHz |
1,200 MHz
1.2 GHz |
||||
| i7-8670T | Core i7 | 6 | 12 | UHD Graphics 630 | 350 MHz
0.35 GHz |
1,200 MHz
1.2 GHz |
||||
| i7-8700 | $ 303.00
€ 272.70 |
Core i7 | 5 October 2017 | 6 | 12 | 3.2 GHz
3,200 MHz |
4.6 GHz
4,600 MHz |
UHD Graphics 630 | 350 MHz
0.35 GHz |
1,200 MHz
1.2 GHz |
| i7-8700B | $ 303.00
€ 272.70 |
Core i7 | 2 April 2018 | 6 | 12 | 3.2 GHz
3,200 MHz |
4.6 GHz
4,600 MHz |
UHD Graphics 630 | 350 MHz
0.35 GHz |
1,200 MHz
1.2 GHz |
| i7-8700K | $ 359.00
€ 323.10 |
Core i7 | 5 October 2017 | 6 | 12 | 3.7 GHz
3,700 MHz |
4.7 GHz
4,700 MHz |
UHD Graphics 630 | 350 MHz
0. |
1,200 MHz
1.2 GHz |
| i7-8700T | $ 303.00
€ 272.70 |
Core i7 | 2 April 2018 | 6 | 12 | 2.4 GHz
2,400 MHz |
4 GHz
4,000 MHz |
UHD Graphics 630 | 350 MHz
0.35 GHz |
1,200 MHz
1.2 GHz |
| i7-8750H | $ 395.00
€ 355.50 |
Core i7 | 2 April 2018 | 6 | 12 | 2.2 GHz
2,200 MHz |
4.1 GHz
4,100 MHz |
UHD Graphics 630 | 350 MHz
0.35 GHz |
1,100 MHz
1.1 GHz |
| i7-8850H | $ 395.00
€ 355.50 |
Core i7 | 2 April 2018 | 6 | 12 | 2. 6 GHz 6 GHz
2,600 MHz |
4.3 GHz
4,300 MHz |
UHD Graphics 630 | 350 MHz
0.35 GHz |
1,150 MHz
1.15 GHz |
| i7-9700 | $ 323.00
€ 290.70 $ 335.00 € 301.50 |
Core i7 | 23 April 2019 | 8 | 8 | 3 GHz
3,000 MHz |
4.7 GHz
4,700 MHz |
UHD Graphics 630 | 350 MHz
0.35 GHz |
1,200 MHz
1.2 GHz |
| i7-9700K | $ 374.00
€ 336.60 $ 385.00 € 346.50 |
Core i7 | 19 October 2018 | 8 | 8 | 3.6 GHz
3,600 MHz |
4.9 GHz
4,900 MHz |
UHD Graphics 630 | 350 MHz
0. |
1,200 MHz
1.2 GHz |
| i7-9700T | $ 323.00
€ 290.70 |
Core i7 | 23 April 2019 | 8 | 8 | 2 GHz
2,000 MHz |
4.3 GHz
4,300 MHz |
UHD Graphics 630 | 350 MHz
0.35 GHz |
1,200 MHz
1.2 GHz |
| i7-9750H | Core i7 | 23 April 2019 | 6 | 12 | 2.6 GHz
2,600 MHz |
4.5 GHz
4,500 MHz |
UHD Graphics 630 | 350 MHz
0.35 GHz |
1,100 MHz
1.1 GHz |
|
| i7-9850H | Core i7 | 23 April 2019 | 6 | 12 | 2.6 GHz
2,600 MHz |
4.6 GHz
4,600 MHz |
UHD Graphics 630 | 350 MHz
0. |
1,150 MHz
1.15 GHz |
|
| i9-8950HK | $ 583.00
€ 524.70 |
Core i9 | 2 April 2018 | 6 | 12 | 2.9 GHz
2,900 MHz |
4.6 GHz
4,600 MHz |
UHD Graphics 630 | 350 MHz
0.35 GHz |
1,200 MHz
1.2 GHz |
| i9-9880H | $ 556.00
€ 500.40 |
Core i9 | 23 April 2019 | 8 | 16 | 2.3 GHz
2,300 MHz |
4.8 GHz
4,800 MHz |
UHD Graphics 630 | 350 MHz
0.35 GHz |
1,200 MHz
1.2 GHz |
| i9-9900 | $ 439.00
€ 395.10 $ 449.00 € 404. |
Core i9 | 23 April 2019 | 8 | 16 | 3.1 GHz
3,100 MHz |
5 GHz
5,000 MHz |
UHD Graphics 630 | 350 MHz
0.35 GHz |
1,200 MHz
1.2 GHz |
| i9-9900K | $ 488.00
€ 439.20 $ 499.00 € 449.10 |
Core i9 | 19 October 2018 | 8 | 16 | 3.6 GHz
3,600 MHz |
5 GHz
5,000 MHz |
UHD Graphics 630 | 350 MHz
0.35 GHz |
1,200 MHz
1.2 GHz |
| i9-9900KS | $ 513.00
€ 461.70 |
Core i9 | 30 October 2019 | 8 | 16 | 4 GHz
4,000 MHz |
5 GHz
5,000 MHz |
UHD Graphics 630 | 350 MHz
0. |
1,200 MHz
1.2 GHz |
| i9-9900T | $ 439.00
€ 395.10 |
Core i9 | 23 April 2019 | 8 | 16 | 2.1 GHz
2,100 MHz |
4.4 GHz
4,400 MHz |
UHD Graphics 630 | 350 MHz
0.35 GHz |
1,200 MHz
1.2 GHz |
| i9-9980HK | $ 583.00
€ 524.70 |
Core i9 | 23 April 2019 | 8 | 16 | 2.4 GHz
2,400 MHz |
4.9 GHz
4,900 MHz |
UHD Graphics 630 | 350 MHz
0.35 GHz |
1,250 MHz
1.25 GHz |
| G5500 | $ 75.00
€ 67.50 |
Pentium Gold | 2 April 2018 | 2 | 4 | 3. 8 GHz 8 GHz
3,800 MHz |
UHD Graphics 630 | 350 MHz
0.35 GHz |
1,100 MHz
1.1 GHz |
|
| G5500T | $ 75.00
€ 67.50 |
Pentium Gold | 2 April 2018 | 2 | 4 | 3.2 GHz
3,200 MHz |
UHD Graphics 630 | 350 MHz
0.35 GHz |
1,050 MHz
1.05 GHz |
|
| G5600 | $ 93.00
€ 83.70 |
Pentium Gold | 2 April 2018 | 2 | 4 | 3.9 GHz
3,900 MHz |
UHD Graphics 630 | 350 MHz
0.35 GHz |
1,100 MHz
1.1 GHz |
|
| G5600T | $ 75.00
€ 67.50 |
Pentium Gold | 23 April 2019 | 2 | 4 | 3.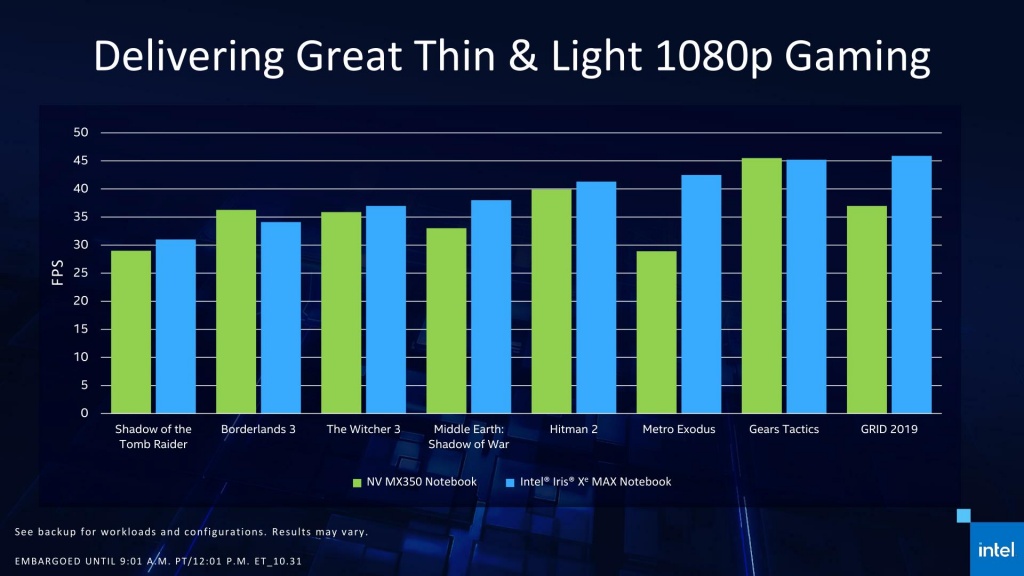 3 GHz 3 GHz
3,300 MHz |
UHD Graphics 630 | 350 MHz
0.35 GHz |
1,050 MHz
1.05 GHz |
|
| G5620 | $ 93.00
€ 83.70 |
Pentium Gold | 23 April 2019 | 2 | 4 | UHD Graphics 630 | 350 MHz
0.35 GHz |
1,100 MHz
1.1 GHz |
||
| E-2176M | $ 450.00
€ 405.00 |
Xeon E | 2 April 2018 | 6 | 12 | 2.7 GHz
2,700 MHz |
4.4 GHz
4,400 MHz |
UHD Graphics 630 | 350 MHz
0.35 GHz |
1,200 MHz
1.2 GHz |
| E-2186M | $ 623.00
€ 560.70 |
Xeon E | 2 April 2018 | 6 | 12 | 2. 9 GHz 9 GHz
2,900 MHz |
4.6 GHz
4,600 MHz |
UHD Graphics 630 | 350 MHz
0.35 GHz |
1,200 MHz
1.2 GHz |
 35 GHz
  35 GHz
  35 GHz
 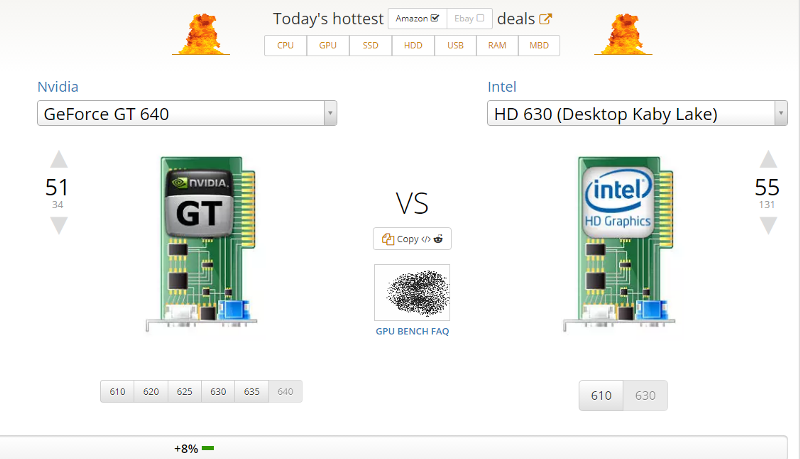 35 GHz
 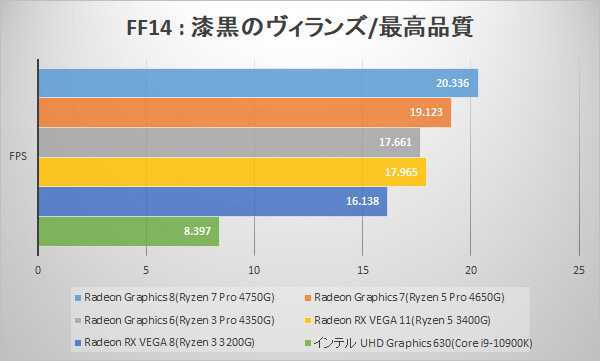 35 GHz
  99
99  35 GHz
 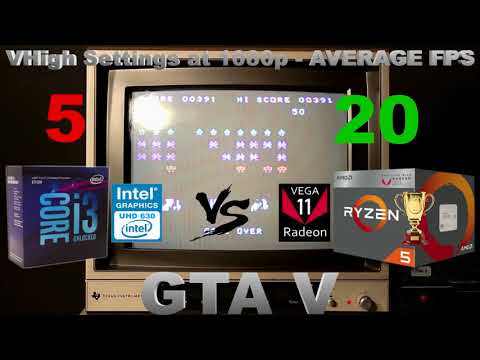 35 GHz
  35 GHz
 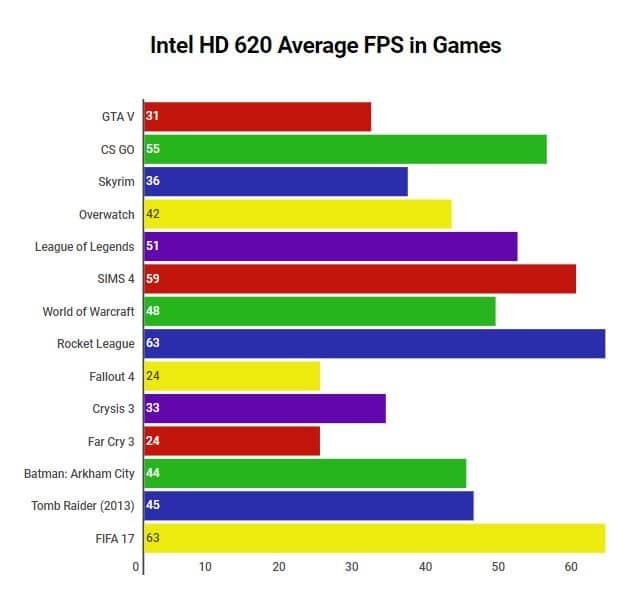 10
10  35 GHz
 AMD vs Intel Integrated Graphics: Can’t We Go Any Faster?
(Image credit: Tom’s Hardware)
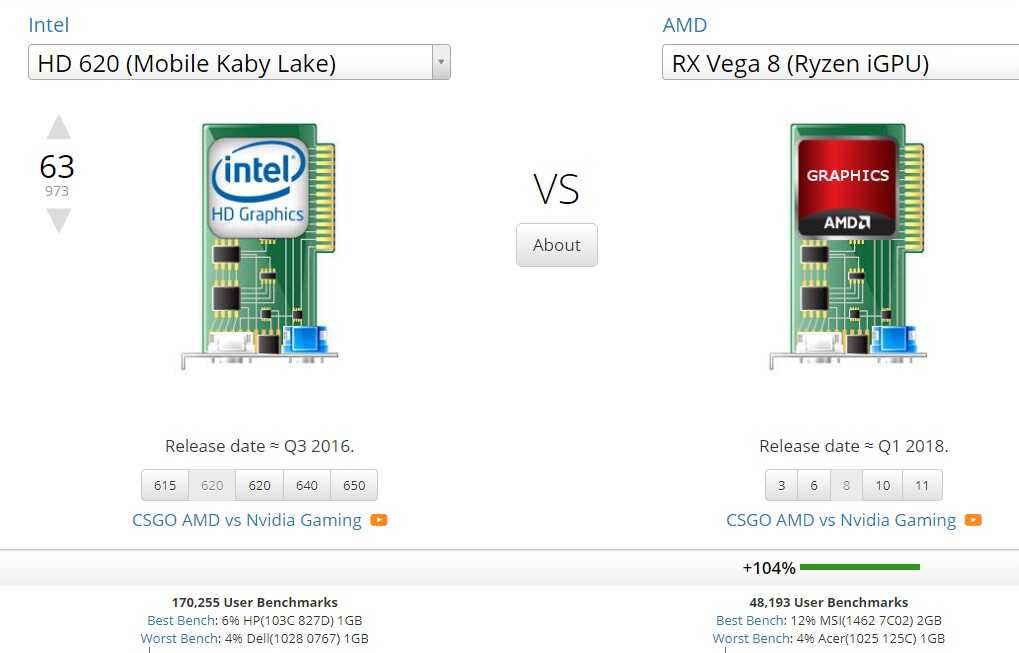
Who makes the best integrated graphics solution, AMD or Intel? The answer is simple right now if you check our GPU benchmarks hierarchy: AMD wins, easily, at least on the desktop. Current Ryzen APUs with Vega 11 Graphics are about 2.5 times faster than Intel’s UHD Graphics 630. Of course, even the fastest integrated solutions pale in comparison to a dedicated GPU, and they’re not on our list of the best graphics cards for a good reason. However, a lot of changes are coming this year, sooner than later.
Update: We’ve added Intel’s Gen11 Graphics using an Ice Lake Core i7-1065G7 processor. Thanks to Razer loaning us a Razer Blade Stealth 13, and HP chiming in with an Envy 17t, we were able to test Intel Gen11 Graphics with both a 15W (default) and 25W (Razer) TDP. We’ve also added GTX 1050 results running on a Ryzen 5 3400G, which limits performance a bit at 720p and minimum quality. We have not fully updated the text, as we’ll have a separate article looking specifically at Gen11 Graphics performance.
Judging by all the leaks, AMD’s Renoir desktop APUs should show up very soon. Meanwhile, AMD’s RNDA 2 architecture is coming (and should eventually end up in an APU), and Intel’s Tiger Lake with Xe Graphics should also arrive this summer. Unfortunately, as the saying goes, the more things change…
To give us a clear picture of where we are and where we’ve come from, specifically in regards to integrated graphics solutions, we’ve run updated benchmarks using our standard GPU test suite—with a few modifications. We’re using the same nine games (Borderlands 3, The Division 2, Far Cry 5, Final Fantasy XIV, Forza Horizon 4, Metro Exodus, Red Dead Redemption 2, Shadow of the Tomb Raider, and Strange Brigade), but we’re running at 720p (no resolution scaling) and minimum fidelity settings.
Some of these games are still relatively demanding, even at 720p, but all have been available for at least six months, which is plenty of time to fix any driver issues—assuming they could be fixed. We intend to see if the games work at all, and what sort of performance you can expect. The good news: Every game was able to run! Or, at least, they ran on current GPUs. Spoiler alert: Intel’s HD 4600 and older integrated graphics don’t have DX12 or Vulkan drivers, which eliminated several games from our list.
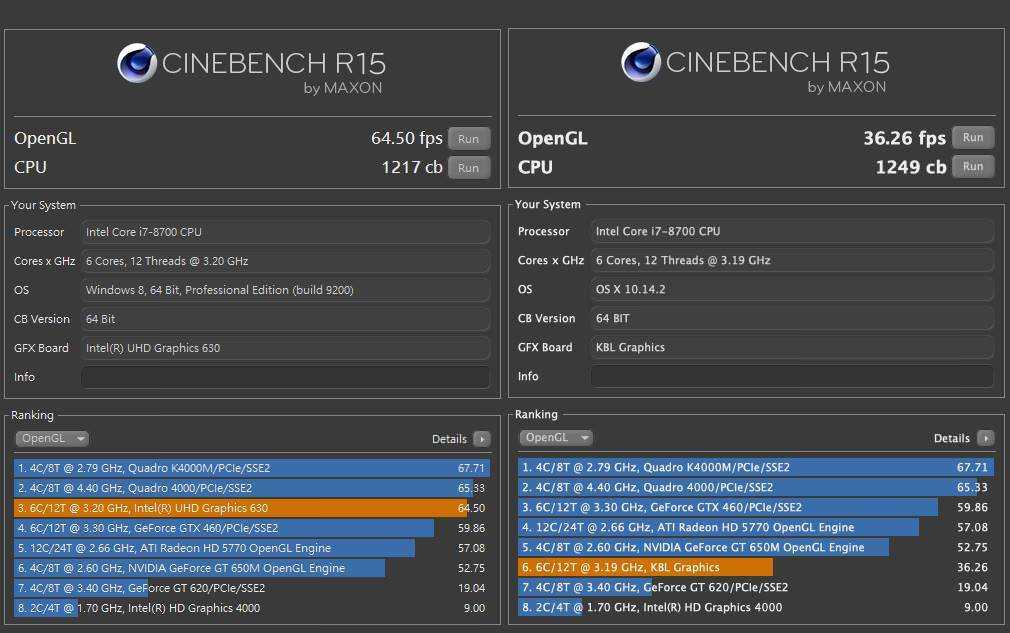
We benchmarked Intel’s current desktop GPU (UHD Graphics 630) along with an older i7-4770K (HD Graphics 4600) and compared them with AMD’s current competing desktop APUs (Vega 8 and Vega 11). For this update, we also have results from Ice Lake’s Gen11 Graphics, but that’s only for mobile solutions, so it’s in a different category. We’re still working to get a Renoir processor (AMD Ryzen 7 4800U) in for comparison, along with desktop Renoir when that launches.
We’ve also included performance from a budget dedicated GPU, the GTX 1050. The GTX 1050 is by no means one of the fastest GPUs right now, though you can try picking up a used model off eBay for around $100. (Note: don’t get the ‘fake’ China models, as they likely aren’t using an actual GTX 1050 chip!) And before you ask, no, we didn’t have a previous-gen AMD A10 (or earlier) APU for comparison.
«No graphics cards allowed.» (Image credit: Tom’s Hardware)
Test Hardware
Because we’re looking at multiple different integrated graphics solutions, our test hardware needed three different platforms. We’ve used generally high-end parts, including better-than-average memory and storage, but the systems are not (and couldn’t be) identical in all respects. One particular issue is that we needed motherboards with video output support on the rear IO panel, which restricted options. Here are the testbeds and specs.
Swipe to scroll horizontally
| Intel UHD Graphics 630 | AMD Vega 11/8 Graphics | Intel HD Graphics 4600 | Intel Iris Plus Graphics (25W) | Intel Iris Plus Graphics (15W) |
|---|---|---|---|---|
| Core i7-9700K | Ryzen 5 3400G, 2400G | Core i7-4770K | Core i7-1065G7 | Core i7-1065G7 |
| Gigabyte Z370 Aorus Gaming 7 | Ryzen 3 3200G | Gigabyte Z97X-SOC Force | Razer Blade Stealth 13 | HP Envy 17t (15W) |
| 2x16GB Corsair DDR4-3200 CL16 | MSI MPG X570 Gaming Edge WiFi | 2x8GB G. Skill DDR3-1600 CL9 Skill DDR3-1600 CL9 |
2x8GB LPDDR4X-3733 | DDR4-3200 |
| XPG 8200 Pro 2TB M.2 | 2x8GB G.Skill DDR4-3200 CL14 | Samsung 860 Pro 1TB | 256GB NVMe SSD | 512GB NVMe SSD |
| Corsair MP600 2TB M.2 |
We equipped the AMD Ryzen platform with 2x8GB DDR4-3200 CL14 memory because our normal 2x16GB CL16 kit proved troublesome for some reason. It shouldn’t matter much, as none of the tests benefit from large amounts of RAM (preferring throughput instead), and the tighter timings may even give a very slight boost to performance. The older HD 4600 setup used the only compatible motherboard I still have around, and the only DDR3 kit as well—but both were previously high-end options.
The Razer and HP laptops for Intel’s 10th Gen Core i7-1065G7 Iris Plus Graphics are better than previous GPUs, with the Razer running LPDDR4X-3733 memory, while the HP uses DDR4-3200 memory. That gives Razer (and Gen11 Graphics) a slight advantage that may account for some of the difference in performance, though the higher 25W TDP when using the performance profile appears to be the biggest factor based on our testing.
The storage also varied based on what was available (and I didn’t want to reuse the same drive, as that would entail wiping it between system tests). It shouldn’t be a factor for these gaming and graphics tests, though testing large games off the Razer’s 256GB (minus the OS) storage was a pain in the rear. How can 256GB be the baseline on a $1,700 gaming laptop in 2020?
Performance of AMD vs Intel Integrated Graphics
Let’s get cut straight to the heart of the matter. If you want to run modern games at modest settings like 1080p medium, none of these integrated graphics solutions will suffice—at least, not across all games. At 1080p and medium settings, AMD’s Vega 11 in the 3400G averaged 27 fps across the nine games, with only two games (Forza Horizon 4 and Strange Brigade) breaking the 30 fps mark—and Metro Exodus failed to hit 20 fps.
1080p medium actually looks quite decent, not far off what you’d get from an Xbox One or PlayStation 4 (though not the newer One X or PS4 Pro). Dropping the resolution or tuning the quality should make most other games playable, but we opted to do both, running at 1280×720 and minimum quality settings. We’ve also tested 3DMark Fire Strike and Time Spy for synthetic graphics performance.
Image 1 of 2
(Image credit: Tom’s Hardware)(Image credit: Tom’s Hardware)
Starting with the big-picture overall view of gaming performance, you might be surprised to see the GTX 1050 basically doubling the performance of the fastest integrated graphics solution. Yup, it’s a pretty big gap, helped by the faster desktop CPU as well (you can see that performance drops a bit with a Ryzen 5 3400G). Interestingly, a few games like Red Dead Redemption 2 close the gap as the shared system RAM helps. GTX 1050 has over double the bandwidth (112 GBps dedicated vs. 51.2 GBps shared), but only for 2GB of memory. Still, even the slowest dedicated GPU we might consider recommending ends up being far better than integrated graphics.
And that’s only when we’re looking at AMD’s current offerings. The chasm between Vega 8 and Intel’s UHD Graphics 630 is even larger than the gap between Vega 11 and the GTX 1050. AMD’s Ryzen 3 3200G with Vega 8 Graphics is 2.3 times faster than Intel’s Core i7-9700K and UHD Graphics 630. Other current-generation Intel chips can further reduce performance by limiting clocks or disabling some of the GPU processing clusters—we didn’t test anything with UHD 610, for example.
Intel’s latest Iris Plus solution in the 10th Gen Ice Lake processor does better, sort of. When constrained to 15W TDP for the entire chip, it’s only 15% faster than UHD 630. Boosting the TDP to 25W improves performance another 35%, however—55% faster than the desktop UHD 630, even though the desktop still has an additional 70W of TDP available.
Even the fastest Iris Plus Graphics still can’t catch up to a desktop Ryzen 3 3200G and Vega 7 Graphics. Part of that is the higher TDP, but a bigger factor is that AMD’s GPU architecture is simply superior. Intel is hoping to fix that with Xe Graphics, and Tiger Lake looks reasonably promising. Intel just showed off TGL (TGL-U, maybe?) running Battlefield V at 1080p high settings and around 30-33 fps. I ran that same test on 15W ICL-U and got just 10-13 fps, and 17-21 fps at 25W, with the caveat that we don’t know the TDP of the Tiger Lake chip.
Compared to its current desktop graphics solutions, Intel has a lot of ground to make up. Tripling the performance of UHD 630 would get Intel to competitive levels, which isn’t actually out of the question. Ice Lake and Gen11 Graphics are already 55% faster than UHD Graphics when equipped with a 25W TDP, and Tiger Lake with Xe Graphics could potentially deliver 75% (or more) performance than Gen11. Combined, that would be 2.75X the performance of UHD 630, which would reach acceptable levels of performance in many games. We’ll have to wait and conduct our own testing of Tiger Lake to see how Xe Graphics performs, but early indications are that it might not be too shabby.
If you’re wondering about even older Intel GPUs, the HD 4600 is roughly half as fast as UHD 630. Okay, technically it’s only 42% slower, but it did fail to run four of the nine games. Three of those require either DX12 or Vulkan, while Metro Exodus supports DX11 and tried to run … but it kept locking up a few seconds into the benchmark. Below are the full suite of benchmarks.
Image 1 of 2
(Image credit: Tom’s Hardware)(Image credit: Tom’s Hardware)
Borderlands 3 supports DX12 and DX11 rendering modes, with the latter performing better on the Intel and Nvidia GPUs. AMD meanwhile gets a modest benefit from DX12, even on its integrated graphics, so Vega 11 is ‘only’ 38% slower than the GTX 1050, compared to the overall 43% deficit. Meanwhile, Intel falls further behind Vega 8 than in the overall metric, trailing by 70% here compared to 57% overall. Even at minimum settings and 720p, UHD 630 can’t muster a playable experience.
Image 1 of 2
(Image credit: Tom’s Hardware)(Image credit: Tom’s Hardware)
The Division 2 performance shows the trend we’ll see in a lot of the more demanding games. Even at minimum quality (other than resolution scaling), Intel’s UHD 630 isn’t really playable. You could struggle through the game at 20 fps, but it wouldn’t be very fun and dips into the low-to-mid teens occur frequently. AMD meanwhile averages more than 60 fps on the 3400G and comes close with the 3200G. Framerates aren’t consistent, however, with odd behavior on the different AMD APUs. Specifically, the 99th percentile fps decreased as average fps increased.
Image 1 of 2
(Image credit: Tom’s Hardware)(Image credit: Tom’s Hardware)
Far Cry 5 relative performance is almost an exact repeat of The Division 2: Vega 8 is 1.8 times faster than UHD 630, and the 1050 is about 60% faster than the 3400G. Average framerates are lower, however, so even at minimum quality, you won’t get 60 fps from any of the integrated graphics solutions we tested. Hopefully Renoir—and maybe Xe Graphics—will change that later this year.
Image 1 of 2
(Image credit: Tom’s Hardware)(Image credit: Tom’s Hardware)
Final Fantasy XIV is the closest Intel comes to AMD’s performance, trailing by just 28%. A lot of that has to do with the game being far less demanding, especially at lower quality settings, and even Intel manages a playable 47 fps. For that matter, even the old Intel HD 4600 is somewhat playable at 27 fps. Meanwhile, the GTX 1050 has its largest lead over Vega 11, with 187 fps and 180% higher framerates. This is one of those cases where GPU memory bandwidth likely plays a bigger role, as all three AMD APUs cluster together at the 66-67 fps mark.
Image 1 of 2
(Image credit: Tom’s Hardware)(Image credit: Tom’s Hardware)
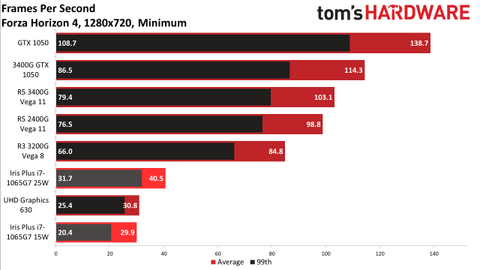
Shifting gears to Forza Horizon 4, we come to the first game that simply won’t run on older Intel GPUs. It’s a Windows 10 universal app and requires DX12, so you need at least a Broadwell (5th Gen) Intel CPU. Otherwise, performance is quite good on the AMD solutions, with the best result of the games we tested. The 3400G breaks 100 fps and even keeps minimums above 60, and the GTX 1050 is only 35% faster than the 3400G’s Vega 11 Graphics. Intel’s UHD 630 is back in the dumps, with the 3200G beating it by 175%, though it does manage a playable 31 fps—not silky smooth, but it should suffice in a pinch.
Image 1 of 2
(Image credit: Tom’s Hardware)(Image credit: Tom’s Hardware)
Metro Exodus ends up being one of the better showings for Intel’s UHD 630, as the 3200G is ‘only’ 88% faster. This is another game where GPU memory bandwidth tends to be a bigger bottleneck, and you still can’t get 30 fps with Intel. The HD 4600 would also launch the game and run for maybe 10-15 seconds before locking up, but not at acceptable framerates—we’ve omitted it from the results because it couldn’t complete the benchmark. The GTX 1050 is back to a comfortable 75% lead over the closest APU.
Image 1 of 2
(Image credit: Tom’s Hardware)(Image credit: Tom’s Hardware)
Red Dead Redemption 2 is the most demanding game we tested, with performance of just 46 fps on the 3400G Vega 11, even at 720p and minimum quality.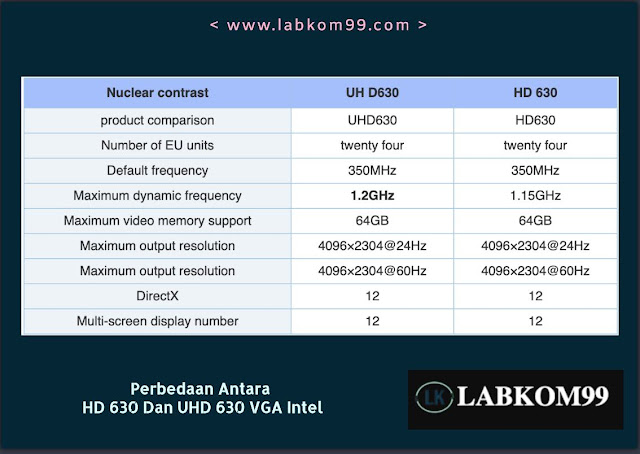 It’s still playable at least, though not on Intel’s UHD 630 where framerates are in the low-to-mid teens. We tested with the Vulkan API, and like Forza, HD 4600 can’t even attempt to run the game. The 3200G with Vega 8 notches up another big lead of 165% over UHD 630, while the GTX 1050 has another relatively close result with the dedicated GPU leading the 3400G and Vega 11 by only 45%.
Image 1 of 2
(Image credit: Tom’s Hardware)(Image credit: Tom’s Hardware)
Shadow of the Tomb Raider is back to business as usual and comes closest to matching our overall average results. The GTX 1050 leads 3400G’s Vega 11 by 74%, while the 3200G’s Vega 8 is 150% faster than UHD 630. All of the AMD APUs manage a very playable 50 fps or more, with minimums above 30 fps. Intel, on the other hand, needs to double its UHD 630 performance to hit an acceptable level, which it theoretically does with something like the Core i7-1065G7, but I’m still working on getting one of those to run my own tests.
Image 1 of 2
(Image credit: Tom’s Hardware)(Image credit: Tom’s Hardware)
Last, we have Strange Brigade, which, like RDR2, only supports the DX12 and Vulkan APIs. That knocks out HD 4600, but the remaining GPUs can all run it at acceptable levels—and even smooth levels of 60+ fps on the AMD APUs. This is one of only three games we tested where 60 fps on AMD’s integrated graphics is possible, and not coincidentally also one of the three games where Intel’s UHD 630 breaks 30 fps.
(Image credit: Tom’s Hardware)
We also wanted to look at synthetic graphics performance, as measured by 3DMark Fire Strike and Time Spy. Time Spy required DX12, so again the HD 4600 can’t run it, but the rest of the GPUs could. In the past, 3DMark has been accused of being overly kind to Intel—or perhaps it’s that Intel has put more effort into optimizing its drivers for 3DMark. But taking the overall gaming performance we showed earlier, the 3400G Vega 11 was 168% faster than the 9700K UHD 630. In Fire Strike, the result was almost identical: Vega 11 leads by 170%. Time Spy also matched up perfectly, showing Vega 11 with a 168% lead.
Which isn’t to say that 3DMark is the only testing needed. Looking at the GTX 1050 GPU shows at least one point of contention. In our overall metric, the GTX 1050 was 72% faster than the 3400G Vega 11. In Fire Strike, the 1050 is 83% faster—slightly more favorable to the dedicated GPU. Time Spy, on the other hand, drops the lead to just 57%, a massive swing, and that was only with multiple runs. One run even had a score that was lower than the 3400G.
Part of that is going to be DirectX 12, but Time Spy is also a newer ‘forward-looking’ benchmark that taxes the 1050’s limited 2GB of VRAM. The benchmark tells you as much («Your hardware may not be compatible»), and it skews the results. It’s not wrong as such, but it’s important to not simply take such results at face value.
No surprise: The AMD Ryzen 3400G is the current winner (Image credit: Tom’s Hardware)
With this round of testing out of the way—and a big part of why we wanted to do this was to prepare for the incoming Xe Graphics and AMD Renoir launches—inevitably, people wonder why the gulf between iGPU and dGPU (integrated and discrete GPUs) remains so large. Take one look at the PlayStation 5 and Xbox Series X specs, and it’s clearly possible to make something much faster. So why hasn’t this happened?
First, it’s not entirely correct to say that this hasn’t happened in the PC space. Intel shocked a lot of us when it announced Kaby Lake G in 2018, which combined a 4-core/8-thread Kaby Lake (7th Gen) CPU with a custom AMD Vega M GPU, and tacked on 4GB of HBM2 for good measure. We looked at how the Intel NUC with a Core i7-8809G performed at the time. In short, performance was decent, nearly matching an RX 570—which is significantly faster than anything we’ve included here. There were only a few problems.
First, Kaby Lake G was incredibly expensive for the level of performance it delivered. Intel likes its profit margins, and the cost of the Intel CPU, AMD GPU, and HBM2 memory was not going to be cheap. AMD sells the Ryzen 5 3400G for $150 , but the only way to get the Core i7-8809G was either with an expensive NUC or an expensive laptop.
Second, and perhaps more critically, support was a joke. Intel initially said it would «regularly» update the graphics drivers for the Vega M GPU, but that didn’t actually happen. There was a gap of nearly 12 months where no new drivers were made available. Then Intel finally passed the buck to AMD and said users should download AMD’s drivers, and less than two months later, AMD removed Vega M from its list of drivers.
But the biggest issue is that higher-performance integrated graphics is a limited market. It makes sense for a laptop where tighter integration can reduce the size and complexity, plus you can get better power balancing between the CPU and GPU. For the desktop, though, you’re better off getting a dedicated CPU and a dedicated GPU, which you can then upgrade separately.
Microsoft’s upcoming Xbox Series X has a substantially faster GPU than anything shown here. (Image credit: Microsoft)
That’s not the way the console world works, and when Sony or Microsoft are willing to foot the bill for custom silicon, impressive things can be done.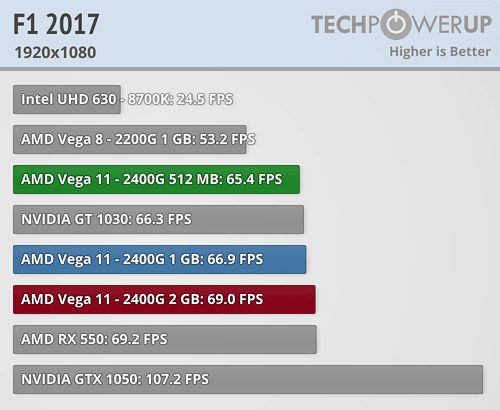 The current PS4 Pro and Xbox One X pack 36 CUs and 40 CUs, respectively. That’s three to four times as many GPU clusters as the Ryzen 5 3400G’s Vega 11 Graphics (the 11 comes from the number of CUs). The PS5 will stick with 36 CUs, but they’ll be AMD’s new RDNA 2 architecture, which potentially boosts performance per watt by over 100% compared to the older GCN architecture. Xbox Series X will kick that number up to 52 CUs, again with the RDNA 2 architecture.
More importantly for consoles, they can integrate a bunch of high-performance memory—GDDR5 for the current stuff and GDDR6 for the upcoming consoles. They don’t need to worry about users wanting to upgrade the RAM, which makes it possible to use higher performance GDDR5/GDDR6 memory. The Xbox Series X will include 16GB of 14 Gbps GDDR6 running on a 512-bit memory interface, giving 896 GBps of total bandwidth. Even with ‘overclocked’ DDR4-3200 system memory running in a dual-channel configuration, traditional PC integrated graphics solutions share the resulting 51.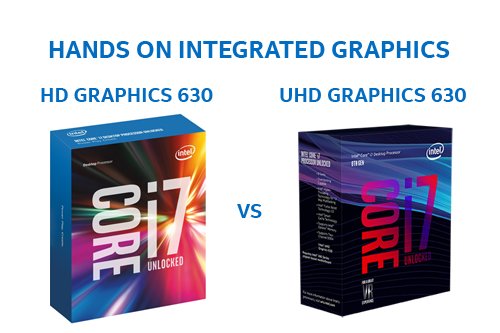 2 GBps bandwidth with the CPU. That’s a huge bottleneck.
We can see this in the performance difference between AMD’s Vega 8 and Vega 11 Graphics in the above charts. Vega 8 runs at 1250 MHz and has a theoretical 1280 GFLOPS of compute performance, while Vega 11 runs at 1400 MHz and has 1971 GFLOPS of compute. In theory, Vega 11 should be 54% faster than Vega 8. In our testing, the largest lead was 22% (Forza Horizon 4), the smallest was 2% (Final Fantasy XIV), and on average, the difference was 12%. The reason for that is mostly the memory bandwidth bottleneck.
Another example is the GTX 1050, which has a theoretical 1,862 GFLOPS of performance. AMD and Nvidia GPUs aren’t the same, however, and Nvidia usually gets about 10% more effective performance per GFLOPS. We see this, for example, with the GTX 1070 Ti with 8,186 GFLOPS, which ends up performing around the same level as a Vega 56 with 10,544 GFLOPS. Except the 1070 Ti actually runs at closer to 1.85 GHz, so basically 9,000 GFLOPS. Still, AMD needed about 15% more GFLOPS to match Nvidia with the previous architectures. So why does the GTX 1050 end up performing 72% faster? Simple: It has over twice the memory bandwidth.
Behold, the shortest lived Intel CPU of all time: Kaby Lake-G. That’s an AMD RX Vega M with HBM2 memory on the left. (Image credit: Tom’s Hardware)
If AMD or Intel wants to create a true high-performance integrated graphics solution, it will need a lot more memory bandwidth. We already see some of this in Ice Lake, with official support for LPDDR4-3733 memory (59.7 GBps compared to just 38.4 GBps for Coffee Lake U-series with DDR4-2400 memory). But integrated graphics should benefit from memory bandwidth up to and beyond 100 GBps. DDR5-6400 will basically double the bandwidth of DDR4-3200 memory, but we won’t see support for DDR5 in PCs until 2021.
As a potentially interesting aside, initial leaks of Intel’s future Rocket Lake CPUs, which may have Xe Graphics, surfaced recently. It’s only 3DMark Fire Strike and Time Spy, but the numbers aren’t particularly impressive. The Time Spy result is only 14% higher than UHD 630, while Fire Strike is 30% faster. And, as noted earlier, 3DMark scores can be kinder to Intel’s GPUs than actual gaming tests. However, we don’t know the Rocket Lake GPU configuration—as a desktop chip, Intel might once again be castrating performance. Mobile Coffee Lake for example is available with up to twice as many Execution Units (EUs) as desktop Coffee Lake, even though it generally ends up TDP limited. We’ll have to wait and see what Rocket Lake actually brings to the table in late 2020 or early 2021.
Another alternative, which Intel already has tried, is various forms of dedicated GPU caching or dedicated VRAM. Earlier versions of Iris Pro Graphics included up to a 128MB eDRAM cache, and Kaby Lake G included a 4GB HBM2 stack. Both helped alleviate the need for lots of system memory bandwidth, but they of course cost extra. Pairing ‘cheap’ integrated graphics with ‘expensive’ integrated VRAM sort of defeats the purpose. But that may change. Intel has 3D chip stacking technology that could reduce the cost and footprint of dedicated GPU VRAM. It’s called Foveros, and that’s something we’re looking forward to testing in future products.
AMD meanwhile didn’t change much with its Renoir integrated graphics. Clock speeds are up to 350 MHz higher than the 3400G, but it’s now a Vega 8 GPU. That’s likely because AMD knows stuffing in more GPU cores without boosting memory bandwidth is mostly an exercise in futility. The hope is that future Zen 3 APUs will include Navi 2x GPUs and potentially address the bandwidth issue, but don’t hold your breath for that. Plus, Zen 3 APUs are likely still a year or more off.
In short, there are ways to make integrated graphics faster and better, but they cost money. For desktop users, it will remain far easier to just buy a decent dedicated graphics card. Meanwhile, laptop and smartphone makers are working to improve performance per watt, and some promising technologies are coming. In the meantime, PC integrated graphics solutions are going to remain a bottleneck, and even more memory bandwidth likely won’t change things.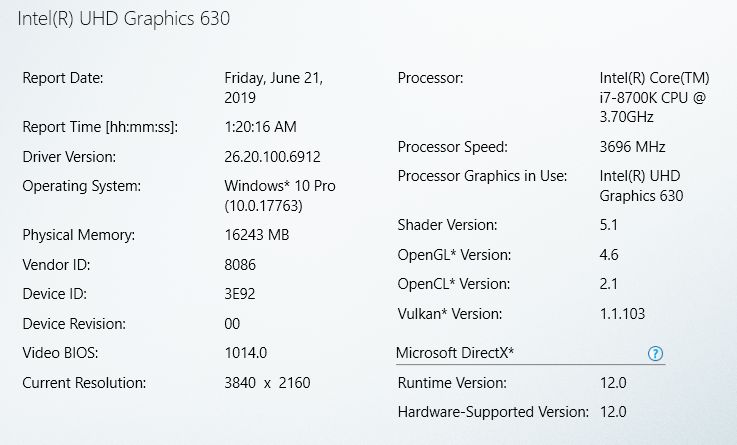
After all, Intel ships more GPUs than AMD and Nvidia combined, and yet it’s now planning to enter the discrete GPU market. Intel may still look at HBM2 or stacked chips to add dedicated RAM for future integrated GPUs, but we don’t expect those to be desktop solutions.
Jarred Walton is a senior editor at Tom’s Hardware focusing on everything GPU. He has been working as a tech journalist since 2004, writing for AnandTech, Maximum PC, and PC Gamer. From the first S3 Virge ‘3D decelerators’ to today’s GPUs, Jarred keeps up with all the latest graphics trends and is the one to ask about game performance.
Topics
Graphics
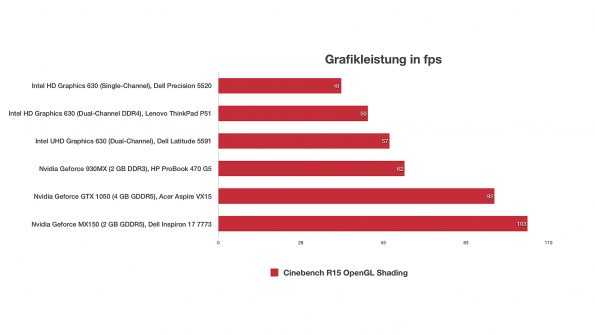
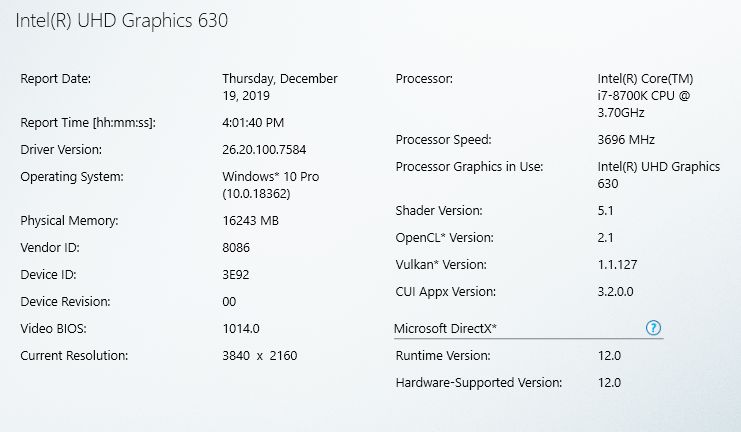
Review and testing of video card for laptops Intel UHD Graphics 630
Any modern laptop has at least one video card, which comes «by default». Considering that the vast majority of portable computers come with Intel processors, the graphics system is from the same manufacturer. Naturally, AMD processors use a video core of their own production, but in this case we will talk about Intel and the fact that each CPU has an integrated video card (GPU) — Intel HD Graphics or Iris Graphics. For use in modern games, for serious work with 3D modeling, creating animations, working with complex graphics packages, the capabilities of such graphics systems are not enough, but for the vast majority of everyday tasks, performance is more than necessary.
Games and UHD Graphics 630
But let’s see what games you will be limited to if you decide to use the UHD Graphics 630 as your gaming solution. According to my measurements, the performance of UHD Graphics 630 in older games is approximately between GeForce GTS 250 and GeForce GTS 450 . In some new games, for example, PUBG LITE , UHD Graphics 630 can outperform GeForce GTS 450 .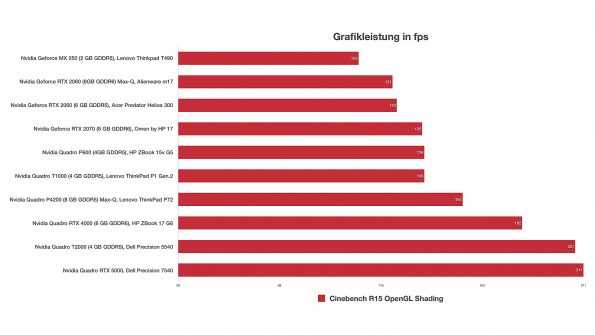
MSI N450GTS Cyclone 1GD5 (2010)
And this means that in most games until 2007-2009 release you will not experience any problems with UHD Graphics 630 at 1920×1080 resolution. I have selected for you ten great games that you can play on UHD Graphics 630 in Full HD and 30-60 FPS in anticipation of normal graphics card prices.
What is the Intel HD 630 suitable for?
Usually integrated solutions are used exclusively for office tasks, and here the HD 630 has no problems, which is not surprising. With it, you can watch videos or movies in any modern resolution. Whether it’s HD, FullHD, QuadHD or even 4K — nothing can make the video chip slow down.
Fans of watching movies in 3D will also be pleased, the HD 630 has everything you need to play this video format. You just have to connect a suitable monitor or TV that supports 3D.
The Elder Scrolls 4: Oblivion
At first I wanted to put The Elder Scrolls V: Skyrim on this list, but I think this game is worth playing at maximum settings and with a comfortable FPS. A UHD Graphics 630 stable 60 FPS in The Elder Scrolls V: Skyrim cannot provide.
But the famous RPG The Elder Scrolls 4: Oblivion will play perfectly, and this is an occasion to remember and replay this wonderful game again.
Technical features
The built-in graphics processor, with all the skepticism towards it, is still far from being as useful as it might seem. With its help, it is quite possible to connect several monitors, there are no problems with the compatibility of modern video codecs and with video processing, and there is no need to talk about surfing the net, watching videos, office work.
Intel’s latest 8th generation integrated graphics cards have been given a new name, UHD Graphics, versus the HD Graphics of earlier generations. However, this modification, in fact, ended. Starting with the Skylake generation, there was support for DirectX, Vulkan, and generally up-to-date requirements.
This significantly reduced the frequency of occurrence of an unpleasant message that notified that the game was incompatible with the graphics card. Now it’s not about performance, but about compatibility, about the ability to run the game as such.
In the AMD camp, the development of the integrated graphics processor was more active, although somewhat confusing. So, the A10-7870K and A12-9800 processors were equipped with a video card called R7, which has 512 shader units. True, the versions of this video card were still different. The A10 used its second generation on the Core Next architecture, and the third generation of the GCN-GPU was already installed in the A12-9800. The operating frequencies also differed — 866 MHz for the A10 and 1108 MHz for the A12.
It should be said that when considering all the advantages and disadvantages of AMD processors, if there is anything to blame for them, then, as a rule, it is by no means for the capabilities of the integrated graphics subsystems. The last generation released on the Zen architecture only confirms this. Unlike Intel, where the integrated video processor, in fact, has not changed for the past several generations of CPUs, the new AMD Vega video core shows impressive performance.
In general, if we talk about the technical side of things, then it is technologically possible to place a CPU and a high-performance GPU on the same substrate. But it is unreasonable, because there are several problems, for example, with the cost of the finished product, the percentage of yield, temperature conditions, the value of the thermal package, etc.
use the same RAM. Hence, there is a dependence not only on its bandwidth (because both the CPU and GPU at some point will take most of the access resources to the RAM), but also on the speed of work. In dual-channel mode, increasing the frequency of the RAM should (in theory) increase the speed of the integrated video card.
At the same time, a discrete graphics card has its own memory, usually faster than RAM.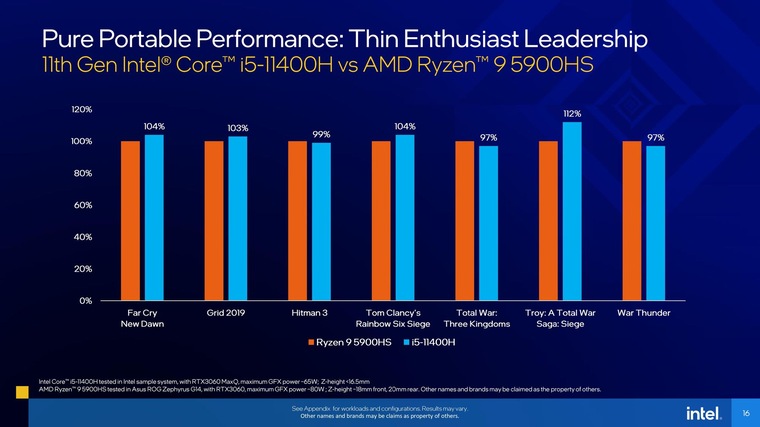 At the same time, the processor does not have a competitor that claims to have RAM, and can use it at its own discretion to the full extent of available power.
Results
As you can see, you can also play on the integrated graphics Intel . Of course, the Radeon Vega is more suitable for this, but the AMD APUs are quite specific processors that are not suitable for everyone. But 9We often see 0007 UHD Graphics — in office PCs, in budget home PCs, and in many laptops.
Write in the comments what do you think about the increase in the price of video cards, and could you use a PC with only integrated graphics for a long time?
Fee earned
This article was written by a site visitor and has earned a fee.
Overclocking
If you have a budget motherboard — you can not even hope for overclocking, it is blocked. But for owners of motherboards with an X chipset, the good news is that in the BIOS there is an opportunity to select a coefficient and from the standard 1150 it chases up to 1400 and higher.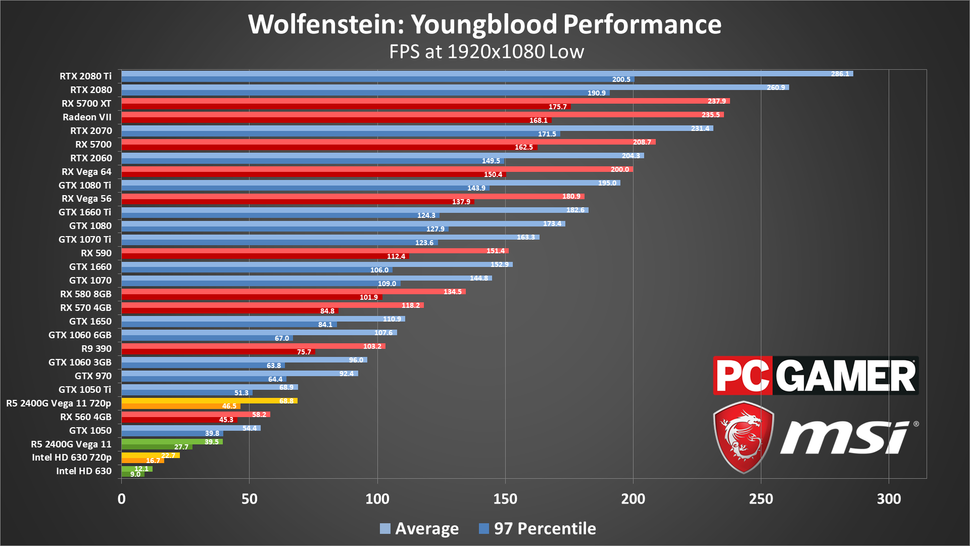 Thus, an increase of 10-20% can be achieved. Another way you can somehow increase the performance of the HD 630 is to increase the frequency of the RAM, we analyzed the results of such overclocking in our review of the Intel HD Graphics 610.
In terms of installation and work with graphics, the Intel HD 630 was able to achieve quite good results. Not exactly weak performance, as well as support for OpenCL 2.0 and Quick Sync will allow you to work in almost any professional software.
Comparison of benchmarks
GPU 1: Intel HD Graphics GPU 2: NVIDIA GeForce GT 720
Source
| GPU 3 | GPU 4 | GPU 4 | GPUs 4 | GPUs0117 |
| Other technologies | • Intel QuickSync • Intel Clear Video HD | |||
| more. |
Benefits
Reasons to choose Intel HD Graphics
- Newer video card, 5 year(s) 2 month(s) difference in release date : 14 nm vs 40 nm
- 5.
 2 times lower power consumption: 6 Watt vs 30.5 Watt
 - 4.8 times greater performance in PassMark — G3D Mark benchmark: 456 vs 96
- 3.5 times greater performance in PassMark — G2D Mark benchmark: 191 vs 54
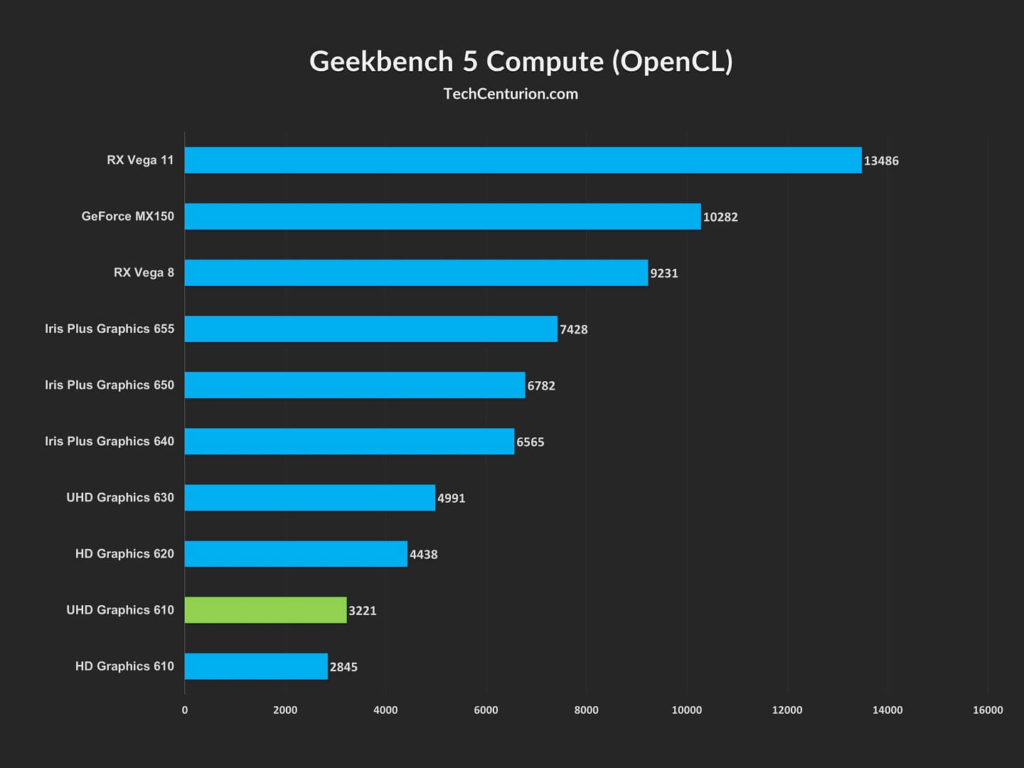
- Geekbench — OpenCL performance in 2.2 One more: 5315 VS 2438
| Characteristics | ||||||||||||||||||||||||||||
| Date of release
7 | 5 January VS 12 October | 0294
Features of the new Intel Technically, the premiere of Iris Xe Max took place back in September 2020, when Intel showed its latest mobile processors from the Tiger Lake family. Intel Iris Xe Max Iris Xe Max has its own 4 GB memory, but GDDR5 and even more so GDDR6 support is not discussed here — only LPDDR4X, and these modules are used in smartphones, tablets and laptops as operational memory. The bandwidth of these chips in this case is low — 68 GB / s. The main rival of the new Intel, GeForce MX450 Intel produces its new card on a 10-nanometer process technology, the most modern for this company. Iris Xe Max has support for the PCI-E 4.0 interface, DirectX 12.1 libraries, as well as HDMI 2.0b and DisplayPort 1.4. The maximum supported resolution is 7680×4320 pixels at 60 frames per second. How to convert a quarter of customers to self-service? Experience of Otkritie Bank IT in banks The Asus VivoBook Flip TP470 and Dell Inspiron 15 7000 were the first laptops to receive the Iris Xe Max, along with the Acer Swift 3X. BenefitsReasons to choose Intel HD Graphics
Video Card Comparison
Show another Features of work with table per table. button «Add video card»), however, too many of them can slow down the browser. To speed up the search for the desired video card, use the filter (after clicking the «Add video card» button, click on ). Video cards in the table can be swapped by dragging them to the right place with the mouse. You can “grab” a video card for dragging by the cell with its name (the top cell of the column). The same cell contains a button for deleting a video card from the table (“a cross” in the upper right corner). The content of the table can be customized by hiding / adding the necessary rows. After adding graphics cards, the table below displays their overall performance rating (in points), as well as the average frame refresh rate in computer games (FPS). If the site database does not have a test result for a video card in a certain game, the estimated average FPS is displayed, automatically calculated by the system by analyzing the performance of video cards with a similar level of performance. The expected results are visually different from the real ones (real ones are indicated by green anagrams, the supposed ones are gray). Source Intel UHD Graphics 630 — 44 secret facts, overview, specifications, reviews.Top specifications and features
Passmark Intel UHD Graphics 630 test score: Capacity Intel UHD Graphics 630: Memory Intel UHD Graphics 630: General Information Intel UHD Graphics 630: Features of Intel UHD Graphics 630: Description Generation 9 Intel UHD Graphics 630. In tests, the Intel UHD Graphics 630 proved to be as follows — according to the Passmark benchmark, the model scored 1168 points. At the same time, the maximum number of points for today is 260261 points. According to the 3DMark benchmark, the video card scored 1165 points out of 49575 possible. Why Intel UHD Graphics 630 is better than othersNo merits
Overview Intel UHD Graphics 630Performance Memory general information Functions Tests in benchmarks Intel UHD Graphics 630 Review: Highlights The graphics processing unit (GPU) has a high clock speed. 350MHz max 2457 Average: 938 MHz 2457MHz A measure of the processing power of a processor is called FLOPS. 402.4TFLOPS max 1142.32 Average: 92.5 TFLOPS 1142.32TFLOPS If the GPU speed drops below its limit, then to improve performance, it can go to a high clock frequency. 1050MHz max 2903 Average: 1375.8 MHz 2903MHz A certain number of textured pixels are displayed on the screen every second. 26.45 GTexels/s max 756.8 Average: 145.4 GTexels/s 756.8 GTexels/s Generation 9.5 Coffee Lake GT2 Yes A wide memory bus indicates that it can transfer more information in one cycle. 128bit max 8192 Average: 290.1bit 8192 bit 2017-10-01 00:00:00 Mean value: Heat Dissipation Requirements (TDP) is the maximum amount of energy that can be dissipated by the cooling system. The lower the TDP, the less power will be consumed. 15W Average: 140.4 W 2W The small size of the semiconductor means it is a new generation chip. 14 nm
Average: 47. 4 nm 189 million max 80000 Average: 5043 million 80000 million Considerable speed is provided for the expansion card used to connect the computer to peripherals. The updated versions have impressive throughput and provide high performance. 3 Mean: 2.8 5 Desktop Used in demanding games, providing enhanced graphics 12 max 12.2 Average: 11.1 12.2 Used by some applications to enable GPU power for non-graphical calculations. 3 max 4.6 Average: 1.7 4.6 Later versions provide better game graphics 4.6 max 4.6 Average: 4 4.6 Yes 6.4 max 6.6 Average: 5.5 6.6 1.3 1168 max 29325 Average: 7628.6 29325 9623 max 1
Average: 80042. 1 1078 max 38276 Average: 12463 38276 1165 max 49575 Average: 11859.1 49575 1727 max 57937 Average: 18799.9 57937 7550 max 97887 Average: 37830.6 97887 104235 max 533357
Average: 372425. 533357 19 max 60072 Average: 2402 60072 28 max 202 Average: 62.4 202 28 max 202 Average: 64 202 3 max 212 Average: 14 212 eight max 232
Average: 121. 232 eight max 175 Average: 108.4 175 3 max 107 Average: 39.6 107 3 max 107 Average: 39 107 fifteen max 177 Average: 129.8 177 fifteen max 180
Average: 132. 180 fourteen max 153 Average: 49.5 153 fourteen max 153 Average: 52.5 153 16 max 189 Average: 91.5 189 16 max 189 Average: 88.6 189 13 max 316
Average: 189. | ||||||||||||||||||||||||||
 It almost does not differ from the video card built into them, having the same 96 computing units, but at the same time a slightly increased clock frequency — 1.65 GHz.
  . That’s just in terms of characteristics, it will almost completely copy the mobile Iris Xe Max.
 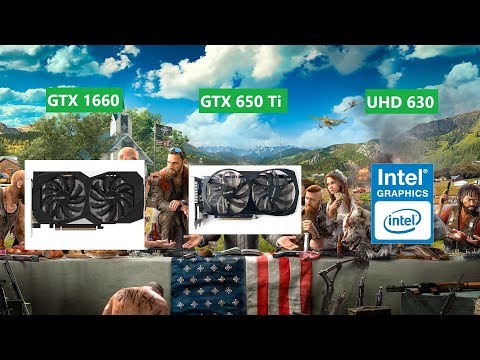 0 — Car Chase Offscreen (Fps)
 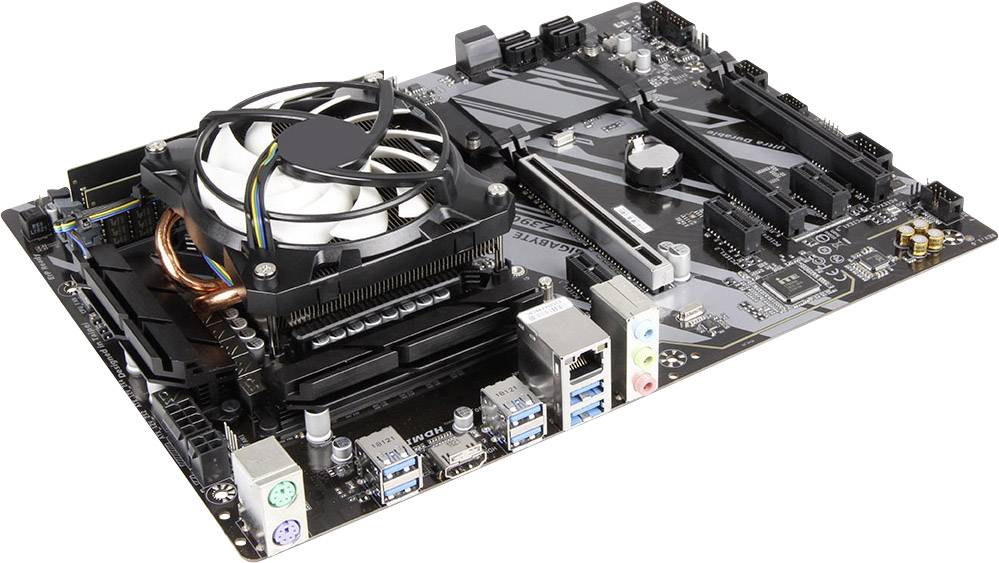 The settings button is located in the top cell of the first column of the table.
  5 has 189 million transistors, tech. 14 nm process. The frequency of the graphics core is 350 MHz. The texture size is 26.45 GTexels/s. FLOPS is 402.4.
 This parameter is lower than 27%
 This property affects the performance of the memory as well as the overall performance of the device’s graphics card.
 5 nm
5 nm
 The newer the version, the more functional it will be
 3
3
 7
7
 3
3
 8
8