GeForce GTX TITAN Z [in 5 benchmarks]
NVIDIA
GeForce GTX TITAN Z
Buy
- Interface PCIe 3.0 x16
- Core clock speed 705
- Max video memory 12 GB
- Memory type GDDR5
- Memory clock speed 7.0 Gbps
- Maximum resolution
Summary
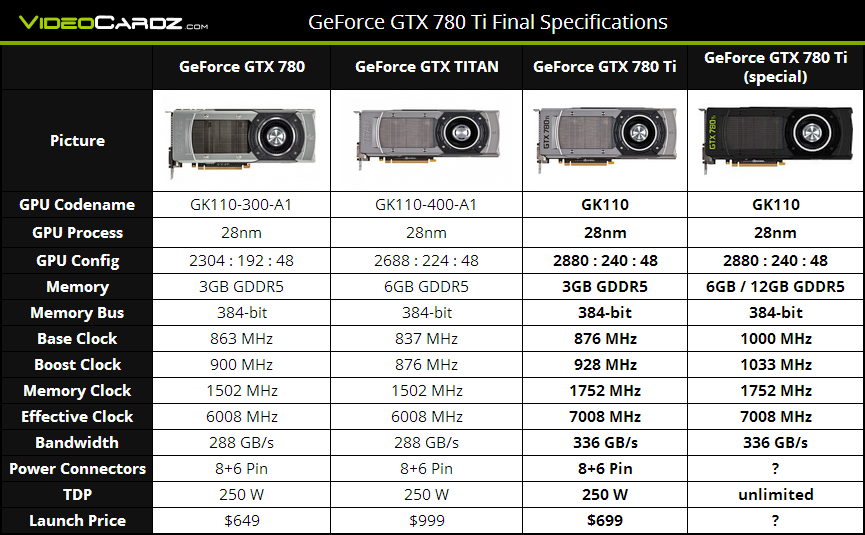
NVIDIA started GeForce GTX TITAN Z sales 28 May 2014 at a recommended price of $2,999. This is a Kepler architecture desktop card based on 28 nm manufacturing process and primarily aimed at gamers. 12 GB of GDDR5 memory clocked at 7.0 GB/s are supplied, and together with 768-bit (384-bit per GPU) memory interface this creates a bandwidth of 672 GB/s.
Compatibility-wise, this is triple-slot card attached via PCIe 3.0 x16 interface. Its manufacturer default version has a length of 10.5″ (26.7 cm). Two 8-pin power connector is required, and power consumption is at 375 Watt.
It provides poor gaming and benchmark performance at
22.78%
of a leader’s which is NVIDIA GeForce RTX 4090.
GeForce RTX
4090
Compare
General info
Some basic facts about GeForce GTX TITAN Z: architecture, market segment, release date etc.
| Place in performance rating | 175 | |
| Value for money | 3.19 | |
| Architecture | Kepler (2012−2018) | |
| GPU code name | GK110B | |
| Market segment | Desktop | |
| Release date | 28 May 2014 (8 years old) |
|
| Launch price (MSRP) | $2,999 | |
| Current price | $985 (0. 3x MSRP) 3x MSRP) |
of 49999 (A100 SXM4) |
Value for money
Performance to price ratio. The higher, the better.
- 0
- 50
- 100
Technical specs
GeForce GTX TITAN Z’s general performance parameters such as number of shaders, GPU base clock, manufacturing process, texturing and calculation speed. These parameters indirectly speak of GeForce GTX TITAN Z’s performance, but for precise assessment you have to consider its benchmark and gaming test results.
| Pipelines / CUDA cores | 2880 | of 20480 (Data Center GPU Max NEXT) |
| CUDA cores | 5760 | |
| Core clock speed | 705 MHz | of 2610 (Radeon RX 6500 XT) |
| Boost clock speed | 876 MHz | of 3599 (Radeon RX 7990 XTX) |
| Number of transistors | 7,080 million | of 14400 (GeForce GTX 1080 SLI Mobile) |
| Manufacturing process technology | 28 nm | of 4 (GeForce RTX 4080 Ti) |
| Thermal design power (TDP) | 375 Watt | of 2400 (Data Center GPU Max Subsystem) |
| Texture fill rate | 338 billion/sec | of 969.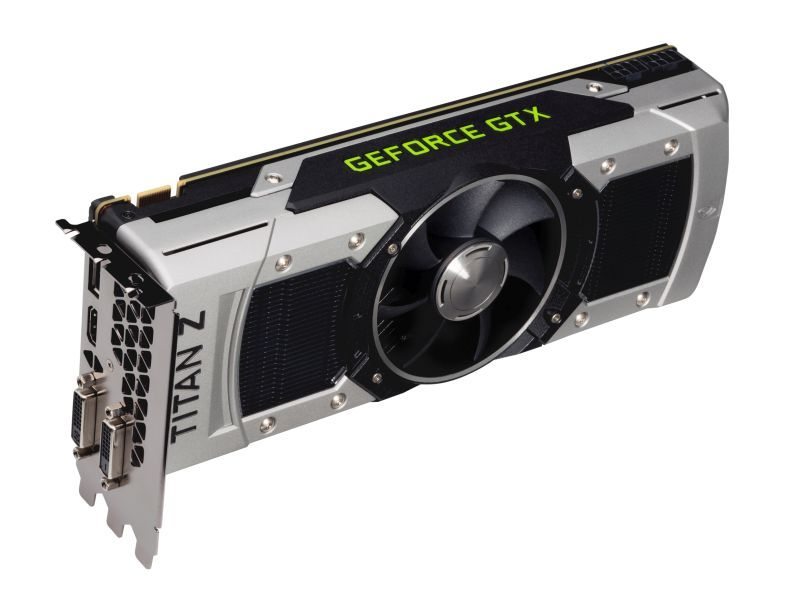 9 (h200 SXM5 96 GB) 9 (h200 SXM5 96 GB) |
| Floating-point performance | 2x 5,046 gflops | of 16384 (Radeon Pro Duo) |
Dimensions and compatibility
Information on GeForce GTX TITAN Z’s compatibility with other computer components. Useful when choosing a future computer configuration or upgrading an existing one. For desktop graphics cards it’s interface and bus (motherboard compatibility), additional power connectors (power supply compatibility).
| Bus support | PCI Express 3.0 | |
| Interface | PCIe 3.0 x16 | |
| Length | 10.5″ (26.7 cm) | |
| Height | 4.376″ (11.1 cm) | |
| Width | 3-slot | |
| Supplementary power connectors | Two 8-pin |
Memory
Parameters of memory installed on GeForce GTX TITAN Z: its type, size, bus, clock and resulting bandwidth. Note that GPUs integrated into processors have no dedicated memory and use a shared part of system RAM instead.
| Memory type | GDDR5 | |
| Maximum RAM amount | 12 GB | of 128 (Radeon Instinct MI250X) |
| Memory bus width | 768-bit (384-bit per GPU) | of 8192 (Radeon Instinct MI250X) |
| Memory clock speed | 7.0 GB/s | of 22400 (GeForce RTX 4080) |
| Memory bandwidth | 672 GB/s | of 14400 (Radeon R7 M260) |
Video outputs and ports
Types and number of video connectors present on GeForce GTX TITAN Z. As a rule, this section is relevant only for desktop reference graphics cards, since for notebook ones the availability of certain video outputs depends on the laptop model, while non-reference desktop models can (though not necessarily will) bear a different set of video ports.
| Display Connectors | One Dual Link DVI-I, One Dual Link DVI-D, One HDMI, One DisplayPort | |
| Multi monitor support | 4 displays | |
| HDMI | + | |
| HDCP | + | |
| Maximum VGA resolution | 2048×1536 | |
| Audio input for HDMI | Internal |
Technologies
Technological solutions and APIs supported by GeForce GTX TITAN Z. You’ll probably need this information if you need some particular technology for your purposes.
| Blu Ray 3D | + | |
| 3D Gaming | + | |
| 3D Vision | + | |
| 3D Vision Live | + |
API support
APIs supported by GeForce GTX TITAN Z, sometimes including their particular versions.
| DirectX | 12 (11_1) | |
| Shader Model | 5.1 | |
| OpenGL | 4.4 | of 4.6 (GeForce GTX 1080 Mobile) |
| OpenCL | 1.2 | |
| Vulkan | 1.1.126 | |
| CUDA | + |
Benchmark performance
Synthetic benchmark performance of GeForce GTX TITAN Z. Overall performance is measured in points in 0-100 range.
Overall score
This is our combined benchmark performance rating. We are regularly improving our combining algorithms, but if you find some perceived inconsistencies, feel free to speak up in comments section, we usually fix problems quickly.
GTX TITAN Z
22.78
- Passmark
- 3DMark Fire Strike Graphics
- GeekBench 5 OpenCL
- GeekBench 5 Vulkan
- GeekBench 5 CUDA
Passmark
This is probably the most ubiquitous benchmark, part of Passmark PerformanceTest suite. It gives the graphics card a thorough evaluation under various load, providing four separate benchmarks for Direct3D versions 9, 10, 11 and 12 (the last being done in 4K resolution if possible), and few more tests engaging DirectCompute capabilities.
Benchmark coverage: 25%
GTX TITAN Z
8999
3DMark Fire Strike Graphics
Fire Strike is a DirectX 11 benchmark for gaming PCs. It features two separate tests displaying a fight between a humanoid and a fiery creature seemingly made of lava. Using 1920×1080 resolution, Fire Strike shows off some realistic enough graphics and is quite taxing on hardware.
Benchmark coverage: 13%
GTX TITAN Z
17130
GeekBench 5 OpenCL
Geekbench 5 is a widespread graphics card benchmark combined from 11 different test scenarios. All these scenarios rely on direct usage of GPU’s processing power, no 3D rendering is involved. This variation uses OpenCL API by Khronos Group.
Benchmark coverage: 8%
GTX TITAN Z
18305
GeekBench 5 Vulkan
Geekbench 5 is a widespread graphics card benchmark combined from 11 different test scenarios. All these scenarios rely on direct usage of GPU’s processing power, no 3D rendering is involved. This variation uses Vulkan API by AMD & Khronos Group.
Benchmark coverage: 5%
GTX TITAN Z
22006
GeekBench 5 CUDA
Geekbench 5 is a widespread graphics card benchmark combined from 11 different test scenarios. All these scenarios rely on direct usage of GPU’s processing power, no 3D rendering is involved. This variation uses CUDA API by NVIDIA.
Benchmark coverage: 4%
GTX TITAN Z
18422
Mining hashrates
Cryptocurrency mining performance of GeForce GTX TITAN Z. Usually measured in megahashes per second.
| Bitcoin / BTC (SHA256) | 325 Mh/s |
Gaming performance
Let’s see how good GeForce GTX TITAN Z is for gaming. Particular gaming benchmark results are measured in frames per second. Comparisons with game system requirements are included, but remember that sometimes official requirements may reflect reality inaccurately.
Relative perfomance
GeForce GTX TITAN Z’s performance compared to nearest competitors among desktop video cards.
AMD Radeon RX 5500 XT
102.33
AMD Radeon R9 390
100.83
NVIDIA GeForce GTX TITAN BLACK
100.44
NVIDIA GeForce GTX TITAN Z
100
AMD Radeon RX 580
99. 21
21
NVIDIA GeForce GTX 1060 5 GB
98.38
AMD Radeon RX 5500
97.72
AMD equivalent
According to our data, the closest equivalent to GeForce GTX TITAN Z by AMD is Radeon RX 580, which is slower by 1% and lower by 1 position in our rating.
Radeon RX
580
Compare
Here are some closest AMD rivals to GeForce GTX TITAN Z:
AMD Radeon RX 6500 XT
104.7
AMD Radeon RX 5500 XT
102.33
AMD Radeon R9 390
100.83
NVIDIA GeForce GTX TITAN Z
100
AMD Radeon RX 580
99. 21
21
AMD Radeon RX 5500
97.72
AMD Radeon RX 480
96.66
Similar GPUs
Here is our recommendation of several graphics cards that are more or less close in performance to the one reviewed.
GeForce GTX
TITAN BLACK
Compare
Radeon R9
390
Compare
Radeon R9
295X2
Compare
GeForce GTX
1060 3 GB
Compare
GeForce GTX
TITAN
Compare
Radeon R9
290
Compare
Recommended processors
These processors are most commonly used with GeForce GTX TITAN Z according to our statistics.
Ryzen Threadripper
PRO 3995WX
6%
Core i9
10900KF
4.8%
Xeon Platinum
8180
3.6%
Xeon Platinum
9282
3.6%
Core i9
9900K
3.6%
Ryzen 5
2600
3.6%
Core i9
12900K
3.6%
Core i9
10900K
2. 4%
4%
FX
8350
2.4%
Core i3
10100F
2.4%
User rating
Here you can see the user rating of the graphics card, as well as rate it yourself.
Questions and comments
Here you can ask a question about GeForce GTX TITAN Z, agree or disagree with our judgements, or report an error or mismatch.
Please enable JavaScript to view the comments powered by Disqus.
Page not found — Technical City
Page not found — Technical City
We couldn’t find such page: /en/video/geforce-gtx-titan-z%23characteristics
Popular graphics cards comparisons
GeForce RTX
3060 Ti
vs
GeForce RTX
3060
GeForce RTX
2060 Super
vs
GeForce RTX
3060
GeForce RTX
3060 Ti
vs
GeForce RTX
3070
GeForce GTX
1050 Ti
vs
GeForce GTX
1650
GeForce GTX
1660 Ti
vs
GeForce GTX
1660 Super
GeForce GTX
1060 6 GB
vs
Radeon RX
580
Popular graphics cards
GeForce RTX
4090
GeForce GTX
1660 Super
GeForce RTX
3060 Ti
GeForce RTX
3060
GeForce GTX
1050 Ti
GeForce RTX
3070
Popular CPU comparisons
Ryzen 5
5600X
vs
Core i5
12400F
Ryzen 5
3600
vs
Core i5
10400F
Core i5
10400F
vs
Core i3
12100F
Ryzen 5
3600
vs
Ryzen 5
5600X
Ryzen 5
5600X
vs
Ryzen 5
5600G
Ryzen 5
3600
vs
Core i3
12100F
Popular CPUs
Ryzen 5
5500U
Ryzen 5
5600X
Core i3
1115G4
Core i5
12400F
EPYC
7h22
Core i3
12100F
How to choose sensitivity standards.
 Types of sensitivity standards, GOSTs for their application. The process of working with sensitivity standards.
In radiographic testing, there are factors that can worsen the final image blur: short focal length, exposure to high-speed film, use of fluorescent screens, large thickness of the test object. The smaller the blur, the smaller the defect we can find. Sensitivity standards are used to evaluate the blur and determine the true size of the detected defect.
Standards are an integral part of radiographic testing. But there are situations when standards cannot be used. Here is what is written on this subject in GOST 7512-82: «If it is impossible to set sensitivity standards … the procedure for conducting control without setting sensitivity standards … should be provided for in the technical documentation for the control or acceptance of welded joints.»
There are two documents regulating the work with standards. These are domestic GOST 7512-82 and adapted foreign GOST ISO 17636-1-2017. Each of them defines its own type of standards, their marking and location relative to the weld. We will consider these parameters on the basis of both GOSTs.
Danila Ksenofontov ,
technical specialist
1. Types and markings of standards
Standards are made of a metal or alloy whose base is similar in chemical composition to that of the weld being tested. Basically, standards are made of stainless steel so that they do not lose their properties over time. For specialized tasks, it is possible to manufacture standards from other materials.
1.1. Standards according to GOST 7512-82
To determine the sensitivity, GOST 7512-82 prescribes the use of three types of standards: groove, wire or plate. On an x-ray, the sensitivity must correspond to one of the three sensitivity classes: 1, 2, 3. The listing goes from best to worst — in descending order.
The reference material is indicated by a number.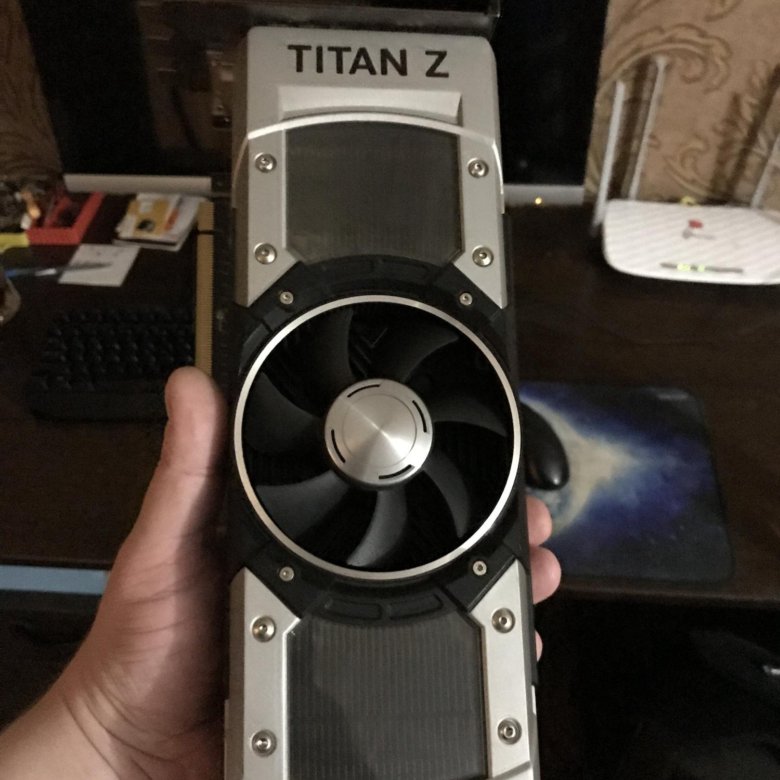 So alloys based on iron are indicated by the number 1, aluminum and magnesium — 2, titanium — 3, copper — 4, nickel — 5. The number also indicates the size of the standard. The larger the number, the larger the size of the standard, and the larger the size of the elements of the standard: grooves / wires / steps. The first number indicates the material, the second or two — the size.
Three sizes of groove gauge: 1, 2 and 3.
Hole marking helps
to interpret images
Groove gauges
The groove gauge of sensitivity is a plate with six grooves of the same depth. In total, groove standards have three sizes: 1,2 and 3.
The depth of each of the 6 grooves corresponds to the value h, prescribed in GOST 7512-82. The deeper the groove, the easier it is to see it on an x-ray. The smaller the element of the standard we see, the higher the sensitivity of the control.
Gradation of recesses of the groove standard
According to GOST 7512-82, each groove standard must be marked. In total, there are three types of markings. The first type is marking with lead signs in the part where there are no grooves. The first number indicates the material, the second — the size. This type of marking is relevant for standards that do not have holes.
Standards without holes can be identified by markings.
Pictured is a photo montage of size 2 standards made of titanium and iron
Groove gauges without marking holes. The serial numbers of standards
are applied with an electric pencil. The second type is marking in accordance with Table 2 (Appendix 3), “Marking of groove standards”. Holes of the same size are used for marking, the number of which indicates the size of the standard. Notches at the end of the standard are used to designate the material. Without notches — iron. One triangular — aluminum and magnesium, two triangular — titanium, three — copper, one rectangular — nickel.
The third type is marking in accordance with Table 3 (Appendix 3), «Marking groove standards with holes. » The size of the standard is determined by the width of the standard itself and the size of the hole. The material is determined by the number of holes. Titanium — one hole, iron — two holes, nickel — three holes, copper — 4 holes.
Marking in accordance with Table 2 GOST 7512-82. Download poster
Marking in accordance with Table 3 GOST 7512-82. Download poster
Wire Gauges
Wire Gauges are seven wires of specific lengths and diameters packaged in a flexible transparent plastic case. In total, wire standards have four sizes: from the first to the fourth. The material and size of the standards is indicated by a marking located in the upper pocket of the case.
The diameter of each of the 7 wires corresponds to the value d prescribed in GOST 7512-82. The smaller the diameter of the wire, the more difficult it is to see it on an x-ray. Accordingly, the more wires you see, the higher the sensitivity of the control.
Gradation of wire standard diameters
From the point of view of GOST 7512-82, wire standards are equivalent to groove standards. But in fact, they have different degrees of detection. It is more difficult to get a certain sensitivity using a wire standard, since it is more difficult to see the wire than the groove. Accordingly, when using wire standards, the image quality should be higher.
The effort to get a higher quality image will be more: you will have to increase the focal length, switch to a higher contrast film and abandon fluorescent screens. All this will lead to an increase in exposure time.
The wire standard must be replaced if the plastic sheath is damaged or if corrosion is found on the wires.
Wire Gauge #12
Plate Gauge
Plate Gauges
A plate gauge is a plate with cylindrical holes of fixed shapes and sizes. Plate standards according to GOST 7512-82 have two holes: small and large. The sensitivity of the control is determined by the smallest hole that can be seen in the picture.
Form of plate standards. The large letter D denotes
the diameter of the large circle, the small d is the diameter of the small circle times the thickness.
Plate standards according to GOST 7512-82 are almost never used in practice due to the versatility of groove and wire standards.
1.2. Standards according to GOST ISO 17636-1–2017
GOST ISO 17636-1–2017 introduces the concept of an image quality indicator (IQI). According to this standard, wire and step standards can be used. They have other markings and other sizes than Russian ones. From the point of view of GOST ISO 17636-1-2017, wire standards are equivalent to plate standards.
On x-ray, the sensitivity must correspond to one of the two control classes: A and B. The listing is from worst to best — ascending. A — the main method of control, class B — improved. But even class A is more demanding than the 1st sensitivity class according to GOST 7512-82.
The material and size of the standards are indicated by alphanumeric designation using markings on the top of the plastic case. The first number indicates the minimum number of wire or hole in the standard. Next are two letters indicating the material, for example Fe — iron. The last three letters indicate the standard.
Wire standards
The diameter of each of the 7 wires corresponds to the value d prescribed in ISO 19232-1, which is referred to by GOST ISO 17636-1-2017. The smaller the diameter of the wire, the more difficult it is to see it on an x-ray. Accordingly, the more wires you see, the higher the sensitivity of the control.
Wire Gauge Diameter Grading
Wire gauges must be replaced if corrosion is found on the wires or if the plastic sheath is damaged.
Titanium wire gauge
Step gauge A13 FE EN.
ISO and EN markings identical
Step Gauges
Step Gauge is a plate with six steps with cylindrical holes. established shapes and sizes. The sensitivity of the control is determined by the smallest visible hole or pair of holes.
Schematic step standard
Step standards H5 FE EN and H9 FE EN
2. How to work with
standards
Both GOSTs prescribe to place standards from the X-ray side. GOST 7512-82 states: «Sensitivity standards should be installed in the controlled area from the side facing the radiation source.» It is echoed by GOST ISO 17636-1-2017: «IQI should be placed on the surface of the object of control from the side of the radiation source…».
In some cases, it is not advisable to place the standard on the side of the radiation source. Firstly, when checking through two walls, the standard located on the side of the apparatus will be significantly enlarged and blurred in the image.
The groove gauge is enlarged and blurred due to its location on the side of the radiation source
Secondly, it is difficult to place the gauge inside the pipe during panoramic control. The crawler allows you to center the device inside the pipe and deliver it a couple of kilometers to the place of control. It is difficult to crawl such a distance along the pipe and fix the standard from the inside.
The universal way is to place the standard in the film cassette. Both documents allow this. GOST ISO 17636-1-2017: «If IQI cannot be placed on the side of the radiation source, then they are placed on the side of the film.» GOST 7512-82: “If it is impossible to set standards from the source side … it is allowed to install sensitivity standards from the side of the film cassette.”
When placing the standards together with the film, behind the object of control, you can play it safe. To do this, during the inspection, you need to see one groove / wire / step more than required. But all this is at the discretion of the flaw detectorist, or the one who sets the task for him.
X-ray film cassette
with reference pockets
2.1. Work with standards according to GOST 7512-82
The choice of standard size begins with the determination of the radiation thickness. It consists of the thickness of the object in the direction of transillumination, including the reinforcement bead. Further, according to the GOST 7512-82 table, based on the translucent thickness and the required sensitivity class, we determine the sensitivity of the control.
The reference must have grooves/wires/holes with dimensions appropriate to the sensitivity. For example, when testing a pipe with a wall thickness of 5 mm, it is necessary to take standard No. 1 with element sizes from 0.10 to 0.60 mm. If we take standard No. 3 with element sizes from 1.5 to 4 mm, then this standard will not allow us to determine the image quality class, because the obtained values exceed the required requirements.
Photograph of a 720 mm pipe made using a #11 groove gauge.
Groove standards
Depending on the test object, there are two positions of the groove standard relative to the weld. Typically, the standard is placed at a distance of at least 5 mm from the seam with the direction of the grooves across the seam. And when checking the circumferential seams of pipelines with a diameter of less than 100 mm, it is allowed to install the standard at a distance of at least 5 mm from the seam with the direction of the grooves along the seam.
To determine the sensitivity of the control, we must identify the smallest depth of the groove in the image. For example, let’s illuminate a pipe with a wall thickness of 10 mm. In the picture, we will see, for example, 6 grooves out of 6. Using the GOST table, we will determine the sensitivity of the control.
- We know the reference number, for example — 1. We take the smallest groove that we see — 6.
 We look at the size table (tab. 2) — it corresponds to the depth of the groove h6. The value is 0.10.
 - In the second table, select a row according to the thickness of the control object. 10 mm fall into the category with values over 9 mm to 12 mm inclusive. The resulting value of the sensitivity of our image corresponds to the 1st sensitivity class.
How to determine the sensitivity of
when working with groove standards
The image of the pipe was taken using a #12 wire standard.
Wire Gauges
In order to determine the sensitivity of the control, we must identify the smallest wire in the image. To do this, we place a standard with the direction of the wires across the seam on a pipe with a diameter of 720. The wall thickness is the same — 10 mm. In the picture, we will see, for example, 3 wires out of 7. Using the GOST table, we will determine the sensitivity of the control.
- We know the standard number, for example — 12 (the first digit is the material, the second is the standard number). We take the smallest wire that we see — 3. We look at the size table (tab. 2) — it corresponds to the groove depth d3. The value is 0.25.
- In the table of sensitivity classes (Table 6), select a line in accordance with the thickness of the test object. 10 mm fall into the category with values over 9 mm to 12 mm inclusive. The resulting sensitivity value of our image corresponds to sensitivity class 2. The value of 0.25 belongs to the second sensitivity class with a threshold up to 0.30, since the first class values of 0.20 have already been exceeded.
How to determine the
sensitivity when working with wire standards
Plate sensitivity standards are rarely used. We failed to find a real picture,
so we used Photoshop to illustrate the reference No. 12
Plate standards
Plate standards are placed along the seam at a distance of at least 5 mm from it or directly on the seam with the direction of the standard across the seam so that images of markings of the standard were not superimposed on the image of the seam in the picture.
To determine the sensitivity of the control, we must identify the smallest hole in the image. The object of control is the same — a pipe with a diameter of 720 mm and a wall thickness of 10 mm.
- We know the standard number, for example — 12 (the first digit is the material, the second is the standard number). Let’s say we see both holes. In the size table, we look at the size of the small hole for this standard — 0.2.
- In the table of sensitivity classes (Table 6), select a line in accordance with the thickness of the test object. 10 mm fall into the category with values over 9up to 12 mm inclusive. The resulting sensitivity value of our image corresponds to sensitivity class 1.
How to determine the sensitivity of
when working with plate standards
2.2. Work with standards according to GOST ISO 17636-1-2017
The choice of standard size depends on the nominal thickness in the case of 1-wall testing or the translucent thickness in the case of 2-wall testing. It consists of the thickness of the object in the direction of transillumination, including the reinforcement bead. Further, in Appendix B, we select a table corresponding to the control scheme, the type of standard, its position and quality class. Further, according to the table, we determine the number of the wire or hole. Select an IQI containing a wire or hole with that number.
Photograph with wire gauge 10 FE EN. ISO and EN markings are identical
Wire standards
When using the wire type IQI, the wires must be perpendicular to the weld. At the same time, at least 10 mm of the wire length should be visible in the area with a uniform optical density, which usually occurs on the base metal adjacent to the weld.
- Let us give the control conditions. The object is a pipe with a diameter of 720 mm and a wall thickness of 10 mm. When checking through two walls, the translucent thickness will be twice as large, that is, 20 mm. Plus 1 mm on the reinforcement roller.
 Quality class — A. The standard is placed on the side of the film. The exposure was carried out through two walls.
 - Look at table B.9. For a given thickness, it is required to identify wire number W 12. We know the number of the standard — W 10. We see 6 wires out of 7. So the control sensitivity turned out to be W 15. We see wire W 12, which means it is better than the required sensitivity.
Table B9. How to determine sensitivity when using
with
wire standards
ISO and EN marked standards are the same as
Step standards
When using a stepped IQI with holes, it must be positioned so that the hole of the required size is located as close to the weld as possible. In the case of a stepped hole type IQI, if there are two holes with the same diameter, both must be distinguishable for the step to be considered visible.
See table B.10. For a given thickness, it is required to identify a hole number H 7. We know the standard number — H 6. We see 4 steps with holes out of 6. So the control sensitivity turned out to be H 8. We do not see holes on the step H 7, therefore, we have not achieved the desired quality . You will have to use the same reference, but with different exposure settings.
- Let’s give the control conditions. The object is a pipe with a diameter of 720 and a wall thickness of 10 mm. Quality class — A. The standard is located on the side of the film. The control was carried out through two walls.
- Look at table B.10. For a given thickness, it is required to identify a hole number H 7. We know the number of the standard — H 6. We see 4 steps with holes out of 6. So the sensitivity of the control turned out to be H 8. We do not see a hole on the step H 7, therefore, we have not achieved the desired quality . You will have to use the same reference, but with different exposure settings.
Table B10. How to determine the sensitivity when working with
step standards
3.
 Standards for digital and computed radiography systems
Two-wire standard according to GOST ISO 17636-2-2017
To determine the image quality using digital systems and computer radiography according to GOST ISO 17636-2-2017, special two-wire standards are produced. It is a Plexiglas plate with pairs of platinum wires soldered into it.
From pair to pair of wires with the same diameter, the diameter decreases. We need to determine whether we can distinguish between two adjacent wires or not. This will characterize the quality of the final image of the system itself.
Profiled reference
4. Metrological support of standards
Previously, all standards were only calibrated. The actual dimensions of grooves and wires were measured. No one thought about entering into the State Register. But recently standards with verification have appeared. The calibration interval is 5 years, one of the largest in the field of non-destructive testing.
Project — TiC-VLM. IPG Photonics VLM Series CW Titanium Sapphire Laser with Integrated Pump Laser
CW wide tuning range CW titanium sapphire laser, IPG Photonics VLM series integrated pump laser version.
SpecificationsDescriptionOptionsFAQ ApplicationsVideo
| CW TiS TiC Inflated IPG VLM | ||
| Pump laser power | Power output TiC | Output power TiC (fiber output) |
| 10 W | 2000 mW at 800 nm | >1300 mW at 800 nm |
| Tuning range | 700 nm — 1000 nm | |
| Generation linewidth 92 <1.2) | ||
| Beam diameter (by level 1/e 2 ) | <2 mm | |
| Output beam polarization | linear, horizontal, 100:1 | |
| Beam Divergence | <1 mrad | |
| Long-term stability 1 ) | 1% RMS | |
| Noise 3 ) | 5% RMS | |
| Dimensions (L x W x H) | ||
| Optical unit dimensions | 427 × 300 × 129 mm | |
| Built-in pump laser control unit | 325 x 217 x 43 mm | |
| Chiller | 430 x 340 x 190 mm | |
| Room and power requirements | ||
| Air temperature | 15-30°C | |
| Relative humidity | <60% non-condensing | |
| Voltage | Single phase; variable, 100-240 V; 50/60 Hz | |
| Power input | <2. 0 kVA 0 kVA |
|
| Required heat output | ||
| From pump control unit | Up to 250 W | |
| From optical unit | Up to 200 W | |
| Factory available system options 2) | ||
| Heat stabilized one-piece body | included with any package | |
| Equipment » Manual » | — pump laser control via RS-232 interface — Lyot birefringence filter driven by manual micrometer screw — one or two manual references (optional) |
|
| Basic (default) |
— pump laser control via RS-232 interface — Lyot birefringence filter driven by a stepper motor — one or two references with manual drives, optionally with stepper motor drives — wavelength tuning with a wired remote control — basic version of the Windows software that allows you to remotely control the laser wavelength |
|
| Auto package | — pump laser control via RS-232 interface — birefringent Lyot filter driven by a stepper motor — one or two standards with manual drives, optionally with stepper motor drives — built-in spectrometer — built-in output power meter — control of the birefringent filter and optional references from a PC — full version of the software for Windows, which combines the control of laser parameters and the possibility of tuning in one click |
|
1) – cold start recovery, 30 min operation followed by 12 hours of continuous operation under the same ambient conditions using the supplied/recommended chiller with sufficient capacity. 2) – please specify the desired equipment when enquiring; other combinations of parameters and elements of the system are possible upon request. 3) — measurement bandwidth from 10 Hz to 10 MHz; |
||
TiC- The VLM is a version of the TiC CW TiC laser using an integrated pump laser from IPG Photonics’ VLM series. The main advantage of this model is the high average output power of TiC at its low specific cost due to the use of a highly efficient fiber pump laser. The reviewed version of TiC has the same tuning range as a similar model pumped in the form of a green DPSS laser, a similar set of options and a comparable linewidth, but the short-term stability of the average power is slightly lower. Another difference between the TiC-VLM system and a CW TiC laser pumped by a DPSS laser is a different cooling system configuration: the pumping control unit requires forced water cooling, which is realized by using a branched cooling circuit and a chiller with a higher cooling capacity. This model is the most affordable high power titanium-sapphire laser, and it is also available in one of three standard configurations: Auto, Basic or Manual. Each of these versions is based on a monolithic thermally stabilized case, in which one or two standards can optionally be installed, narrowing the generation linewidth to 40 GHz and to 2 GHz, respectively. In addition, each of the three versions can be equipped with an additional module for outputting radiation into a single-mode optical fiber with an FC standard connector. The Auto version of the is, like the standard TiC series laser, the most automated. It contains a built-in electronics unit that implements the functions of remote control of the wavelength, monitoring of laser parameters, as well as an integrated optical power meter and spectrometer. This version of the laser works on the ‘Hands Free’ principle and requires connection to a personal computer via two USB interfaces (or one USB and RS-232 interface) to control the pump laser and directly the titanium-sapphire laser.
 Accordingly, the system is accompanied by two software packages for independent control of the laser and its pumping. The control program for a titanium-sapphire laser allows you to control its current parameters in real time and control the tuning of the radiation wavelength in one click.
In the “Basic” version of the TiC-VLM, wavelength tuning can be performed by the operator using a wired control panel or a computer and a simplified version of the TiC laser control program (software). The «basic» version of the laser does not have a built-in spectrometer and power meter. Despite this, the software used by this version provides the ability to store in the laser’s memory the calibration values for the wavelength of the radiation produced using the user’s external spectrometer. In the future, the current wavelength of laser radiation displayed on the computer screen is automatically determined by the calibrated position of the moving elements in the laser cavity. This version is also equipped with a pump laser control program, which requires the use of a PC with one free USB or RS-232 interface. «Manual» version of TiC-VLM also includes software for remote control of the pump laser, but excludes the possibility of connecting the titanium-sapphire laser to a personal computer: the radiation wavelength is controlled manually by the operator using micrometer screws that adjust the orientation of the spectral-selective laser elements. In this version, there is no built-in spectrometer, power meter, or any electronics in the titanium-sapphire part of the system. The «manual» version thus requires only the power supply of the pump laser, while the titanium-sapphire part is completely passive in terms of power supply. .
Options for CW Ti/sapphire laser with external pump laser.
• Single standard or pair of standards on manual micrometric feeds.
• One standard or pair of standards with motorized feeds.
• The pump laser polarization rotator installed inside the laser.
• Kit for installation of an external pump laser: set of dust tubes with holders,
completely covers the path of the pump beam.
• Winding mirrors with stands and frames for pumping laser.
• Mirror periscope for pump laser radiation without rotation of the polarization plane.
• Mirrored periscope with 90 degree polarization rotation.
• Extra/custom length coolant hoses.
• Hull purge hoses.
• System for cleaning and drying the interior of the laser head.
• Height adjustable laser feet.
• Computer (laptop/tablet) with pre-installed software (only for Auto version).
CW Ti/sapphire options with built-in pump laser.
• Single standard or pair of standards on manual micrometric feeds.
• One standard or pair of standards with motorized feeds.
• Additional flip-mounted mirror integrated into the laser housing for
to allow the pump laser to be output from the TiC laser head.
• Extra/custom length coolant hoses (on request).
• Hull purge hoses.
• System for cleaning and drying the interior of the laser head.
• Stand for the pump laser control unit mounted on the optical table.
• Non-standard fixed length laser legs.
• Computer (laptop/tablet) with pre-installed software (only for Auto version).
Buying with this product:
• Spectrometer ASP-75
• Spectrometer ASP-150
• Spectrometer ASP-IR
• Faraday Isolator
• Laser attenuator.
• Dividing plates.
• A set of dielectric mirrors for the operating range of laser wavelengths.
• Optomechanical modulator
• Hex screwdriver set with stand.
• Protective screens.
• Beam stopper on stand.
Also recommended
News
07/28/2020
Our team of engineers has increased the output power of the TiF-100 series lasers to more than 3 watts at 800 nm, 80 MHz with a pulse width of less than 100 fs.