Intel Core i5-2400 vs Intel Core i7-3770: What is the difference?
32points
Intel Core i5-2400
42points
Intel Core i7-3770
Comparison winner
vs
64 facts in comparison
Intel Core i5-2400
Intel Core i7-3770
Why is Intel Core i5-2400 better than Intel Core i7-3770?
- 200MHz faster GPU clock speed?
850MHzvs650MHz
Why is Intel Core i7-3770 better than Intel Core i5-2400?
- 9.68% faster CPU speed?
4 x 3.4GHzvs4 x 3.1GHz - 267MHz higher ram speed?
1600MHzvs1333MHz - 4 more CPU threads?
8vs4 - 32.4°C higher maximum operating temperature?
105°Cvs72.6°C - 10nm smaller semiconductor size?
22nmvs32nm - 1.63x higher PassMark result?
9460vs5801 - 0.5GHz higher turbo clock speed?
3.9GHzvs3.4GHz
- 18W lower TDP?
77Wvs95W
Which are the most popular comparisons?
Intel Core i5-2400
vs
Intel Core i5-3470
Intel Core i7-3770
vs
Intel Core i5-3470
Intel Core i5-2400
vs
Intel Core i3-6100
Intel Core i7-3770
vs
Intel Core i5-3570
Intel Core i5-2400
vs
Intel Core i3-3220
Intel Core i7-3770
vs
Intel Core i5-6500
Intel Core i5-2400
vs
Intel Core i3-4130
Intel Core i7-3770
vs
Intel Core i7-2600
Intel Core i5-2400
vs
Intel Core i7-2600
Intel Core i7-3770
vs
Intel Core i7-3770K
Intel Core i5-2400
vs
Intel Core i5-4570
Intel Core i7-3770
vs
Intel Core i7-3770S
Intel Core i5-2400
vs
Intel Core i3-10100
Intel Core i7-3770
vs
Intel Core i5-10400
Intel Core i5-2400
vs
Intel Core i3-3240
Intel Core i7-3770
vs
Intel Core i5-4570
Intel Core i5-2400
vs
Intel Core i5-3570
Intel Core i7-3770
vs
Intel Core i3-10100
Intel Core i7-3770
vs
Intel Core i5-7400
Price comparison
User reviews
Overall Rating
Intel Core i5-2400
3 User reviews
Intel Core i5-2400
5. 3/10
3/10
3 User reviews
Intel Core i7-3770
3 User reviews
Intel Core i7-3770
9.0/10
3 User reviews
Features
Value for money
6.7/10
3 votes
8.7/10
3 votes
Gaming
2.0/10
3 votes
9.0/10
3 votes
Performance
4.0/10
3 votes
10.0/10
3 votes
Reliability
4.7/10
3 votes
10.0/10
3 votes
Energy efficiency
5.0/10
3 votes
9.0/10
3 votes
Performance
1.CPU speed
4 x 3.1GHz
4 x 3.4GHz
The CPU speed indicates how many processing cycles per second can be executed by a CPU, considering all of its cores (processing units). It is calculated by adding the clock rates of each core or, in the case of multi-core processors employing different microarchitectures, of each group of cores.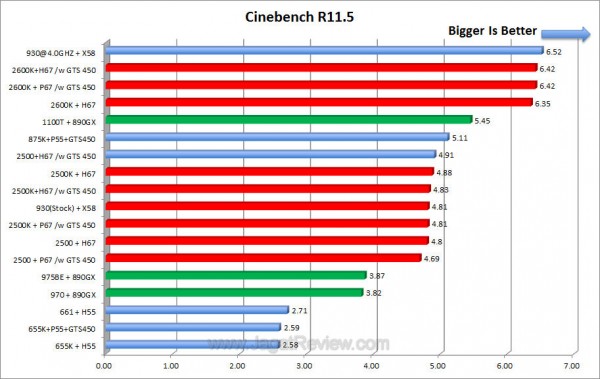
2.CPU threads
More threads result in faster performance and better multitasking.
3.turbo clock speed
3.4GHz
3.9GHz
When the CPU is running below its limitations, it can boost to a higher clock speed in order to give increased performance.
4.Has an unlocked multiplier
✖Intel Core i5-2400
✖Intel Core i7-3770
Some processors come with an unlocked multiplier which makes them easy to overclock, allowing you to gain increased performance in games and other apps.
5.L2 cache
A larger L2 cache results in faster CPU and system-wide performance.
6.L3 cache
A larger L3 cache results in faster CPU and system-wide performance.
7.L1 cache
A larger L1 cache results in faster CPU and system-wide performance.
8. L2 core
0.25MB/core
0.25MB/core
More data can be stored in the L2 cache for access by each core of the CPU.
9.L3 core
1.5MB/core
2MB/core
More data can be stored in the L3 cache for access by each core of the CPU.
Memory
1.RAM speed
1333MHz
1600MHz
It can support faster memory, which will give quicker system performance.
2.maximum memory bandwidth
21GB/s
25.6GB/s
This is the maximum rate that data can be read from or stored into memory.
3.DDR memory version
DDR (Double Data Rate) memory is the most common type of RAM. Newer versions of DDR memory support higher maximum speeds and are more energy-efficient.
4.memory channels
More memory channels increases the speed of data transfer between the memory and the CPU.
5. maximum memory amount
The maximum amount of memory (RAM) supported.
6.bus transfer rate
The bus is responsible for transferring data between different components of a computer or device.
7.Supports ECC memory
✖Intel Core i5-2400
✖Intel Core i7-3770
Error-correcting code memory can detect and correct data corruption. It is used when is it essential to avoid corruption, such as scientific computing or when running a server.
8.eMMC version
Unknown. Help us by suggesting a value. (Intel Core i5-2400)
Unknown. Help us by suggesting a value. (Intel Core i7-3770)
A higher version of eMMC allows faster memory interfaces, having a positive effect on the performance of a device. For example, when transferring files from your computer to the internal storage over USB.
9.bus speed
Unknown. Help us by suggesting a value. (Intel Core i5-2400)
Unknown. Help us by suggesting a value. (Intel Core i7-3770)
The bus is responsible for transferring data between different components of a computer or device.
Benchmarks
1.PassMark result
This benchmark measures the performance of the CPU using multiple threads.
2.PassMark result (single)
This benchmark measures the performance of the CPU using a single thread.
3.Geekbench 5 result (multi)
Geekbench 5 is a cross-platform benchmark that measures a processor’s multi-core performance. (Source: Primate Labs, 2022)
4.Cinebench R20 (multi) result
Unknown. Help us by suggesting a value. (Intel Core i5-2400)
Cinebench R20 is a benchmark tool that measures a CPU’s multi-core performance by rendering a 3D scene.
5.Cinebench R20 (single) result
Unknown.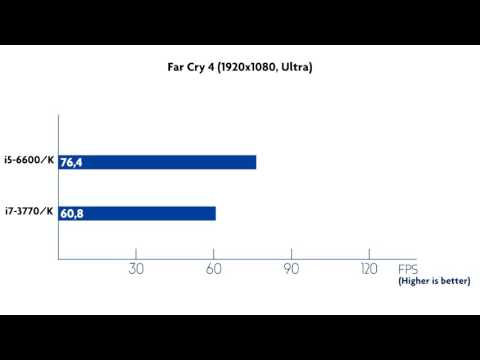 Help us by suggesting a value. (Intel Core i5-2400)
Cinebench R20 is a benchmark tool that measures a CPU’s single-core performance by rendering a 3D scene.
6.Geekbench 5 result (single)
Geekbench 5 is a cross-platform benchmark that measures a processor’s single-core performance. (Source: Primate Labs, 2022)
7.Blender (bmw27) result
Unknown. Help us by suggesting a value. (Intel Core i5-2400)
Unknown. Help us by suggesting a value. (Intel Core i7-3770)
The Blender (bmw27) benchmark measures the performance of a processor by rendering a 3D scene. More powerful processors can render the scene in less time.
8.Blender (classroom) result
Unknown. Help us by suggesting a value. (Intel Core i5-2400)
Unknown. Help us by suggesting a value. (Intel Core i7-3770)
The Blender (classroom) benchmark measures the performance of a processor by rendering a 3D scene. More powerful processors can render the scene in less time.
9.performance per watt
This means the CPU is more efficient, giving a greater amount of performance for each watt of power used.
Features
1.uses multithreading
✖Intel Core i5-2400
✔Intel Core i7-3770
Multithreading technology (such as Intel’s Hyperthreading or AMD’s Simultaneous Multithreading) provides increased performance by splitting each of the processor’s physical cores into virtual cores, also known as threads. This way, each core can run two instruction streams at once.
2.Has AES
✔Intel Core i5-2400
✔Intel Core i7-3770
AES is used to speed up encryption and decryption.
3.Has AVX
✔Intel Core i5-2400
✔Intel Core i7-3770
AVX is used to help speed up calculations in multimedia, scientific and financial apps, as well as improving Linux RAID software performance.
4.SSE version
SSE is used to speed up multimedia tasks such as editing an image or adjusting audio volume. Each new version contains new instructions and improvements.
5.Has F16C
✖Intel Core i5-2400
✔Intel Core i7-3770
F16C is used to speed up tasks such as adjusting the contrast of an image or adjusting volume.
6.bits executed at a time
Unknown. Help us by suggesting a value. (Intel Core i5-2400)
Unknown. Help us by suggesting a value. (Intel Core i7-3770)
NEON provides acceleration for media processing, such as listening to MP3s.
7.Has MMX
✔Intel Core i5-2400
✔Intel Core i7-3770
MMX is used to speed up tasks such as adjusting the contrast of an image or adjusting volume.
8.Has TrustZone
✖Intel Core i5-2400
✖Intel Core i7-3770
A technology integrated into the processor to secure the device for use with features such as mobile payments and streaming video using digital rights management (DRM).
9.front-end width
Unknown. Help us by suggesting a value. (Intel Core i5-2400)
Unknown. Help us by suggesting a value. (Intel Core i7-3770)
The CPU can decode more instructions per clock (IPC), meaning that the CPU performs better
Price comparison
Cancel
Which are the best CPUs?
Intel Core i5-2400 vs Intel Core i7-3770
Summary
-
Intel Core i5-2400
100%
-
Intel Core i7-3770
136%
Relative performance
-
Intel Core i5-2400
100%
-
Intel Core i7-3770
122%
Relative performance
-
Intel Core i5-2400
100%
-
Intel Core i7-3770
149%
Relative performance
Reasons to consider Intel Core i5-2400 |
| None |
Reasons to consider Intel Core i7-3770 |
Much higher single threaded performance (around 22% higher), makes a noticeable performance difference in gaming and the majority of applications. |
| Much higher multi threaded performance (around 49% higher). This allows for higher performance in professional applications like encoding or heavy multitasking. |
| This is a newer product, it might have better application compatibility/performance (check features chart below). |
| Around 36% higher average synthetic performance. |
Gaming
HWBench recommends Intel Core i7-3770
Based on game and synthetic benchmarks, and theoretical specifications.
Productivity
HWBench recommends Intel Core i7-3770
Based on productivity benchmarks, overall multithreaded performance and theoretical specifications.
Features
| Intel Core i5-2400 | Intel Core i7-3770 | |||
|---|---|---|---|---|
| MMX | ||||
| SSE | ||||
| SSE2 | ||||
| SSE3 | ||||
| SSSE3 | ||||
SSE4. 2 2 |
||||
| AVX | ||||
| EIST | ||||
| Intel 64 | ||||
| XD bit | ||||
| TXT | ||||
| VT-x | ||||
| VT-d | ||||
| AES-NI | ||||
| Hyper-Threading | ||||
Architecture
| Intel Core i5-2400 | Intel Core i7-3770 | |||
|---|---|---|---|---|
| Architecture | Intel_SandyBridge | vs | Intel_IvyBridge | |
| Market | Desktop | vs | Desktop | |
| Memory Support | DDR3 | vs | DDR3 | |
| Codename | Sandy Bridge | vs | Ivy Bridge | |
| Release Date | Jan 2011 | vs | Apr 2012 |
Cores
| Intel Core i5-2400 | Intel Core i7-3770 | |||
|---|---|---|---|---|
| Cores | 4 | vs | 4 | |
| Threads | 4 | vs | 8 | |
| SMPs | 1 | vs | 1 | |
| Integrated Graphics | Intel HD 2000 | vs | Intel HD 4000 |
Cache
| Intel Core i5-2400 | Intel Core i7-3770 | |||
|---|---|---|---|---|
| L1 Cache | 64 KB (per core) | vs | 64 KB (per core) | |
| L2 Cache | 256 KB (per core) | vs | 256 KB (per core) | |
| L3 Cache | 6144 KB (shared) | vs | 8192 KB (shared) |
Physical
| Intel Core i5-2400 | Intel Core i7-3770 | |||
|---|---|---|---|---|
| Socket | Intel Socket 1155 | vs | Intel Socket 1155 | |
| Max Case Temp | unknown | vs | 67°C | |
| Package | FC-LGA10 | vs | FC-LGA12C | |
| Die Size | 216mm² | vs | 160mm² | |
| Process | 32 nm | vs | 22 nm |
Performance
| Intel Core i5-2400 | Intel Core i7-3770 | |||
|---|---|---|---|---|
| Cpu Frequency | 3100 MHz | vs | 3400 MHz | |
| Turbo Clock | 3400 MHz | vs | 3900 MHz | |
| Base Clock | 100 MHz | vs | 100 MHz | |
| Voltage | unknown | vs | unknown | |
| TDP | 95 W | vs | 77 W |
-
Intel Core i5-2400
3400 points
-
Intel Core i7-3770
4017 points
Points — higher is better
-
Intel Core i5-2400
12400 points
-
Intel Core i7-3770
16809 points
Points — higher is better
-
Intel Core i5-2400
8204
-
Intel Core i7-3770
12469
points — higher is better
-
Intel Core i5-2400
2812
-
Intel Core i7-3770
3453
points — higher is better
-
Intel Core i5-2400
8872
-
Intel Core i7-3770
13338
points — higher is better
-
Intel Core i5-2400
2633
-
Intel Core i7-3770
3188
points — higher is better
-
Intel Core i5-2400 (simulated)
112.
 11
11 -
Intel Core i7-3770 (simulated)
139
points — higher is better
-
Intel Core i5-2400 (simulated)
441.52
-
Intel Core i7-3770 (simulated)
647.94
points — higher is better
i5-2400 vs i7-3770 — Fortnite Battle Royale with GTX 1650 Benchmarks 1080p, 1440p, Ultrawide, 4K Comparison
GTX 1650 with
Intel Core i5-2400 @ 3.10GHz
Fortnite Battle Royale
GTX 1650 with
Intel Core i7-3770 @ 3.40GHz
i5-2400
i7-3770
Multi-Thread Performance
5953 Pts
9293 Pts
Single-Thread Performance
1747 Pts
2068 Pts
Fortnite Battle Royale
i5-2400 vs i7-3770 in Fortnite Battle Royale using GTX 1650 — CPU Performance comparison at Ultra, High, Medium, and Low Quality Settings with 1080p, 1440p, Ultrawide, 4K resolutions
i5-2400
i7-3770
Ultra Quality
| Resolution | Frames Per Second |
|---|---|
| 1080p |
36. |
| 1080p |
44.6 FPS |
| 1440p |
23.6 FPS |
| 1440p |
28.7 FPS |
| 2160p |
13.1 FPS |
| 2160p |
15.9 FPS |
| w1440p |
19.6 FPS |
| w1440p |
23.9 FPS |
 7 FPS
7 FPSHigh Quality
| Resolution | Frames Per Second |
|---|---|
| 1080p |
67.0 FPS |
| 1080p |
79.3 FPS |
| 1440p |
45.7 FPS |
| 1440p |
54.2 FPS |
| 2160p |
27.3 FPS |
| 2160p |
32.4 FPS |
| w1440p |
38.9 FPS |
| w1440p |
46.2 FPS |
Medium Quality
| Resolution | Frames Per Second |
|---|---|
| 1080p |
97. |
| 1080p |
114.0 FPS |
| 1440p |
67.8 FPS |
| 1440p |
79.7 FPS |
| 2160p |
41.5 FPS |
| 2160p |
48.8 FPS |
| w1440p |
58.1 FPS |
| w1440p |
68.5 FPS |
 3 FPS
3 FPSLow Quality
| Resolution | Frames Per Second |
|---|---|
| 1080p |
158.0 FPS |
| 1080p |
183.3 FPS |
| 1440p |
112.0 FPS |
| 1440p |
130.6 FPS |
| 2160p |
69.9 FPS |
| 2160p |
81.7 FPS |
| w1440p |
96.7 FPS |
| w1440p |
113.1 FPS |
i5-2400
i7-3770
Compare i5-2400 vs i7-3770 specifications
Share Your Comments 0
Compare i5-2400 vs i7-3770 in more games
Elden Ring
2022
God of War
2022
Overwatch 2
2022
Forza Horizon 5
2021
Halo Infinite
2021
Battlefield 2042
2021
Assassin’s Creed Valhalla
2020
Microsoft Flight Simulator
2020
Valorant
2020
Call of Duty: Black Ops Cold War
2020
Death Stranding
2020
Marvel’s Avengers
2020
Godfall
2020
Cyberpunk 2077
2020
Apex Legends
2019
Anthem
2019
Far Cry New Dawn
2019
Resident Evil 2
2019
Metro Exodus
2019
World War Z
2019
Gears of War 5
2019
F1 2019
2019
GreedFall
2019
Borderlands 3
2019
Call of Duty Modern Warfare
2019
Red Dead Redemption 2
2019
Need For Speed: Heat
2019
Assassin’s Creed Odyssey
2018
Battlefield V
2018
Call of Duty: Black Ops 4
2018
Final Fantasy XV
2018
Shadow of the Tomb Raider
2018
Forza Horizon 4
2018
Fallout 76
2018
Hitman 2
2018
Just Cause 4
2018
Monster Hunter: World
2018
Strange Brigade
2018
Assassin’s Creed Origins
2017
Dawn of War III
2017
Ghost Recon Wildlands
2017
Destiny 2
2017
PlayerUnknown’s Battlegrounds
2017
Fortnite Battle Royale
2017
Need For Speed: Payback
2017
For Honor
2017
Project CARS 2
2017
Forza Motorsport 7
2017
Ashes of the Singularity
2016
Ashes of the Singularity: Escalation
2016
Battlefield 1
2016
Deus Ex: Mankind Divided
2016
Doom
2016
F1 2016
2016
Hitman
2016
Rise of the Tomb Raider
2016
The Division
2016
Total War: Warhammer
2016
Overwatch
2016
Dishonored 2
2016
DiRT Rally
2015
Grand Theft Auto V
2015
The Witcher 3
2015
Rocket League
2015
Need For Speed
2015
Project CARS
2015
Rainbow Six Siege
2015
Battlefield 4
2013
Crysis 3
2013
Counter-Strike: Global Offensive
2012
League of Legends
2009
Minecraft
2009
Intel Core i7-3770 vs Intel Core i5-2400 Comparison
VS
Intel Core i7-3770
Buy on Amazon
Intel Core i5-2400
Buy on Amazon
- Key Differences
- Performance
- Features
- Miscellaneous
- General info
- Memory
- Benchmarks
Intel Core i7-3770
Intel Core i5-2400
| Cores | 4 | 4 |
| CPU Threads | 8 | 4 |
| Base Clock Speed | 3. 4GHz 4GHz |
3.1GHz |
| Turbo Clock Speed | 3.9GHz | 3.4GHz |
| TDP (THERMAL DESIGN POINT) | 77W | 95W |
| Has integrated graphics | Yes | Yes |
| Performance per watt | 148. 0 0 |
80.0 |
| CPU Speed & Cores | 4 x 3.4GHz | 4 x 3. 1GHz 1GHz |
| Number of CPU Threads | 8 | 4 |
| L2 Cache Size | 1MB | 1MB |
| L3 Cache Size | 8MB | 6MB |
| Turbo Boost Frequency | 3. 9GHz 9GHz |
3.4GHz |
| L1 Cache Size | 256KB | 256KB |
| L2 Core | 0. 25MB/core 25MB/core |
0.25MB/core |
| L3 Core | 2MB/core | 1. 5MB/core 5MB/core |
| Clock Multiplier | 34 | 31 |
| Does it have an unlocked multiplier | No | No |
Uses ARM big. LITTLE tech LITTLE tech |
No | No |
| Uses ARM HMP | No | No |
| Has AES Support | Yes | Yes |
| Supports CPU Throttling | Yes | Yes |
| Supported SSE Version | 4. 2 2 |
4.2 |
| Has AVX Support | Yes | Yes |
| Has MMX Tech Support | Yes | Yes |
| Has F16C Support | Yes | No |
| Has Multithreading Tech Support | Yes | No |
| Has NX Processor Bit Support | Yes | Yes |
| Supports ARM TrustZone Tech | No | No |
| Has FMA4 Instructions Support | No | No |
| Has FMA3 Instructions Support | No | No |
| Geekbench Score | 11417 | 7601 |
Cinebench 11. 5 Score 5 Score |
7.51 | 5.07 |
| SysMark 2012 Score | 223 | 169 |
| CPU Data Work Score | 261 | 189 |
Cinebench 11. 5 Score (Single Thread) 5 Score (Single Thread) |
1.65 | 1.37 |
| Media Creation Score | 208 | 161 |
| Web Dev Score | 234 | 174 |
| 3D Modelling Score | 255 | 172 |
| Office Productivity Score | 191 | 151 |
| System Management Score | 197 | 170 |
| Height | 37. 5mm 5mm |
37.5mm |
| Width Size | 37. 5mm 5mm |
37.5mm |
| RAM Memory Speed | 1600MHz | 1333MHz |
| Max Memory Bandwidth | 25. 6GB/s 6GB/s |
21GB/s |
| Max Memory Channels | 2 | 2 |
| Supported Memory Size | 32GB | 32GB |
| Bus Bandwidth | 5GT/s | 5GT/s |
| ECC (Error-Correcting Code) Memory Support | No | No |
| PassMark Score | 9460 | 5801 |
| PassMark Score (Single Thread) | 2073 | 1714 |
| PassMark Score (Overclocked) | 10410 | 6743 |
| CPU Performance (Per Watt) | 148. 0 0 |
80.0 |
| Power Consumption Under High Load | Not Known | 115. 2W 2W |
Similar Comparisons
Intel Core i5-2400 vs Intel Core i7-3770
|
|
|
|
|
Intel Core i5-2400 vs Intel Core i7-3770
Comparaison des caractéristiques techniques entre les processeurs, avec le Intel Core i5-2400 d’un côté et le Intel Core i7-3770 de l’autre. Le premier est dédié au secteur ordinateur de bureau, il dispose de 4 coeurs, 4 threads, une fréquence maximale de 3,4 GHz. Le second est employé sur le segment ordinateur de bureau, il possède un total de 4 coeurs, 8 threads, sa fréquence turbo s’établit à 3,9 GHz. Le tableau suivant permet aussi de comparer la lithographie, le nombre de transistors (si indiqué), la quantité de mémoire cache, la capacité maximale de mémoire RAM, le type de mémoire accepté, la date de première diffusion, le nombre maximal de lignes PCIe, les valeurs obtenues dans Geekbench 4 et Cinebench R15.
Remarque: des commissions peuvent être gagnées à partir des liens ci-dessus.
Cette page contient des références aux produits d’un ou de plusieurs de nos annonceurs. Nous pouvons recevoir une compensation lorsque vous cliquez sur des liens vers ces produits. Pour une explication de notre politique publicitaire, veuillez visiter cette page.
Caractéristiques :
| Processeur | Intel Core i5-2400 | Intel Core i7-3770 | ||||||
| Marché (principal) | Ordinateur de bureau | Ordinateur de bureau | ||||||
| ISA | x86-64 (64 bit) | x86-64 (64 bit) | ||||||
| Microarchitecture | Sandy Bridge | Ivy Bridge | ||||||
| Famille | Core i5-2000 | Core i7-3000 | ||||||
| Numéro(s) de pièce, S-Spec | BX80623I52400, BXC80623I52400, CM8062300834106, CM8062300834107, Q1ED, Q1HT, SR00Q |
BX80637I73770, BXC80637I73770, CM8063701211600, SR0PK |
||||||
| Date de lancement | Q1 2011 | Q2 2012 | ||||||
| Lithographie | 32 nm | 22 nm | ||||||
| Transistors | 1. 160.000.000 160.000.000 |
1.300.000.000 | ||||||
| Cœurs | 4 | 4 | ||||||
| Threads | 4 | 8 | ||||||
| Fréquence de base | 3,1 GHz | 3,4 GHz | ||||||
| Fréquence turbo | 3,4 GHz | 3,9 GHz | ||||||
| Vitesse du bus | 5 GT/s | 5 GT/s | ||||||
| Mémoire cache | 6 MB | 8 MB | ||||||
| Capacité mémoire maxi | 32 GB | 32 GB | ||||||
| Types de mémoire | DDR3 1066/1333 | DDR3 1333/1600 | ||||||
Nb. max. de canaux mémoire max. de canaux mémoire |
2 | 2 | ||||||
| Bande passante mémoire maxi | 21 GB/s | 25,6 GB/s | ||||||
| Lignes PCIe max | 16 | 16 | ||||||
| PDT | 95 W | 77 W | ||||||
| Alimentation système recommandée | Alimentation PC de 600W | Alimentation PC de 600W | ||||||
| GPU intégré | Intel HD Graphics 2000 | Intel HD Graphics 4000 | ||||||
| GPU, unités d’exécution | 6 | 16 | ||||||
| GPU, unités de calcul shader | 48 | 128 | ||||||
| GPU, cadence de base | 850 MHz | 650 MHz | ||||||
| GPU, cadence maxi | 1100 MHz | 1150 MHz | ||||||
| GPU, point flottant FP32 | 110,4 GFLOPS | 268,8 GFLOPS | ||||||
| Socket | LGA1155 | LGA1155 | ||||||
| Carte mère compatible | Carte mère Socket LGA 1155 | Carte mère Socket LGA 1155 | ||||||
| Température maximale | 72. 6°C 6°C |
105°C | ||||||
| CPU-Z simple thread | 308 | 385 | ||||||
| CPU-Z multi thread | 1.212 | 1.871 | ||||||
| Cinebench R15 simple thread | 119 | 134 | ||||||
| Cinebench R15 multi-thread | 421 | 663 | ||||||
| Cinebench R23 simple thread | 620 | 753 | ||||||
| Cinebench R23 multi-thread | 2.351 | 3.692 | ||||||
| PassMark simple thread | 1.567 | 2.062 | ||||||
| PassMark CPU Mark | 3.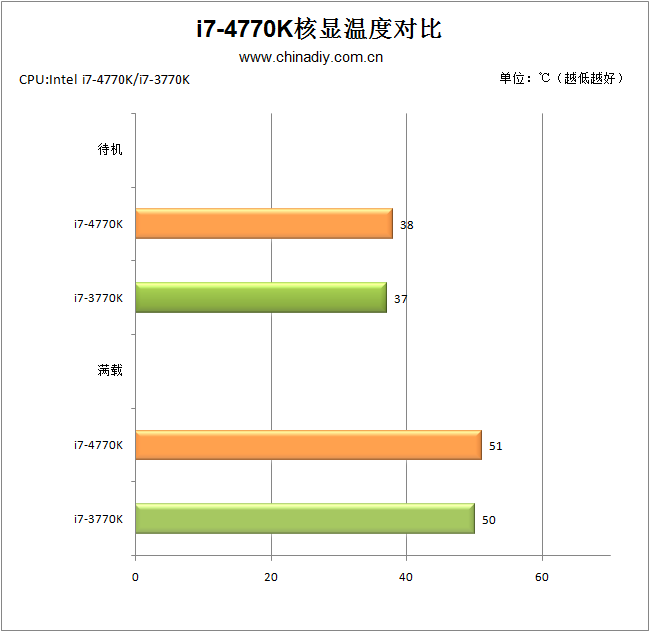 811 811 |
6.361 | ||||||
| (Windows 64-bit) Geekbench 4 simple cœur |
3.247 | 3.822 | ||||||
| (Windows 64-bit) Geekbench 4 multi-cœur |
9.282 | 12.687 | ||||||
| (SGEMM) Performance en GFLOPS |
139,74 GFLOPS | 164,7 GFLOPS | ||||||
| (Performance multi-cœur / watt) Rapport performance / watt |
98 pts / W | 165 pts / W | ||||||
| Amazon | ||||||||
| eBay |
Remarque: des commissions peuvent être gagnées à partir des liens ci-dessus.
On peut ainsi mieux comparer quelles sont les différences techniques entre les deux processeurs.
Alimentation système recommandée : on suppose que l’on possède une tour ATX, une carte graphique haut de gamme, 16GB de mémoire RAM, un disque SSD de 512GB, un disque dur HDD de 1TB, un lecteur Blu-Ray. Il faudra compter sur une alimentation plus puissante si on souhaite disposer de plusieurs cartes graphiques, plusieurs moniteurs, davantage de mémoire, etc.
Prix : pour des raisons techniques, nous ne pouvons pas afficher pour le moment un prix de moins de 24 heures, ou un prix en temps réel. C’est pourquoi on préfère pour l’instant ne pas faire apparaître de prix. Il faut vous référer aux boutiques en ligne respectives pour connaître le dernier prix, ainsi que la disponibilité.
On voit que les deux processeurs ont un nombre équivalents de cœurs, la fréquence turbo du Intel Core i7-3770 est plus grande, que la puissance de dissipation thermique du Intel Core i7-3770 est moindre. Le Intel Core i7-3770 a été lancé plus récemment.
Performances :
Comparaison des performances entre les deux processeurs, pour cela on considère les résultats générés sur des logiciels de benchmarks tels que Geekbench 4.
| CPU-Z — Score multi-thread & simple thread | |
|---|---|
| Intel Core i7-3770 |
385 1.871 |
| Intel Core i5-2400 |
308 1.212 |
En simple cœur, la différence est de 25%. En multi-cœurs, la différence en termes de gap est de 54%.
Remarque: des commissions peuvent être gagnées à partir des liens ci-dessus. Ces scores ne sont qu’une
moyenne des performances obtenues avec ces processeurs, vous pouvez obtenir des résultats différents.
CPU-Z est un logiciel d’information système qui fournit le nom du processeur, son numéro de modèle, le nom de code, les niveaux de cache, le package, le processus. Il peut également délivrer des données sur la carte mère, la mémoire. Il fait des mesures en temps réel, avec enfin un benchmark pour le simple thread, ainsi que pour le multi thread.
| Cinebench R15 — Score multi-thread & simple thread | |
|---|---|
| Intel Core i7-3770 |
134 663 |
| Intel Core i5-2400 |
119 421 |
En simple cœur, la différence est de 13%. En multi-cœurs, la différence en termes de gap est de 57%.
Remarque: des commissions peuvent être gagnées à partir des liens ci-dessus. Ces scores ne sont qu’une
moyenne des performances obtenues avec ces processeurs, vous pouvez obtenir des résultats différents.
Cinebench R15 permet d’évaluer les performances de calculs du CPU en restituant une scène 3D photoréaliste. La scène possède 2 000 objets, 300 000 polygones, utilise des reflets nets et flous, des zones lumineuses, des ombres, des shaders procéduraux, un antialiasing, etc. Plus le rendu de la scène est rapidement créée, plus le PC est puissant, avec un nombre élevé de points.
| Cinebench R23 — Score multi-thread & simple thread | |
|---|---|
| Intel Core i7-3770 |
753 3.692 |
| Intel Core i5-2400 |
620 2.351 |
En simple cœur, la différence est de 21%. En multi-cœurs, la différence en termes de gap est de 57%.
Remarque: des commissions peuvent être gagnées à partir des liens ci-dessus. Ces scores ne sont qu’une
moyenne des performances obtenues avec ces processeurs, vous pouvez obtenir des résultats différents.
Cinebench R23 est un logiciel de test multi-plateformes qui permet d’évaluer les capacités matérielles d’un appareil tel qu’un ordinateur, une tablette, un serveur. Cette version de Cinebench prend en compte les évolutions récentes des processeurs avec de multiples cœurs et les dernières améliorations de techniques de rendu. L’évaluation est au final encore plus pertinente. La scène de test contient pas moins de 2 000 objets et plus de 300 000 polygones au total.
| PassMark — CPU Mark & simple thread | |
|---|---|
| Intel Core i7-3770 |
2.062 6.361 |
| Intel Core i5-2400 |
1.567 3.811 |
En simple cœur, la différence est de 32%. En multi-cœurs, la différence en termes de gap est de 67%.
Remarque: des commissions peuvent être gagnées à partir des liens ci-dessus. Ces scores ne sont qu’une
moyenne des performances obtenues avec ces processeurs, vous pouvez obtenir des résultats différents.
PassMark est un logiciel de benchmarks, qui fait plusieurs tests de performance, notamment, sur les nombres premiers, les nombres entiers, la virgule flottante, la compression, la physique, les instructions étendues, l’encodage, le triage. Plus le score est élevé, plus l’appareil a des capacités importantes.
Sur Windows 64-bit :
| Geekbench 4 — Score multi-cœur & simple cœur — Windows 64-bit | |
|---|---|
| Intel Core i7-3770 |
3.822 12.687 |
| Intel Core i5-2400 |
3.247 9.282 |
En simple cœur, la différence est de 18%. En multi-cœurs, la différence en termes de gap est de 37%.
Sur Linux 64-bit :
| Geekbench 4 — Score multi-cœur & simple cœur — Linux 64-bit | |
|---|---|
| Intel Core i7-3770 |
3.539 10.146 |
| Intel Core i5-2400 |
3.425 9.109 |
En simple cœur, la différence est de 3%. En multi-cœurs, la différence en termes de gap est de 11%.
Sur Android 64-bit :
| Geekbench 4 — Score multi-cœur & simple cœur — Android 64-bit | |
|---|---|
| Intel Core i5-2400 |
2.961 8.591 |
| Intel Core i7-3770 |
1.622 2.710 |
En simple cœur, la différence est de 83%. En multi-cœurs, le gap différentiel est de 217%.
Sur Mac OS X 64-bit :
| Geekbench 4 — Score multi-cœur & simple cœur — Mac OS X 64-bit | |
|---|---|
| Intel Core i7-3770 |
3.881 12.905 |
| Intel Core i5-2400 |
3.040 8.635 |
En simple cœur, la différence est de 28%. En multi-cœurs, la différence en termes de gap est de 49%.
Remarque: des commissions peuvent être gagnées à partir des liens ci-dessus. Ces scores ne sont qu’une
moyenne des performances obtenues avec ces processeurs, vous pouvez obtenir des résultats différents.
Geekbench 4 est une plateforme de benchmarks complète avec plusieurs types de tests, dont la compression de données, d’images, le cryptage en AES, l’encodage en SQL, en HTML, le rendu d’un fichier PDF, le calcul matriciel, de Transformation de Fourier rapide, la simulation d’objets en 3D, l’édition de photos, des tests sur la mémoire. Cela nous permet de mieux visualiser la puissance respective de ces appareils. Pour chaque résultat, on a pris une moyenne de 250 valeurs sur le fameux logiciel de benchmarks.
Équivalence :
Intel Core i5-2400 équivalent AMDIntel Core i7-3770 équivalent AMD
Voir aussi :
Intel Core i5-2400S
Intel Core i7-3770KIntel Core i7-3770S
Intel Core i7-3770 vs.
 Intel Core i5-2400
Intel Core i7-3770
O Intel Core i7-3770 opera com 4 núcleos e 8 threads de CPU. É executado em 3.90 GHz base 3.90 GHz todos os núcleos enquanto o TDP está definido em 77 W .O processador está conectado ao soquete da CPU LGA 1155 Esta versão inclui 8.00 MB de cache L3 em um chip, suporta canais de 2 e recursos 3.0 PCIe Gen 16 lanes. Tjunction mantém abaixo de — graus C. Em particular, Ivy Bridge S Arquitetura é aprimorada com 22 nm e suporta VT-x, VT-x EPT, VT-d . O produto foi lançado em Q2/2012
Intel Core i5-2400
O Intel Core i5-2400 opera com 4 núcleos e 8 threads de CPU. É executado em 3.40 GHz base No turbo todos os núcleos enquanto o TDP está definido em 95 W .O processador está conectado ao soquete da CPU LGA 1155 Esta versão inclui 6.00 MB de cache L3 em um chip, suporta canais de 2 DDR3-1066, DDR3-1333 e recursos PCIe Gen lanes. Tjunction mantém abaixo de — graus C. Em particular, Sandy Bridge S Arquitetura é aprimorada com 32 nm e suporta VT-x, VT-x EPT . O produto foi lançado em Q1/2011
Intel Core i7-3770
Intel Core i5-2400
Detalhes de comparação
| 3.40 GHz | Frequência | 3.10 GHz |
| 4 | Núcleos | 4 |
| 3.90 GHz | Turbo (1 núcleo) | 3.40 GHz |
| 3.90 GHz | Turbo (todos os núcleos) | No turbo |
| Yes | Hyperthreading | No |
| Yes | Overclocking | No |
| normal | Arquitetura Central | normal |
|
Intel HD Graphics 4000 |
GPU |
Intel HD Graphics 2000 |
| 1.15 GHz | GPU (Turbo) | 1.10 GHz |
| 22 nm | Tecnologia | 32 nm |
| 1.15 GHz | GPU (Turbo) | 1.10 GHz |
| 11.0 | Versão DirectX | 10.1 |
| 3 | Máx. monitores | 2 |
| Memória | DDR3-1066 DDR3-1333 |
|
| 2 | Canais de memória | 2 |
| Memória máxima | ||
| No | ECC | No |
| — | L2 Cache | — |
8. 00 MB 00 MB |
L3 Cache | 6.00 MB |
| 3.0 | Versão PCIe | |
| 16 | PCIe lanes | |
| 22 nm | Tecnologia | 32 nm |
| LGA 1155 | Soquete | LGA 1155 |
| 77 W | TDP | 95 W |
| VT-x, VT-x EPT, VT-d | Virtualização | VT-x, VT-x EPT |
| Q2/2012 | Data de lançamento | Q1/2011 |
|
Mostrar mais dados |
Mostrar mais dados |
Cinebench R23 (Single-Core)
O Cinebench R23 é o sucessor do Cinebench R20 e também é baseado no Cinema 4 Suite. Cinema 4 é um software usado mundialmente para criar formas 3D. O teste de núcleo único usa apenas um núcleo de CPU, a quantidade de núcleos ou capacidade de hyperthreading não conta.
Cinebench R23 (Multi-Core)
O Cinebench R23 é o sucessor do Cinebench R20 e também é baseado no Cinema 4 Suite. Cinema 4 é um software usado mundialmente para criar formas 3D. O teste multi-core envolve todos os núcleos da CPU e tira uma grande vantagem do hyperthreading.
Cinebench R20 (Single-Core)
O Cinebench R20 é o sucessor do Cinebench R15 e também é baseado no Cinema 4 Suite. Cinema 4 é um software usado mundialmente para criar formas 3D. O teste de núcleo único usa apenas um núcleo de CPU, a quantidade de núcleos ou capacidade de hyperthreading não conta.
Cinebench R20 (Multi-Core)
O Cinebench R20 é o sucessor do Cinebench R15 e também é baseado no Cinema 4 Suite. Cinema 4 é um software usado mundialmente para criar formas 3D. O teste multi-core envolve todos os núcleos da CPU e tira uma grande vantagem do hyperthreading.
Cinebench R15 (Single-Core)
O Cinebench R15 é o sucessor do Cinebench 11.5 e também é baseado no Cinema 4 Suite. Cinema 4 é um software usado mundialmente para criar formas 3D. O teste de núcleo único usa apenas um núcleo de CPU, a quantidade de núcleos ou capacidade de hyperthreading não conta.
Cinebench R15 (Multi-Core)
O Cinebench R15 é o sucessor do Cinebench 11.5 e também é baseado no Cinema 4 Suite. Cinema 4 é um software usado mundialmente para criar formas 3D. O teste multi-core envolve todos os núcleos da CPU e tira uma grande vantagem do hyperthreading.
Geekbench 5, 64bit (Single-Core)
Geekbench 5 é um benchmark de plataforma cruzada que usa muito a memória do sistema. Uma memória rápida empurra muito o resultado. O teste de núcleo único usa apenas um núcleo de CPU, a quantidade de núcleos ou capacidade de hyperthreading não conta.
Geekbench 5, 64bit (Multi-Core)
Geekbench 5 é um benchmark de plataforma cruzada que usa muito a memória do sistema. Uma memória rápida empurra muito o resultado. O teste multi-core envolve todos os núcleos da CPU e tira uma grande vantagem do hyperthreading.
iGPU — FP32 Performance (Single-precision GFLOPS)
O desempenho teórico de computação da unidade gráfica interna do processador com precisão simples (32 bits) em GFLOPS. GFLOPS indica quantos bilhões de operações de ponto flutuante o iGPU pode realizar por segundo.
Blender 2.81 (bmw27)
O Blender é um software gráfico 3D gratuito para renderizar (criar) corpos 3D, que também podem ser texturizados e animados no software. O benchmark Blender cria cenas predefinidas e mede o (s) tempo (s) necessário (s) para a cena inteira. Quanto mais curto for o tempo necessário, melhor. Selecionamos o bmw27 como cenário de referência.
Geekbench 3, 64bit (Single-Core)
Geekbench 3 é um benchmark de plataforma cruzada que usa muito a memória do sistema. Uma memória rápida empurra muito o resultado. O teste de núcleo único usa apenas um núcleo de CPU, a quantidade de núcleos ou capacidade de hyperthreading não conta.
Geekbench 3, 64bit (Multi-Core)
Geekbench 3 é um benchmark de plataforma cruzada que usa muito a memória do sistema. Uma memória rápida empurra muito o resultado. O teste multi-core envolve todos os núcleos da CPU e tira uma grande vantagem do hyperthreading.
Cinebench R11.5, 64bit (Single-Core)
O Cinebench 11.5 é baseado no Cinema 4D Suite, um software popular para gerar formulários e outras coisas em 3D. O teste de núcleo único usa apenas um núcleo de CPU, a quantidade de núcleos ou capacidade de hyperthreading não conta.
Cinebench R11.5, 64bit (Multi-Core)
O Cinebench 11.5 é baseado no Cinema 4D Suite, um software popular para gerar formulários e outras coisas em 3D. O teste multi-core envolve todos os núcleos da CPU e tira uma grande vantagem do hyperthreading.
Cinebench R11.5, 64bit (iGPU, OpenGL)
O Cinebench 11.5 é baseado no Cinema 4D Suite, um software popular para gerar formulários e outras coisas em 3D. O teste iGPU usa a unidade gráfica interna da CPU para executar comandos OpenGL.
Estimated results for PassMark CPU Mark
Alguns dos CPUs listados abaixo foram testados por CPU-Comparison. No entanto, a maioria das CPUs não foi testada e os resultados foram estimados por uma fórmula proprietária secreta de CPU-Comparison. Como tal, eles não refletem com precisão os valores reais da marca Passmark CPU e não são endossados pela PassMark Software Pty Ltd.
Estimativa de uso elétrico
Média de horas de uso por dia
Utilização média da CPU (0-100%)
Custo de energia, dólar por kWh
Estimativa de uso elétrico
Média de horas de uso por dia
Utilização média da CPU (0-100%)
Custo de energia, dólar por kWh
| Intel Core i7-3770 | Intel Core i5-2400 | |
| 77 W | Max TDP | 95 W |
| NA | Consumo de energia por dia (kWh) | NA |
| NA | Custo de funcionamento por dia | NA |
| NA | Consumo de energia por ano (kWh) | NA |
| NA | Custo de funcionamento por ano | NA |
Comparação popular
Comments
Intel Core i5-2400 vs Intel Core i7-3770: What is the difference?
32 Ballla
Intel Core i5-2400
42 Ballla
Intel Core i7-3770 9000 Why is Intel Core i5-2400 better than Intel Core i7-3770?
- GPU frequency 200MHz higher?
850MHz vs 650MHz
Why is Intel Core i7-3770 better than Intel Core i5-2400?
- 9.
 68% higher CPU speed?
4 x 3.4GHz vs 4 x 3.1GHz - 267MHz higher RAM speed?
1600MHz vs 1333MHz - 4 more CPU threads?
8 vs 4 - 32.4°C higher than maximum operating temperature?
105°C vs 72.6°C - Smaller 10nm semiconductors?
22nm vs 32nm - 1.63x higher PassMark score?
9460 vs 5801 - 0.5GHz higher turbo clock speed?
3.9GHz vs 3.4GHz - 18W below TDP?
77W vs 95W
Which comparisons are the most popular?
AMD Ryzen 5 5500U
vs
Intel Core i5-1135G7
AMD RYZEN 3 3250U
VS
Intel Core i3-1115g4
AMD Ryzen 3 5300U
VS
Intel Core i3-1115g4
AMD Ryzen 7 5800h
VS 9000) AMD RYZEN 5 5500U
VS
Intel Core i3-1115G4
AMD Ryzen 7 5700u
VS
Intel Core i7-1165g7
AMD Ryzen 5 5500u
of
. 21 5 3500U
VS
Intel Core i5-10210U
Intel Core i3-1115G4
VS
Intel Core i5-10210U 9000U
AMD Ryzen 7 3700U 9000 VS 9000u 9000u 9000u
SOME
Overall rating
Intel Core i5-2400
3 User reviews
Intel Core i5-2400
5.3 /10
37 User reviews 90
Intel Core 7-3
3
3 reviews of users
Intel Core i7-3770
/10
3 Reviews of Users
Functions
6.7 /10 9000 10
3 Votes
Games
2.0 /10
3 VOTES
/10
3 VOTES
performance
4.0 /10 9
3 Votes
10.0 /10
3 Votes
Reliability
4.7 /10
3 VOTES
10.0 9000 /10
3 VOTES 9000
3 Votes
9.0 /10
3 Votes
Productivity
1. Skur -old processor
4 x 3. 1GHZ
1GHZ
4 x 3.4GHZ
The central processor speed shows how many processing cycles per second can be performed processor, considering all its cores (processors). It is calculated by adding the clock speeds of each core or, in the case of multi-core processors, each group of cores.
2nd processor thread
More threads result in better performance and better multitasking.
3.speed turbo clock
3.4GHz
3.9GHz
When the processor is running below its limits, it can jump to a higher clock speed to increase performance.
4. Has unlocked multiplier
✖Intel Core i5-2400
✖Intel Core i7-3770
Some processors come with an unlocked multiplier and are easier to overclock, allowing for better performance in games and other applications.
5.L2 Cache
More L2 scratchpad memory results in faster results in CPU and system performance tuning.
6.L3 cache
More L3 scratchpad memory results in faster results in CPU and system performance tuning.
7.L1 cache
More L1 cache results in faster results in CPU and system performance tuning.
8.core L2
0.25MB/core
0.25MB/core
More data can be stored in the L2 scratchpad for access by each processor core.
9.core L3
1.5MB/core
2MB/core
More data can be stored in L3 scratchpad for access by each processor core.
Memory
1.RAM speed
1333MHz
1600MHz
Can support faster memory which speeds up system performance.
2.max memory bandwidth
21GB/s
25.6GB/s
This is the maximum rate at which data can be read from or stored in memory.
3. DDR version
DDR (Dynamic Dynamic Random Access Memory Double Data Rate) is the most common type of RAM. New versions of DDR memory support higher maximum speeds and are more energy efficient.
4.Memory channels
More memory channels increase the speed of data transfer between memory and processor.
5.maximum memory capacity
Maximum memory capacity (RAM).
6.bus baud rate
The bus is responsible for transferring data between different components of a computer or device.
7. Supports Memory Error Code
✖Intel Core i5-2400
✖Intel Core i7-3770
Memory Error Code can detect and repair data corruption. It is used when necessary to avoid distortion, such as in scientific computing or when starting a server.
8.eMMC version
Unknown. Help us offer a price. (Intel Core i5-2400)
Unknown. Help us offer a price. (Intel Core i7-3770)
The newer version of eMMC — built-in flash memory card — speeds up the memory interface, has a positive effect on device performance, for example, when transferring files from a computer to internal memory via USB.
9.bus frequency
Unknown. Help us offer a price. (Intel Core i5-2400)
Unknown. Help us offer a price. (Intel Core i7-3770)
The bus is responsible for transferring data between various components of a computer or device
Geotagging
1. PassMark result
This test measures processor performance using multi-threading.
2. PassMark result (single)
This test measures processor performance using a thread of execution.
3.Geekbench 5 result (multi-core)
Geekbench 5 is a cross-platform benchmark that measures the performance of a multi-core processor. (Source: Primate Labs,2022)
4. Cinebench R20 result (multi-core)
Unknown. Help us offer a price. (Intel Core i5-2400)
Cinebench R20 is a benchmark that measures the performance of a multi-core processor by rendering a 3D scene.
5.Cinebench R20 result (single core)
Unknown. Help us offer a price. (Intel Core i5-2400)
Cinebench R20 is a test to evaluate the performance of a single core processor when rendering a 3D scene.
6.Geekbench 5 result (single core)
Geekbench 5 is a cross-platform test that measures the single core performance of a processor. (Source: Primate Labs, 2022)
7. Blender test result (bmw27)
Unknown. Help us offer a price. (Intel Core i5-2400)
Unknown. Help us offer a price. (Intel Core i7-3770)
Blender benchmark (bmw27) measures CPU performance by rendering a 3D scene. More powerful processors can render a scene in a shorter time.
8.Blender result (classroom)
Unknown. Help us offer a price. (Intel Core i5-2400)
Unknown. Help us offer a price. (Intel Core i7-3770)
The Blender (classroom) benchmark measures CPU performance by rendering a 3D scene. More powerful processors can render a scene in a shorter time.
9.performance per watt
This means that the processor is more efficient, giving more performance per watt of power used.
Functions
1.uses multithreading
✖Intel Core i5-2400
✔Intel Core i7-3770
physical processor core into logical cores, also known as threads. Thus, each core can run two instruction streams at the same time.
2. Has AES
✔Intel Core i5-2400
✔Intel Core i7-3770
AES is used to speed up encryption and decryption.
3. Has AVX
✔Intel Core i5-2400
✔Intel Core i7-3770
AVX is used to help speed up calculations in multimedia, scientific and financial applications, and to improve the performance of the Linux RAID program.
4.Version SSE
SSE is used to speed up multimedia tasks such as editing images or adjusting audio volume. Each new version contains new instructions and improvements.
5. Has F16C
✖Intel Core i5-2400
✔Intel Core i7-3770
F16C is used to speed up tasks such as adjusting image contrast or adjusting volume.
6 bits transmitted at the same time
Unknown. Help us offer a price. (Intel Core i5-2400)
Unknown. Help us offer a price. (Intel Core i7-3770)
NEON provides faster media processing such as MP3 listening.
7. Has MMX
✔Intel Core i5-2400
✔Intel Core i7-3770
MMX is used to speed up tasks such as adjusting image contrast or adjusting volume.
8. Has TrustZone
✖Intel Core i5-2400
✖Intel Core i7-3770
The technology is integrated into the processor to ensure device security when using features such as mobile payments and streaming video using digital rights management technology ( DRM).
9.interface width
Unknown. Help us offer a price. (Intel Core i5-2400)
Unknown. Help us offer a price. (Intel Core i7-3770)
The processor can decode more instructions per clock (IPC), which means that the processor performs better
Price comparison
Cancel
Which CPUs are better?
Compare Intel Core i7 3770 and Intel Core i5 2400
Intel Core i7 3770
3.4 GHz | 4 cores | LGA 1155
VS
Intel Core i5 2400
3. 1GHz | 4 cores | LGA 1155
Benchmark
General result
Based on 8 tests:
Intel Core i7 3770 faster than
Intel Core i7 3770
9000
9000 -core)
Intel Core i7 3770 is 50.93% faster
Intel Core i7 3770
12524 97%
Intel Core i7 3770
Intel Core i5 2400
5870
Passmark (Single Core)
I7 3770 9000 9000 9000 9000 9000 3 Intel Core INTEL CORE INTELA i5 2400
1741
Reasons to choose Intel Core i7 3770
- Smaller CPU (22nm vs. operations that the processor performs in 1 second
- Higher turbo frequency: 3.9 GHz vs 3.4 GHz
- More threads (8 vs 4) allows more processes to run simultaneously
- More L3 cache (8 MB vs 6 MB) allows the processor access data faster
- Larger L3 cache per core: 2MB/core vs. 4°C) allows the processor to work in more severe temperature conditions
sse sse2 sse3 ssse3 sse4 sse41 SSE42 AVX AESS Intel Core i7-3770
versus
Intel Core i5-2400
Benefits
Reasons to choose Intel Core i7-3770
- Newer processor, release date difference 1 year(s) 3 month(s)
- About 15% more clock speed: 3.
 90 GHz vs 3.40 GHz
 - About 45% more maximum core temperature: 105°C vs 72.6°C
- The newer manufacturing process of the processor allows it to be more powerful, but with lower power consumption: 22 nm vs 32 nm
- Approximately 33% larger L3 cache, which means more data can be stored in it for quick access
- Approximately 23% less power consumption: 77 Watt vs 95 Watt
- PassMark — Single thread mark performance approximately 31% higher: 2073 vs 1579
- Approximately 66% increase in PassMark — CPU mark performance: 6400 vs 3847
- Approximately 20% increase in Geekbench 4 — Single Core performance: 798 vs 665
- About 43% better performance in Geekbench 4 — Multi-Core benchmark: 3074 vs 2147
- About 63% better performance in 3DMark Fire Strike — Physics Score benchmark: 3662 vs 2247
- Performance in CompuBench 1.5 — FaceDetection Desktop Detection benchmark (mPixels/s) about 54% more: 4.603 vs 2.995
- CompuBench 1.
 5 Desktop — Ocean Surface Simulation (Frames/s) 8.6x more performance: 80.961 vs 9.378
 - Performance in CompuBench 1.5 Desktop — T-Rex (Frames/s) about 61% better: 0.585 vs 0.364
- Performance in CompuBench 1.5 Desktop — Video Composition (Frames/s) about 27% better: 2.179 vs 1.721
- Performance in CompuBench 1.5 Desktop — Bitcoin Mining (mHash/s) about 46% better: 6.05 vs 4.139
More threads: 4 vs 4
Release date April 2012 vs January 2011 Number of threads 8 vs 4 Maximum frequency 3.90 GHz vs 3.40 GHz Maximum core temperature 105°C vs 72.6°C Process 22 nm vs 32 nm Level 3 cache 8192 KB (shared) vs 6144 KB (shared) Power consumption (TDP) 77 Watt vs 95 Watt PassMark — Single thread mark 2073 vs 1579 PassMark — CPU mark 6400 vs 3847 Geekbench 4 — Single Core 798 vs 665 Geekbench 4 — Multi-Core 3074 vs 2147 3DMark Fire Strike — Physics Score 3662 vs 2247 CompuBench 1.  5 Desktop — Face Detection (mPixels/s)
 4.603 vs 2.995 CompuBench 1.5 Desktop — Ocean Surface Simulation (Frames/s) 80.961 vs 9.378 CompuBench 1.5 Desktop — T-Rex (Frames/s) 0.585 vs 0.364 CompuBench 1.5 Desktop — Video Composition (Frames/s) 2.179 vs 1.721 CompuBench 1.5 Desktop — Bitcoin Mining (mHash/s) 6.05 vs 4.139 Benchmark comparison
CPU 1: Intel Core i7-3770
CPU 2: Intel Core i5-2400PassMark — Single thread mark CPU 1 CPU 2 PassMark — CPU mark CPU 1 CPU 2 Geekbench 4 — Single Core CPU 1 CPU 2 Geekbench 4 — Multi-Core CPU 1 CPU 2 3DMark Fire Strike — Physics Score CPU 1 CPU 2 CompuBench 1. 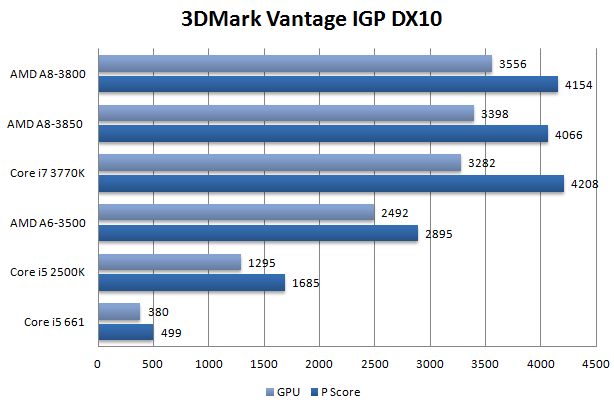 5 Desktop — Face Detection (mPixels/s)
 CPU 1 CPU 2 CompuBench 1.5 Desktop — Ocean Surface Simulation (Frames/s) CPU 1 CPU 2 80.961 CompuBench 1.5 Desktop — T-Rex (Frames/s) CPU 1 CPU 2 CompuBench 1.  5 Desktop — Video Composition (Frames/s)
 CPU 1 CPU 2 CompuBench 1.5 Desktop — Bitcoin Mining (mHash/s) CPU 1 CPU 2 Name Intel Core i7-3770 Intel Core i5-2400 PassMark — Single thread mark 2073 1579 PassMark — CPU mark 6400 3847 Geekbench 4 — Single Core 798 665 Geekbench 4 — Multi-Core 3074 2147 3DMark Fire Strike — Physics Score 3662 2247 CompuBench 1.  5 Desktop — Face Detection (mPixels/s)
 4.603 2.995 CompuBench 1.5 Desktop — Ocean Surface Simulation (Frames/s) 80.961 9.378 CompuBench 1.5 Desktop — T-Rex (Frames/s) 0.585 0.364 CompuBench 1.5 Desktop — Video Composition (Frames/s) 2.179 1.721 CompuBench 1.5 Desktop — Bitcoin Mining (mHash/s) 6.05 4.139 GFXBench 4.0 — T-Rex (Frames) 2876 GFXBench 4.  0 — T-Rex (Fps)
 2876 Feature comparison
Intel Core i7-3770 Intel Core i5-2400 Architecture name Ivy Bridge Sandy Bridge Issue date April 2012 January 2011 Price at first issue date $324 $60 Ranking 1373 1969 Price now $159. 99
$83.99 Processor Number i7-3770 i5-2400 Series Legacy Intel® Core™ Processors Legacy Intel® Core™ Processors Status Discontinued Launched Price/performance ratio (0-100) 17.10 20.89 Applicability Desktop Desktop Support 64 bit Base frequency 3. 40 GHz
3.10 GHz Bus Speed 5 GT/s DMI 5 GT/s DMI Crystal area 160mm 216 mm Level 1 cache 64 KB (per core) 64 KB (per core) Level 2 cache 256 KB (per core) 256 KB (per core) Level 3 cache 8192 KB (shared) 6144 KB (shared) Process 22 nm 32nm Maximum case temperature (TCase) 67 °C Maximum core temperature 105°C 72. 6°C
Maximum frequency 3.90 GHz 3.40 GHz Number of cores 4 4 Number of threads 8 4 Number of transistors 1400 million 1160 million Maximum number of memory channels 2 2 Maximum memory bandwidth 25.6 GB/s 21 GB/s Maximum memory size 32GB 32GB Supported memory types DDR3 1333/1600 DDR3 1066/1333 Device ID 0x162 0x102 Graphics base frequency 650MHz 850MHz Graphics max dynamic frequency 1. 15 GHz
1.10 GHz Maximum GPU clock 1.15 GHz 1.1 GHz Intel® Clear Video Technology HD Intel® Flexible Display Interface (Intel® FDI) Intel® InTru™ 3D Technology Intel® Quick Sync Video Integrated graphics Intel® HD Graphics 4000 Intel® HD Graphics 2000 Maximum number of monitors supported 3 2 WiDi support Low Halogen Options Available Maximum number of processors in configuration
1 1 Package Size 37. 5mm x 37.5mm
37.5mm x 37.5mm Supported sockets FCLGA1155 LGA1155 Power consumption (TDP) 77 Watt 95 Watt Thermal Solution 2011D Revision PCI Express 3.0 2.0 PCIe configurations up to 1×16, 2×8, 1×8 & 2×4 Number of PCI Express lanes 16 Anti-Theft Technology Execute Disable Bit (EDB) Intel® Identity Protection Technology Intel® Secure Key Technology Intel® Trusted Execution Technology (TXT) Enhanced Intel SpeedStep® Technology Flexible Display interface (FDI) Idle States Extended instructions Intel® SSE4. 1, Intel® SSE4.2, Intel® AVX
Intel® SSE4.1, Intel® SSE4.2, Intel® AVX Intel 64 Intel® Advanced Vector Extensions (AVX) Intel® AES New Instructions Intel® Hyper-Threading Technology Intel® TSX-NI Intel® Turbo Boost Technology Intel® vPro™ Platform Eligibility Thermal Monitoring Intel® Fast Memory Access Intel® Flex Memory Access Intel® Virtualization Technology (VT-x) Intel® Virtualization Technology for Directed I/O (VT-d) Intel® VT-x with Extended Page Tables (EPT) Compare Intel Core i5 4690S and Intel Core i7 3770T
Comparison of Intel Core i5-3570 and Intel Core i7-3770 processors by all known characteristics in categories: General information, Performance, Memory, Graphics, Graphic interfaces, Compatibility, Peripherals, Security and reliability, Technology, Virtualization.
Analysis of processor performance by benchmarks: PassMark — Single thread mark, PassMark — CPU mark, Geekbench 4 — Single Core, Geekbench 4 — Multi-Core, 3DMark Fire Strike — Physics Score, CompuBench 1.5 Desktop — Face Detection (mPixels/s), CompuBench 1.5 Desktop — Ocean Surface Simulation (Frames/s), CompuBench 1.5 Desktop — T-Rex (Frames/s), CompuBench 1.5 Desktop — Video Composition (Frames/s), CompuBench 1.5 Desktop — Bitcoin Mining (mHash/s), GFXBench 4.0 — T-Rex (Frames), GFXBench 4.0 — T-Rex (Fps).
Intel Core i5-3570
VS
Intel Core i7-3770
Benchmark
General result
Based on 16 tests: Intel Core i5 3570K
Intel Core 3,000 3,0004 100000 9000 3000 3000 3000 3000 Core I5 3570K100.89
Geekbench 3 (Multi-Core)
Intel Core i7 3770k faster than 27.03%
Intel Core I7 3770K
13098
Intel Core i Intel Core i Intel Core i Intel Core INTE0003
Intel Core i7 3770k
10.47 Megheshi/C
Intel Core i5 3570K
11.
75 Megheshi/C
Compubench 1.5 (T-REX) 9000 9000 3,000 9,000 9,000 9,000 9,000 9,000% fast
1.67 FPS
Intel Core i5 3570k
1.23 FPS
PCMARK8HOME30ACC
Intel Core i7 3770K faster than 4.77%
3770K 9000 9000 9000 9000 9000 9000 9000 9000 9000 9000 9000 9000 9000 9000
003
As you can see from the table above, the main difference between the two processors is the use of Hyper-Threading technology, as well as the size of the L3 Cache. The i7-3770K has 33% more caching capability than the i5-3570K. Hyper-Threading from Intel allows you to «create» one virtual core for each physical one, thus increasing the possibility of simultaneously processing several resource-intensive tasks (multitasking). As for graphics, both tested «processors» are about the same in strength thanks to the Intel HD 4000 core.
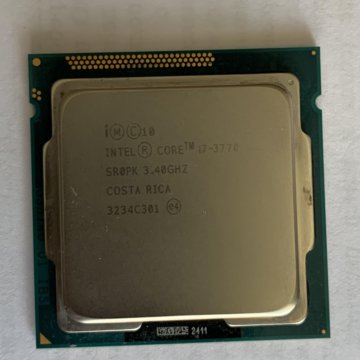
Here’s what the test participants look like:
Intel Core i5-3570K
AND Intel Core i7-3770K
Overlocking
The overlocking process of the new Ivy Bridge CPU is identical to the predecessor of the Sandy Bridge CPU.
As usual, we determined the frequency using the BCLK (Base Clock) x Multiplier running at 34×100 MHz for the i5-3570K. In the case of the i7-3770K, we decided to set it to 35x100MHz. The test results are disappointing for an older processor, which overclocks much worse. For reasons of objectivity and accuracy of comparison, for both products from Intel during the test, the maximum frequency was set to 4.5 GHz.
Programs such as Aida and CineBench were used to test the multitasking capabilities of processors. Both unconditionally gave the championship to 7-3770K. Note that it is the Hyper-Threading technology that allows the «seven» to achieve outstanding results. «Five» also suffers because of the small cache.
To test the speed of calculating the file structure and its compression, we decided to use WinRar and x264 HD Benchmark. Despite the fact that the results were predictable, they nevertheless turned out to be quite interesting. Of course, with a margin of 15 FPS, the i7-3770K won thanks to the same amount of memory.
However, the results of the i5-3570K turned out to be quite on the level!
And then we wondered what would happen if we calculate the Pi calculation in conditions where Hyper-Threading technology is not involved. And got the following results using wPrime 1024m and Nexus PiFast. As you can see from the following scorecards, the overclocked i5-3570K @4.5 GHz successfully outperforms the stock i7-3770K in both tests.
Games have long been «ahead of the rest» in terms of the loads they create for the CPU and GFU of computers. That is why the game test is quite an indicative test. However, in this case, we encountered a result that confirmed, however, the conclusion that has already been repeatedly voiced: modern processors have enough power to pass gaming tests with a bang, and at the same time, Hyper-Threading technology has almost no effect on the result
Crysis 2, Metro 2033 and Hitman Absolution were used as reference games
Graphics
As you know, both processors have an integrated graphics solution — Intel HD 4000 GFU.
This is quite a budget offer that allows people who do not have the opportunity to spend additional funds on discrete graphics to work with rather demanding programs, as well as play many more modern games, although usually at the lowest settings, which, of course, does not allow you to enjoy many of the «graphic delights» of modern blockbusters like Battlefield 3 or Crysis.
Using the same GFU on different processors does not mean the same effect at all. GFU needs a matching CPU to take full advantage of its integrated graphics. However, in our case, the results are almost identical. This was shown by tests on 3DMark Vantage and 3DMark11. Of course, the «seven» is ahead again, but by insignificant 50-60 points.
Temperature
Temperature testing is an important part of testing. Here it turns out how long the processor is ready to dispose of its «superpower». And if in general the temperature regime on both processors without overclocking and load was quite acceptable, then after overclocking and properly “heated” i5-3570K CPU gave out as much as 83°C! Which, of course, is no good.
The Intel Core i5-3570K sells for $235.
Pros
Nice price
Excellent performance
Great potential for overclocking and overclocking
Low power consumption both idle and under load
Cons
Really high temperatures under load
iGPU performance is poor
Conclusion
The Intel Core i5-3570K is a performance processor worth every dollar paid for it. We can say that in terms of price-quality ratio, this is currently the best processor on the market. The absence of Hyper-Threading does not create any problems in games. However, the only serious problem of the «five» is too high temperatures with a serious load on the power.
Intel Core i7-3770K sells for $342.
Pros
High performance
Hyper-Threading Technology
Huge potential for overclocking and overlocking
Attractive price (considering CPU performance)
Low power consumption both in idle and under load
Cons 9000 3
Comparatively high temperature under load
· Poor iGPU performance
The advantage of Hyper-Threading and more cache enabled the Intel Core i7-3770K to outperform its smaller sibling.
We can say that the «seven» is by far the most powerful processor on Ivy Bridge. The only problem with the i7-3770K is the weak budget iGPU. Let’s hope that already in the «Haswell» series, Intel will offer something more interesting and powerful as a graphics core.
Reasons to choose Intel Core i7 3770K
- High frequency (3.5 GHz vs 3.4 GHz) means more operations that the processor performs in 1 second
- High turbo frequency: 3.9 GHz vs 3 .8 GHz
- More threads (8 vs. 4) allows more processes to run simultaneously
- More L3 cache (8MB vs. 6MB) allows the processor to access data faster
- More L3 cache per core: 2MB/core vs 1.5MB/core
- 4 more threads: 8 vs 4
- About 3% more clock speed: 3.90 GHz vs 3.80 GHz
- About 56% more max core temperature: 105°C vs 67.4 °C
- About 33% L3 cache more means more data can be stored in it for quick access
- Performance in PassMark — Single thread mark about 2% more: 2072 vs 2037
- Performance in PassMark — CPU mark about 31% more: 6369vs 4868
- Approximately 2% increase in Geekbench 4 — Single Core performance: 798 vs 779
- Approx.
Physics Score approximately 29% higher: 3660 vs 2830
- CompuBench 1.5 Desktop — Face Detection (mPixels/s) approximately 37% higher: 4.673 vs 3.405
- CompuBench 1.5 Desktop — Ocean Surface Simulation (Frames) performance /s) 7.8 times more: 81.095 vs 10.336
- CompuBench 1.5 Desktop — T-Rex (Frames/s) approximately 41% faster performance: 0.589 vs 0.418
- CompuBench 1.5 Desktop — Video Composition (Frames/s) approximately 13% faster performance : 2.318 vs 2.045
- Approximately 68% increase in GFXBench 4.0 benchmark — T-Rex (Frames): 2889 vs 1720
- Approximately 68% increase in GFXBench 4.0 benchmark — T-Rex (Fps) performance: 2809 vs 1722
PassMark — CPU mark 6369 vs 4868 Geekbench 4 — Single Core 798 vs 779 Geekbench 4 — Multi-Core 3074 vs 2537 3DMark Fire Strike — Physics Score 3660 vs 2830 CompuBench 1. 50651
Extended instructions Intel® SSE4.1, Intel® SSE4.2, Intel® AVX2 Intel® SSE4.1, Intel® SSE4.2, Intel® AVX Intel 9065 Intel® Advanced Vector Extensions (AVX) Intel® AES New Instructions Intel® Hyper-Threading Technology Intel® My WiFi Technology 0030 Family
- Core i7-3770K
Compare - Core i7-3770
Compare
Family
- Core i5-2400S
Core - On average, gaming performance is 3% better.
- The speed of work in office applications and browsers is increased by 3%.
- In complex multi-threaded applications, faster and outperforms by 3%.
- The number of threads is 4 more.
- The price is $190 lower
- The number of physical cores is the same.
- The base frequency is equal.
i7-3770S
62.5 (+5.4%)
Core i5-2400
59.1
Performance in games and similar applications, according to our tests.
The performance of 4 cores, if any, and performance per core has the greatest impact on the result, since most games do not fully use more than 4 cores.
The speed of caches and working with RAM is also important.
Speed in office use
Core i7-3770S
63.7 (+5.2%)
Core i5-2400
60.4
Performance in everyday work such as browsers and office programs.
The performance of 1 core has the greatest impact on the result, since most of these applications use only one, ignoring the rest.
Similarly, many professional applications such as various CADs ignore multi-threaded performance.
Speed in heavy applications
Core i7-3770S
37.2 (+13.7%)
Core i5-2400
32.1
The performance of all cores and their number has the greatest impact on the result, since most of these applications willingly use all the cores and increase the speed accordingly.
At the same time, some periods of work can be demanding on the performance of one or two cores, for example, applying filters in the editor.
Data obtained from tests by users who tested their systems with and without overclocking.
Thus, you see the average values corresponding to the processor.
Speed of numerical operations
Simple household tasks
Core i7-3770S
60.1 (+8.5%)
Core i5-2400
55
Demanding games and tasks
Core i7-3770S
34.8 (+19.5%)
Core i5-2400
28
Extreme
Core i7-3770S
8.5 (+35.3%)
Core i5-2400
5.5
Different tasks require different CPU strengths. A system with few fast cores and low memory latency will be fine for the vast majority of games, but will be inferior to a system with a lot of slow cores in a rendering scenario.
We believe that a minimum of 4/4 (4 physical cores and 4 threads) processor is suitable for a budget gaming PC. At the same time, some games can load it at 100%, slow down and freeze, and performing any tasks in the background will lead to a drop in FPS.
Ideally, the budget shopper should aim for a minimum of 4/8 and 6/6. A gamer with a big budget can choose between 6/12, 8/8 and 8/16. Processors with 10 and 12 cores can perform well in games with high frequency and fast memory, but are overkill for such tasks. Also, buying for the future is a dubious undertaking, since in a few years many slow cores may not provide sufficient gaming performance.
When choosing a processor for your work, consider how many cores your programs use. For example, photo and video editors can use 1-2 cores when working with filtering, and rendering or converting in the same editors already uses all threads.
Data obtained from tests by users who tested their systems both with overclocking (maximum value in the table) and without (minimum).
A typical result is shown in the middle, the more filled in the color bar, the better the average result among all tested systems.
Benchmarks
Benchmarks were run on stock hardware, that is, without overclocking and with factory settings. Therefore, on overclocked systems, the points can noticeably differ upwards. Also, small performance changes may be due to the BIOS version.
Passmark
Intel Core i7-3770S
6213 (+38.5%)
Intel Core i5-2400
3819
Specifications
.
Basic
Manufacturer Intel Intel DescriptionInformation about the processor, taken from the official website of the manufacturer. Intel® Core™ i7-3770S Processor (8M Cache, up to 3.90 GHz) Intel® Core™ i5-2400 Processor (6M Cache, up to 3.40 GHz) ArchitectureCode name for the microarchitecture generation. Ivy Bridge Sandy Bridge Process The manufacturing process, measured in nanometers. The smaller the technical process, the more perfect the technology, the lower the heat dissipation and power consumption. 22 nm 32 nm Date of IssueMonth and year of the processor’s availability. 09-2016 09-2013 Model Official name. i7-3770S i5-2400 Cores The number of physical cores. 4 4 ThreadsNumber of threads. The number of logical processor cores that the operating system sees. 8 4 Multi-Threading Technology With Intel’s Hyper-threading and AMD’s SMT technology, one physical core is recognized as two logical cores by the operating system, thereby increasing processor performance in multi-threaded applications. Hyper-threading (note that some games may not work well with Hyper-threading, you can disable the technology in the BIOS of the motherboard for maximum FPS). Missing Base frequencyGuaranteed frequency of all processor cores at maximum load. Performance in single-threaded and multi-threaded applications and games depends on it. It is important to remember that speed and frequency are not directly related. For example, a new processor at a lower frequency may be faster than an old one at a higher one. 3.1 GHz 3.1 GHz Turbo Frequency The maximum frequency of a single processor core in turbo mode. Manufacturers allow modern processors to independently increase the frequency of one or more cores under heavy load, due to which performance is noticeably increased. It may depend on the nature of the load, the number of loaded cores, temperature and the specified limits. Significantly affects the speed in games and applications that are demanding on the frequency of the CPU.
3.9 GHz 3.4 GHz L3 cache size The third level cache acts as a buffer between the computer’s RAM and the processor’s level 2 cache. Used by all cores, the speed of information processing depends on the volume. 8 MB 6 MB Instructions 64-bit 64-bit Extended instruction set Allows you to speed up calculations, processing and execution of certain operations. Also, some games require instruction support. SSE4.1/4.2, AVX SSE4.1/4.2, AVX Embedded Options Available Two enclosure versions. Standard and designed for mobile devices. In the second version, the processor can be soldered on the motherboard.
No Yes Bus frequency The speed of communication with the system. 5 GT/s DMI 5 GT/s DMI Number of QPI links TDPThermal Design Power is an indicator that determines heat dissipation in standard operation. The cooler or water cooling system must be rated for a larger value. Remember that with a factory bus or manual overclocking, TDP increases significantly. 65 W 95 W Cooling system specifications 2011C Video core
Integrated graphics core Allows you to use your computer without a discrete graphics card. The monitor is connected to the video output on the motherboard. If earlier integrated graphics made it possible to simply work at a computer, today it can replace budget video accelerators and makes it possible to play most games at low settings.
Intel® HD Graphics 4000 Intel® HD Graphics 2000 GPU base clockFrequency in 2D and idle. 650 MHz 850 MHz Max GPU ClockMaximum 3D clock. 1150 MHz 1100MHz Intel® Wireless Display (Intel® WiDi) Supports Wireless Display technology over Wi-Fi 802.11n. Thanks to it, a monitor or TV equipped with the same technology does not require a cable to connect. No data No data Supported monitorsThe maximum number of monitors that can be connected to the integrated video core at the same time. 3 2 RAM
Maximum RAM Amount of RAM that can be installed on the motherboard with this processor. 32 GB 32 GB Supported type of RAM The type of RAM depends on its frequency and timings (speed), availability, price. DDR3 1333/1600 DDR3 1066/1333 RAM Channels The multi-channel memory architecture increases data transfer speed. On desktop platforms, two-channel, three-channel and four-channel modes are available. 2 2 RAM bandwidth 25.6 GB/s 21 GB/s ECC memory Support for error-correcting memory that is used in servers. Usually more expensive than usual and requires more expensive server components. However, second-hand server processors, Chinese motherboards and ECC memory sticks, which are sold relatively cheaply in China, have become widespread.
No data No data PCI
PCI-E The PCI Express computer bus version. The bandwidth and power limit depend on the version. There is backward compatibility. 3 2 PCI configuration options
up to 1×16, 2×8, 1×8 & 2×4 up to 1×16, 2×8, 1×8 & 2×4 Number of PCI lanes No data up to 1×16, 2×8, 1×8 & 2×4 Data Security
AES-NI The AES command set extension speeds up applications that use appropriate encryption. No data No data Intel® Secure Key An RDRAND instruction that allows you to create a high-performance random number generator. No data No data Decoration
Dimensions No data No data Supported sockets No data No data Maximum processors per motherboard No data No data Which is better
Intel Core i7-3770S
Intel Core i5-2400
What are the similarities of
What is better Intel Core i5-8600K or Intel Core i7-3770
Intel Core i5-8600k
Intel Core i7-3770
PASSMARK CPUS CPUS CPUS write speed and seek time when testing SSD performance.
Show all9468
max 89379
Average: 6033.5
5932
max 89379
Average: 6033.5
Cinebench21.5 score (single)
A benchmark that measures processor performance using a thread of execution.
ten
max 51
Average: 5.6
max 51
Average: 5.6
3DMark06 test score
8715
max 18628
Average: 3892.6
max 18628
Average: 3892.6
Cinebench R11.5 /64bit test score (Multi-Core)
10.6056
max 45.3622
Average: 5.3
max 45.3622
Average: 5.3
Cinebench R15 (Multi-Core) score
928
max 4614
Average: 638.
4
max 4614
Average: 638.4
Cinebench R15 score (Single-Core)
174
max 276
Average: 128.5
max 276
Average: 128.5
AES
Yes
Yes
Support for Intel Optane 9 memory0650
There is
No data
TERMOMONTROL TECHOM CONTROLS
is
Intel
Confidential Street
is
9000 9000 9000 Intel Trusted Execution Technology
Yes
Yes
Intel Boot Guard
Yes
N/A
Number of threads
The more threads, the better the performance of the processor, and it will be able to perform multiple tasks at the same time.
Show all6
max 256
Average: 10.7
eight
max 256
Average: 10.7
L1 cache size
A large amount of L1 memory accelerates results in the CPU and system performance settings
Show all384KB
max 4608
Average: 299.3 KB
256KB
max 4608
Average: 299.3 KB
L2 cache size
L2 cache with large scratchpad memory to increase processor speed and overall system performance.
Show all1.5MB
max 512
Average: 4.
5 MB
1MB
max 512
Average: 4.5 MB
L3 cache size
A large amount of L3 memory accelerates results in the CPU and system performance settings
Show all9MB
max 768
Average: 16.3 MB
8MB
max 768
Average: 16.3 MB
Maximum clock speed in Turbo 9 mode0650
When the processor’s speed drops below its limit, it may jump to a higher clock speed to improve performance.
Show all4.3GHz
max 5.5
Average: 3.2 GHz
3.9GHz
max 5.
5
Average: 3.2 GHz
Number of cores
6
max 72
Mean: 5.8
four
max 72
Mean: 5.8
Processor base clock speed
3.6GHz
max 4.7
Average: 2.5 GHz
3.4GHz
max 4.7
Average: 2.5 GHz
Frequency with Intel Turbo Boost Technology 2.0
4.3GHz
max 5.1
Average: 3.5 GHz
3.9GHz
max 5.1
Average: 3.
5 GHz
Max. number of PCI Express lanes
16
max 64
Average: 22.7
max 64
Average: 22.7
PCI Express configurations
Up to 1×16. 2×8. 1×8+2×4
up to 1×16. 2×8. 1×8 & 2×4
Idle states
Yes
Yes
Unlocked processor multiplier
Some processors have an unlocked multiplier, thanks to which they work faster and improve the quality in games and other applications.
Full textYes
No data
Turbo Boost technology
Turbo Boost is a technology that allows the processor to operate at a frequency higher than the maximum. This increases its productivity (including when performing complex tasks)
Show all2
Mean: 1.
9
2
Mean: 1.9
Max. graphics system frequency1.15GHz
max 1.55
Average: 1.1 GHz
1.15GHz
max 1.55
Average: 1.1 GHz
Number of PCI-Express lanes
16
n/a
Max. number of processors in configuration
one
Mean: 1.3
one
Mean: 1.3
DDR version
four
Mean: 3.5
3
Mean: 3.5
Max.
memory bandwidth
This is the speed at which the device stores or reads information.
41.6GB/s
max 352
Average: 41.4 GB/s
25.6GB/s
max 352
Average: 41.4 GB/s
Memory frequency
RAM can be faster to improve system performance.
Show all2666MHz
max 4800
Average: 2106.2 MHz
1600MHz
max 4800
Average: 2106.2 MHz
Max. number of memory channels
2
max 16
Mean: 2.
9
2
max 16
Mean: 2.9
Max. memory capacity
Largest RAM memory capacity.
128GB
max 6000
Average: 404.4 GB
32GB
max 6000
Average: 404.4 GB
System bus frequency
Data between computer components and other devices is transferred via the bus.
Show all8 GT/s
max 1600
Average: 156.1 GT/s
5 GT/s
max 1600
Average: 156.1 GT/s
ECC memory support
Memory debugging code is used when it is necessary to avoid data corruption in scientific computing or server startup.
It finds possible errors and repairs data corruption.
Full displayNo
No
Processor RAM
64 GB
max 128
Average: 34.8 GB
GB
max 128
Average: 34.8 GB
Max. Resolution (DP)
[Email Protected]
No data
VPRO
is
There are
Enhanced SpeedStep (EIST) 9000
4.5
max 4.6
Average: 4.1
max 4.6
Average: 4.1
Intel® AES-NI Commands
AES is needed to speed up encryption and decryption.
Yes
Yes
Hyper-Threading Technology
Many Intel processors use state-of-the-art hyper-threading technology.
Thus, each processor core works simultaneously on two threads, which significantly increases performance. Most processors work on the principle: one thread per core, therefore, their performance is lower.
Show allNo
Yes
OpenGL
Used by some applications to harness GPU power for non-graphical calculations. The newer the version, the more functional it will be
Show all4.5
max 4.6
Mean: 4.4
max 4.6
Mean: 4.4
AVX
AVX allows you to increase the speed of calculations in multimedia, financial and scientific applications, it also improves the performance of Linux RAID.
Show allYes
Yes
sse version
Allows you to speed up multimedia tasks (such as volume control).
Each subsequent version has a number of improvements
Show all4.2
max 4.2
Average: 4.1
4.2
max 4.2
Average: 4.1
4K support
You can view images in the highest quality 9EPT
is
there is
Virtualization technology AMD
There is
No data
Quick Sync Video Clear Video HD
Yes
Yes
InTru 3D
Yes
Yes
Workflow
The small size of the semiconductor means it is a new generation chip.
14 nm
Average: 36.
8 nm
22 nm
Average: 36.8 nm
Heat dissipation (TDP)
Heat dissipation requirement (TDP) is the maximum amount of energy that can be dissipated by the cooling system. The lower the TDP, the less power will be consumed.
Show all95W
Average: 67.6 W
77W
Average: 67.6 W
PCI Express Edition
3
Mean: 2.9
3
Mean: 2.9
condition 0004 Specifications of the cooling system GPU base clock
The graphics processing unit (GPU) has a high clock speed.
350MHz
max 2400
Average: 535.8 MHz
650MHz
max 2400
Average: 535.8 MHz
Supports 64-bit system
A 64-bit system can support more than 4 GB of RAM as opposed to a 32-bit system. This increases productivity. It also allows you to run 64-bit applications.
Full textYes
Yes
DirectX
Used in demanding games providing improved graphics
12
max 12.1
Average: 12
max 12.1
Average: 12
Maximum processor temperature
Reset may occur if the maximum temperature at which the processor operates is exceeded.
Show all100°C
max 110
Average value: 96 °C
105°C
max 110
Average value: 96 °C
OpenGL
Used by some applications to enable GPU power for non-graphical calculations. The newer the version, the more functional it will be
Show all4.5
max 4.6
Mean: 4.4
max 4.6
Mean: 4.4
Turbo GPU
If the speed of the GPU drops below its limit, then to improve performance, it can go to a high clock speed.
Show all1150MHz
max 2100
Average: 1091 MHz
1150MHz
max 2100
Average: 1091 MHz
Monitor support
Multiple monitors can be connected to the device, making it easier to work by increasing the working space.