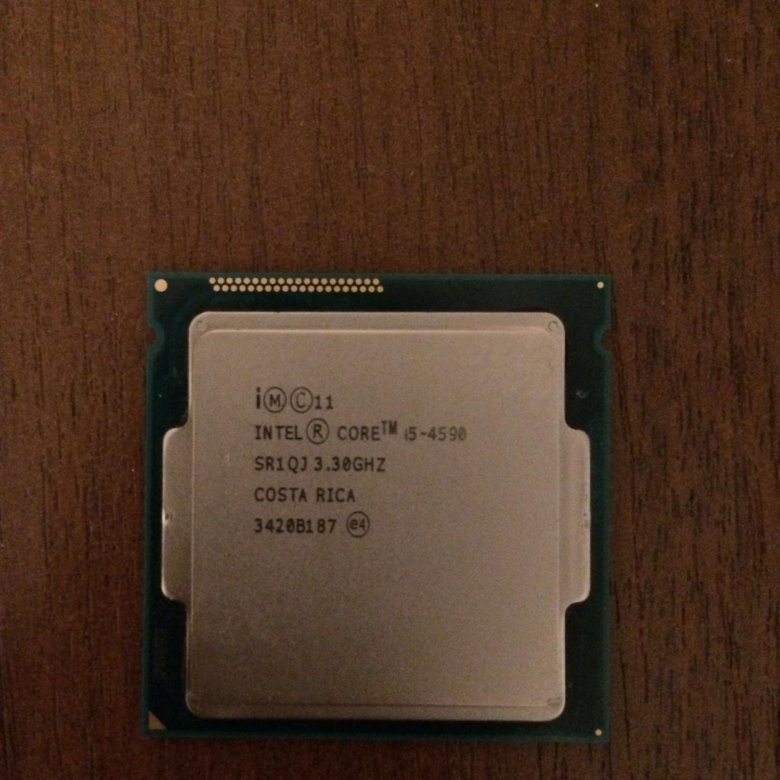
Intel Core i3-9100 vs Intel Core i5-4590
|
|
|
|
|
Intel Core i3-9100 vs Intel Core i5-4590
Comparison of the technical characteristics between the processors, with the Intel Core i3-9100 on one side and the Intel Core i5-4590 on the other side. The first is dedicated to the desktop sector, It has 4 cores, 4 threads, a maximum frequency of 4,2GHz. The second is used on the desktop segment, it has a total of 4 cores, 4 threads, its turbo frequency is set to 3,7 GHz. The following table also compares the lithography, the number of transistors (if indicated), the amount of cache memory, the maximum RAM memory capacity, the type of memory accepted, the release date, the maximum number of PCIe lanes, the values obtained in Geekbench 4 and Cinebench R15.
Note: Commissions may be earned from the links above.
This page contains references to products from one or more of our advertisers. We may receive compensation when you click on links to those products. For an explanation of our advertising policy, please visit this page.
Specifications:
| Processor | Intel Core i3-9100 | Intel Core i5-4590 | ||||||
| Market (main) | Desktop | Desktop | ||||||
| ISA | x86-64 (64 bit) | x86-64 (64 bit) | ||||||
| Microarchitecture | Coffee Lake | Haswell | ||||||
| Core name | Coffee Lake-S | Haswell-DT | ||||||
| Family | Core i3-9000 | Core i5-4000 | ||||||
| Part number(s), S-Spec | BX80684I39100, BX80684I39100, CM8068403377319 SR3XQ |
BX80646I54590, BXC80646I54590, CM8064601560615, QF4H, SR1QJ |
||||||
| Release date | Q2 2019 | Q2 2014 | ||||||
| Lithography | 14 nm++ | 22 nm | ||||||
| Transistors | — | 1. 400.000.000 400.000.000 |
||||||
| Cores | 4 | 4 | ||||||
| Threads | 4 | 4 | ||||||
| Base frequency | 3,6 GHz | 3,3 GHz | ||||||
| Turbo frequency | 4,2 GHz | 3,7 GHz | ||||||
| Bus speed | 8 GT/s | 5 GT/s | ||||||
| Cache memory | 6 MB | 6 MB | ||||||
| Max memory capacity | 64 GB | 32 GB | ||||||
| Memory types | DDR4-2400 | DDR3-1333/1600, DDR3L-1333/1600 |
||||||
| Max # of memory channels | 2 | 2 | ||||||
| Max memory bandwidth | 37,5 GB/s | 25,6 GB/s | ||||||
| Max PCIe lanes | 16 | 16 | ||||||
| TDP | 65 W | 84 W | ||||||
| Suggested PSU | 600W ATX Power Supply | 600W ATX Power Supply | ||||||
| GPU integrated graphics | Intel UHD Graphics 630 (Coffee Lake) | Intel HD Graphics 4600 | ||||||
| GPU execution units | 23 | 20 | ||||||
| GPU shading units | 184 | 160 | ||||||
| GPU base clock | 350 MHz | 350 MHz | ||||||
| GPU boost clock | 1100 MHz | 1150 MHz | ||||||
| GPU FP32 floating point | 423,2 GFLOPS | 352 GFLOPS | ||||||
| Socket | LGA1151 | LGA1150 | ||||||
| Compatible motherboard | Socket LGA 1151 Motherboard | Socket LGA 1150 Motherboard | ||||||
| Maximum temperature | 100°C | 72. 7°C 7°C |
||||||
| CPU-Z single thread | 375 | 347 | ||||||
| CPU-Z multi thread | 1.551 | 1.403 | ||||||
| Cinebench R15 single thread | 181 | 146 | ||||||
| Cinebench R15 multi-thread | 668 | 502 | ||||||
| Cinebench R23 single thread | 1.109 | 802 | ||||||
| Cinebench R23 multi-thread | 4.098 | 3.133 | ||||||
| PassMark single thread | 2.497 | 2.079 | ||||||
| PassMark CPU Mark | 6.874 | 5. 308 308 |
||||||
| (Windows 64-bit) Geekbench 4 single core |
4.785 | 4.154 | ||||||
| (Windows 64-bit) Geekbench 4 multi-core |
13.388 | 11.418 | ||||||
| (SGEMM) GFLOPS performance |
201,8 GFLOPS | 202 GFLOPS | ||||||
| (Multi-core / watt performance) Performance / watt ratio |
206 pts / W | 136 pts / W | ||||||
| Amazon | ||||||||
| eBay |
Note: Commissions may be earned from the links above.
We can better compare what are the technical differences between the two processors.
Suggested PSU: We assume that we have An ATX computer case, a high end graphics card, 16GB RAM, a 512GB SSD, a 1TB HDD hard drive, a Blu-Ray drive. We will have to rely on a more powerful power supply if we want to have several graphics cards, several monitors, more memory, etc.
Price: For technical reasons, we cannot currently display a price less than 24 hours, or a real-time price. This is why we prefer for the moment not to show a price. You should refer to the respective online stores for the latest price, as well as availability.
We see that the two processors have an equivalent number of cores, the maximum frequency of Intel Core i3-9100 is greater, that the PDT of Intel Core i3-9100 is lower. The Intel Core i3-9100 was designed earlier.
Performances :
Performance comparison between the two processors, for this we consider the results generated on benchmark software such as Geekbench 4.
| CPU-Z — Multi-thread & single thread score | |
|---|---|
| Intel Core i3-9100 |
375 1.  551 551 |
| Intel Core i5-4590 |
347 1.403 |
In single core, the difference is 8%. In multi-core, the differential gap is 11%.
Note: Commissions may be earned from the links above. These scores are only an
average of the performances got with these processors, you may get different results.
CPU-Z is a system information software that provides the name of the processor, its model number, the codename, the cache levels, the package, the process. It can also gives data about the mainboard, the memory. It makes real time measurement, with finally a benchmark for the single thread, as well as for the multi thread.
| Cinebench R15 — Multi-thread & single thread score | |
|---|---|
| Intel Core i3-9100 |
181 668 |
| Intel Core i5-4590 |
146 502 |
In single core, the difference is 24%. In multi-core, the differential gap is 33%.
Note: Commissions may be earned from the links above. These scores are only an
average of the performances got with these processors, you may get different results.
Cinebench R15 evaluates the performance of CPU calculations by restoring a photorealistic 3D scene. The scene has 2,000 objects, 300,000 polygons, uses sharp and fuzzy reflections, bright areas, shadows, procedural shaders, antialiasing, and so on. The faster the rendering of the scene is created, the more powerful the PC is, with a high number of points.
| Cinebench R23 — Multi-thread & single thread score | |
|---|---|
| Intel Core i3-9100 |
1.109 4.098 |
| Intel Core i5-4590 |
802 3.133 |
In single core, the difference is 38%. In multi-core, the differential gap is 31%.
Note: Commissions may be earned from the links above. These scores are only an
average of the performances got with these processors, you may get different results.
Cinebench R23 is cross-platform testing software that allows you to assess the hardware capabilities of a device such as a computer, tablet, server. This version of Cinebench takes into account recent developments in processors with multiple cores and the latest improvements in rendering techniques. The evaluation is ultimately even more relevant. The test scene contains no less than 2,000 objects and more than 300,000 polygons in total.
| PassMark — CPU Mark & single thread | |
|---|---|
| Intel Core i3-9100 |
2.497 6.874 |
| Intel Core i5-4590 |
2.079 5.  308 308 |
In single core, the difference is 20%. In multi-core, the differential gap is 30%.
Note: Commissions may be earned from the links above. These scores are only an
average of the performances got with these processors, you may get different results.
PassMark is a benchmarking software that performs several performance tests including prime numbers, integers, floating point, compression, physics, extended instructions, encoding, sorting. The higher the score is, the higher is the device capacity.
On Windows 64-bit:
| Geekbench 4 — Multi-core & single core score — Windows 64-bit | |
|---|---|
| Intel Core i3-9100 |
4.785 13.388 |
| Intel Core i5-4590 |
4.154 11.418 |
In single core, the difference is 15%. In multi-core, the differential gap is 17%.
On Linux 64-bit:
| Geekbench 4 — Multi-core & single core score — Linux 64-bit | |
|---|---|
| Intel Core i3-9100 |
5.214 15.114 |
| Intel Core i5-4590 |
4.412 11.077 |
In single core, the difference is 18%. In multi-core, the differential gap is 36%.
On Android 64-bit:
| Geekbench 4 — Multi-core & single core score — Android 64-bit | |
|---|---|
| Intel Core i3-9100 |
5.369 14.984 |
| Intel Core i5-4590 |
3.817 11.082 |
In single core, the difference is 41%. In multi-core, the differential gap is 35%.
On Mac OS X 64-bit:
| Geekbench 4 — Multi-core & single core score — Mac OS X 64-bit | |
|---|---|
| Intel Core i3-9100 |
5.  098 09814.836 |
| Intel Core i5-4590 |
4.156 12.083 |
In single core, the difference is 23%. In multi-core, the differential gap is 23%.
Note: Commissions may be earned from the links above. These scores are only an
average of the performances got with these processors, you may get different results.
Geekbench 4 is a complete benchmark platform with several types of tests, including data compression, images, AES encryption, SQL encoding, HTML, PDF file rendering, matrix computation, Fast Fourier Transform, 3D object simulation, photo editing, memory testing. This allows us to better visualize the respective power of these devices. For each result, we took an average of 250 values on the famous benchmark software.
Equivalence:
Intel Core i3-9100 AMD equivalentIntel Core i5-4590 AMD equivalent
See also:
Intel Core i3-9100FIntel Core i3-9100T
Intel Core i5-4590SIntel Core i5-4590T
Intel Core i3-9100 vs Intel Core i5-4590
Summary
-
Intel Core i3-9100
129%
-
Intel Core i5-4590
100%
Relative performance
-
Intel Core i3-9100
109%
-
Intel Core i5-4590
100%
Relative performance
-
Intel Core i3-9100
149%
-
Intel Core i5-4590
100%
Relative performance
Reasons to consider Intel Core i3-9100 |
9% higher single threaded performance. |
| Much higher multi threaded performance (around 49% higher). This allows for higher performance in professional applications like encoding or heavy multitasking. |
| This is a newer product, it might have better application compatibility/performance (check features chart below). |
| Around 29% higher average synthetic performance. |
Reasons to consider Intel Core i5-4590 |
| None |
Gaming
HWBench recommends Intel Core i3-9100
Based on game and synthetic benchmarks, and theoretical specifications.
Productivity
HWBench recommends Intel Core i3-9100
Based on productivity benchmarks, overall multithreaded performance and theoretical specifications.
Features
| Intel Core i3-9100 | Intel Core i5-4590 | |||
|---|---|---|---|---|
| MMX | ||||
| SSE | ||||
| SSE2 | ||||
| SSE3 | ||||
| SSSE3 | ||||
SSE4. 2 2 |
||||
| AVX | ||||
| AVX2 | ||||
| EIST | ||||
| Intel 64 | ||||
| XD bit | ||||
| VT-x | ||||
| VT-d | ||||
| AES-NI | ||||
| TSX | ||||
| TXT | ||||
| CLMUL | ||||
| FMA3 | ||||
| F16C | ||||
| BMI1 | ||||
| BMI2 | ||||
| Boost 2.0 | ||||
Architecture
| Intel Core i3-9100 | Intel Core i5-4590 | |||
|---|---|---|---|---|
| Architecture | Intel_Coffelake | vs | Intel_Haswell | |
| Market | Desktop | vs | Desktop | |
| Memory Support | DDR4 | vs | DDR3 | |
| Codename | Coffee Lake | vs | Haswell | |
| Release Date | Sep 2018 | vs | May 2014 |
Cores
| Intel Core i3-9100 | Intel Core i5-4590 | |||
|---|---|---|---|---|
| Cores | 4 | vs | 4 | |
| Threads | 4 | vs | 4 | |
| SMPs | 1 | vs | 1 | |
| Integrated Graphics | UHD Graphics 630 | vs | Intel HD 4600 |
Cache
| Intel Core i3-9100 | Intel Core i5-4590 | |||
|---|---|---|---|---|
| L1 Cache | 64 KB (per core) | vs | 64 KB (per core) | |
| L2 Cache | 256 KB (per core) | vs | 256 KB (per core) | |
| L3 Cache | 6144 KB (shared) | vs | 6144 KB (shared) |
Physical
| Intel Core i3-9100 | Intel Core i5-4590 | |||
|---|---|---|---|---|
| Socket | Intel Socket 1151 | vs | Intel Socket 1150 | |
| Max Case Temp | 72°C | vs | 72°C | |
| Package | FC-LGA1151 | vs | FC-LGA12C | |
| Die Size | unknown | vs | 177mm² | |
| Process | 14 nm | vs | 22 nm |
Performance
| Intel Core i3-9100 | Intel Core i5-4590 | |||
|---|---|---|---|---|
| Cpu Frequency | 3700 MHz | vs | 3200 MHz | |
| Turbo Clock | none | vs | 3600 MHz | |
| Base Clock | 100 MHz | vs | 100 MHz | |
| Voltage | variable | vs | unknown | |
| TDP | 65 W | vs | 84 W |
-
Intel Core i3-9100
4440 points
-
Intel Core i5-4590
4032 points
Points — higher is better
-
Intel Core i3-9100
17760 points
-
Intel Core i5-4590
14336 points
Points — higher is better
points — higher is better
points — higher is better
Intel Core i3-9100F vs Intel Core i5-4590
Comparative analysis of Intel Core i3-9100F and Intel Core i5-4590 processors for all known characteristics in the following categories: Essentials, Performance, Memory, Compatibility, Peripherals, Security & Reliability, Advanced Technologies, Virtualization, Graphics, Graphics interfaces, Graphics image quality, Graphics API support.
Benchmark processor performance analysis: PassMark — Single thread mark, PassMark — CPU mark, Geekbench 4 — Single Core, Geekbench 4 — Multi-Core, 3DMark Fire Strike — Physics Score, CompuBench 1.5 Desktop — Face Detection (mPixels/s), CompuBench 1.5 Desktop — Ocean Surface Simulation (Frames/s), CompuBench 1.5 Desktop — T-Rex (Frames/s), CompuBench 1.5 Desktop — Video Composition (Frames/s), CompuBench 1.5 Desktop — Bitcoin Mining (mHash/s), GFXBench 4.0 — Car Chase Offscreen (Frames), GFXBench 4.0 — Manhattan (Frames), GFXBench 4.0 — T-Rex (Frames), GFXBench 4.0 — Car Chase Offscreen (Fps), GFXBench 4.0 — Manhattan (Fps), GFXBench 4.0 — T-Rex (Fps).
Intel Core i3-9100F
Buy on Amazon
vs
Intel Core i5-4590
Buy on Amazon
Differences
Reasons to consider the Intel Core i3-9100F
- CPU is newer: launch date 4 year(s) 11 month(s) later
- Around 14% higher clock speed: 4.
 20 GHz vs 3.70 GHz
 - Around 38% higher maximum core temperature: 100 °C vs 72.72°C
- A newer manufacturing process allows for a more powerful, yet cooler running processor: 14 nm vs 22 nm
- 2x more maximum memory size: 64 GB vs 32 GB
- Around 29% lower typical power consumption: 65 Watt vs 84 Watt
- Around 20% better performance in PassMark — Single thread mark: 2516 vs 2090
- Around 27% better performance in PassMark — CPU mark: 6771 vs 5350
- Around 23% better performance in Geekbench 4 — Single Core: 1078 vs 876
- Around 20% better performance in Geekbench 4 — Multi-Core: 3394 vs 2820
- Around 29% better performance in 3DMark Fire Strike — Physics Score: 3666 vs 2840
| Launch date | 23 April 2019 vs May 2014 |
| Maximum frequency | 4.20 GHz vs 3.70 GHz |
| Maximum core temperature | 100 °C vs 72. 72°C 72°C |
| Manufacturing process technology | 14 nm vs 22 nm |
| Maximum memory size | 64 GB vs 32 GB |
| Thermal Design Power (TDP) | 65 Watt vs 84 Watt |
| PassMark — Single thread mark | 2516 vs 2090 |
| PassMark — CPU mark | 6771 vs 5350 |
| Geekbench 4 — Single Core | 1078 vs 876 |
| Geekbench 4 — Multi-Core | 3394 vs 2820 |
| 3DMark Fire Strike — Physics Score | 3666 vs 2840 |
Compare benchmarks
CPU 1: Intel Core i3-9100F
CPU 2: Intel Core i5-4590
| PassMark — Single thread mark |
|
|
||
| PassMark — CPU mark |
|
|
||
| Geekbench 4 — Single Core |
|
|
||
| Geekbench 4 — Multi-Core |
|
|
||
| 3DMark Fire Strike — Physics Score |
|
|
| Name | Intel Core i3-9100F | Intel Core i5-4590 |
|---|---|---|
| PassMark — Single thread mark | 2516 | 2090 |
| PassMark — CPU mark | 6771 | 5350 |
| Geekbench 4 — Single Core | 1078 | 876 |
| Geekbench 4 — Multi-Core | 3394 | 2820 |
| 3DMark Fire Strike — Physics Score | 3666 | 2840 |
CompuBench 1. 5 Desktop — Face Detection (mPixels/s) 5 Desktop — Face Detection (mPixels/s) |
3.798 | |
| CompuBench 1.5 Desktop — Ocean Surface Simulation (Frames/s) | 71.742 | |
| CompuBench 1.5 Desktop — T-Rex (Frames/s) | 0.404 | |
| CompuBench 1.5 Desktop — Video Composition (Frames/s) | 2.137 | |
| CompuBench 1.5 Desktop — Bitcoin Mining (mHash/s) | 6.131 | |
| GFXBench 4.0 — Car Chase Offscreen (Frames) | 1067 | |
GFXBench 4. 0 — Manhattan (Frames) 0 — Manhattan (Frames) |
2023 | |
| GFXBench 4.0 — T-Rex (Frames) | 3383 | |
| GFXBench 4.0 — Car Chase Offscreen (Fps) | 1067 | |
| GFXBench 4.0 — Manhattan (Fps) | 2023 | |
| GFXBench 4.0 — T-Rex (Fps) | 3383 |
Compare specifications (specs)
| Intel Core i3-9100F | Intel Core i5-4590 | |
|---|---|---|
| Architecture codename | Coffee Lake | Haswell |
| Launch date | 23 April 2019 | May 2014 |
| Launch price (MSRP) | $389 | $300 |
| Place in performance rating | 851 | 1305 |
| Processor Number | i3-9100F | i5-4590 |
| Vertical segment | Desktop | Desktop |
| Price now | $188. 99 99 |
|
| Series | 4th Generation Intel® Core™ i5 Processors | |
| Status | Discontinued | |
| Value for money (0-100) | 11.38 | |
| 64 bit support | ||
| Base frequency | 3.60 GHz | 3.30 GHz |
| Bus Speed | 8 GT/s DMI | 5 GT/s DMI2 |
| Manufacturing process technology | 14 nm | 22 nm |
| Maximum core temperature | 100 °C | 72. 72°C 72°C |
| Maximum frequency | 4.20 GHz | 3.70 GHz |
| Number of cores | 4 | 4 |
| Number of threads | 4 | 4 |
| Unlocked | ||
| Die size | 177 mm | |
| L1 cache | 64 KB (per core) | |
| L2 cache | 256 KB (per core) | |
| L3 cache | 6144 KB (shared) | |
| Maximum case temperature (TCase) | 72 °C | |
| Transistor count | 1400 million | |
| ECC memory support | ||
| Max memory channels | 2 | 2 |
| Maximum memory bandwidth | 37. 5 GB/s 5 GB/s |
25.6 GB/s |
| Maximum memory size | 64 GB | 32 GB |
| Supported memory types | DDR4-2400 | DDR3-1333/1600, DDR3L-1333/1600 @ 1.5V |
| Max number of CPUs in a configuration | 1 | 1 |
| Sockets supported | FCLGA1151 | FCLGA1150 |
| Thermal Design Power (TDP) | 65 Watt | 84 Watt |
| Low Halogen Options Available | ||
| Package Size | 37. 5mm x 37.5mm 5mm x 37.5mm |
|
| Thermal Solution | PCG 2013D | |
| Max number of PCIe lanes | 16 | 16 |
| PCI Express revision | 3.0 | Up to 3.0 |
| PCIe configurations | 1×16, 2×8, 1×8+2×4 | Up to 1×16, 2×8, 1×8+2×4 |
| Scalability | 1S Only | |
| Execute Disable Bit (EDB) | ||
| Intel® Identity Protection technology | ||
| Intel® Memory Protection Extensions (Intel® MPX) | ||
| Intel® OS Guard | ||
| Intel® Secure Key technology | ||
| Intel® Software Guard Extensions (Intel® SGX) | ||
| Intel® Trusted Execution technology (TXT) | ||
| Anti-Theft technology | ||
| Enhanced Intel SpeedStep® technology | ||
| Idle States | ||
| Instruction set extensions | Intel SSE4. 1, Intel SSE4.2, Intel AVX2 1, Intel SSE4.2, Intel AVX2 |
Intel® SSE4.1, Intel® SSE4.2, Intel® AVX2 |
| Integrated Intel® QuickAssist Technology | ||
| Intel® AES New Instructions | ||
| Intel® Hyper-Threading technology | ||
| Intel® Optane™ Memory Supported | ||
| Intel® Stable Image Platform Program (SIPP) | ||
| Intel® TSX-NI | ||
| Intel® Turbo Boost technology | ||
| Intel® vPro™ Platform Eligibility | ||
| Thermal Monitoring | ||
| Flexible Display interface (FDI) | ||
| Intel 64 | ||
| Intel® Advanced Vector Extensions (AVX) | ||
| Intel® My WiFi technology | ||
| Intel® Virtualization Technology (VT-x) | ||
| Intel® Virtualization Technology for Directed I/O (VT-d) | ||
| Intel® VT-x with Extended Page Tables (EPT) | ||
| Device ID | 0x412 | |
| Graphics base frequency | 350 MHz | |
| Graphics max dynamic frequency | 1. 15 GHz 15 GHz |
|
| Graphics max frequency | 1.15 GHz | |
| Intel® Clear Video HD technology | ||
| Intel® Flexible Display Interface (Intel® FDI) | ||
| Intel® InTru™ 3D technology | ||
| Intel® Quick Sync Video | ||
| Max video memory | 2 GB | |
| Processor graphics | Intel® HD Graphics 4600 | |
| DisplayPort | ||
| eDP | ||
| HDMI | ||
| Number of displays supported | 3 | |
| VGA | ||
| Wireless Display (WiDi) support | ||
| Max resolution over DisplayPort | [email protected] | |
| Max resolution over eDP | [email protected] | |
Max resolution over HDMI 1. 4 4 |
[email protected] | |
| Max resolution over VGA | [email protected] | |
| DirectX | 11.2/12 | |
| OpenGL | 4.3 |
i5-4590 vs i3-9100F — Call of Duty Modern Warfare with GTX 1660 Benchmarks 1080p, 1440p, Ultrawide, 4K Comparison
GTX 1660 with
Intel Core i5-4590 @ 3.30GHz
Call of Duty Modern Warfare
GTX 1660 with
Intel Core i3-9100F @ 3.60GHz
i5-4590
i3-9100F
Multi-Thread Performance
7296 Pts
8988 Pts
Single-Thread Performance
2113 Pts
2343 Pts
Call of Duty Modern Warfare
i5-4590 vs i3-9100F in Call of Duty Modern Warfare using GTX 1660 — CPU Performance comparison at Ultra, High, Medium, and Low Quality Settings with 1080p, 1440p, Ultrawide, 4K resolutions
i5-4590
i3-9100F
Ultra Quality
| Resolution | Frames Per Second |
|---|---|
| 1080p |
88. |
| 1080p |
101.0 FPS |
| 1440p |
64.0 FPS |
| 1440p |
72.7 FPS |
| 2160p |
38.2 FPS |
| 2160p |
43.4 FPS |
| w1440p |
54.7 FPS |
| w1440p |
62.1 FPS |
High Quality
| Resolution | Frames Per Second |
|---|---|
| 1080p |
142.6 FPS |
| 1080p |
158.9 FPS |
| 1440p |
108.0 FPS |
| 1440p |
120.3 FPS |
| 2160p |
69.4 FPS |
| 2160p |
77.4 FPS |
| w1440p |
94.4 FPS |
| w1440p |
105.2 FPS |
Medium Quality
| Resolution | Frames Per Second |
|---|---|
| 1080p |
196. |
| 1080p |
216.8 FPS |
| 1440p |
152.0 FPS |
| 1440p |
168.0 FPS |
| 2160p |
100.6 FPS |
| 2160p |
111.5 FPS |
| w1440p |
134.2 FPS |
| w1440p |
148.4 FPS |
 3 FPS
3 FPSLow Quality
| Resolution | Frames Per Second |
|---|---|
| 1080p |
303.8 FPS |
| 1080p |
332.6 FPS |
| 1440p |
239.9 FPS |
| 1440p |
263.3 FPS |
| 2160p |
162.9 FPS |
| 2160p |
179.6 FPS |
| w1440p |
213.7 FPS |
| w1440p |
234.7 FPS |
i5-4590
i3-9100F
Compare i5-4590 vs i3-9100F specifications
Share Your Comments 91
Compare i5-4590 vs i3-9100F in more games
Elden Ring
2022
God of War
2022
Overwatch 2
2022
Forza Horizon 5
2021
Halo Infinite
2021
Battlefield 2042
2021
Assassin’s Creed Valhalla
2020
Microsoft Flight Simulator
2020
Valorant
2020
Call of Duty: Black Ops Cold War
2020
Death Stranding
2020
Marvel’s Avengers
2020
Godfall
2020
Cyberpunk 2077
2020
Apex Legends
2019
Anthem
2019
Far Cry New Dawn
2019
Resident Evil 2
2019
Metro Exodus
2019
World War Z
2019
Gears of War 5
2019
F1 2019
2019
GreedFall
2019
Borderlands 3
2019
Call of Duty Modern Warfare
2019
Red Dead Redemption 2
2019
Need For Speed: Heat
2019
Assassin’s Creed Odyssey
2018
Battlefield V
2018
Call of Duty: Black Ops 4
2018
Final Fantasy XV
2018
Shadow of the Tomb Raider
2018
Forza Horizon 4
2018
Fallout 76
2018
Hitman 2
2018
Just Cause 4
2018
Monster Hunter: World
2018
Strange Brigade
2018
Assassin’s Creed Origins
2017
Dawn of War III
2017
Ghost Recon Wildlands
2017
Destiny 2
2017
PlayerUnknown’s Battlegrounds
2017
Fortnite Battle Royale
2017
Need For Speed: Payback
2017
For Honor
2017
Project CARS 2
2017
Forza Motorsport 7
2017
Ashes of the Singularity: Escalation
2016
Battlefield 1
2016
Deus Ex: Mankind Divided
2016
Doom
2016
F1 2016
2016
Total War: Warhammer
2016
Overwatch
2016
Dishonored 2
2016
Grand Theft Auto V
2015
Rocket League
2015
Need For Speed
2015
Project CARS
2015
Rainbow Six Siege
2015
Counter-Strike: Global Offensive
2012
League of Legends
2009
Minecraft
2009
Intel Core i3-9100 vs Intel Core i5-4570: What is the difference?
54points
Intel Core i3-9100
39points
Intel Core i5-4570
vs
64 facts in comparison
Intel Core i3-9100
Intel Core i5-4570
Why is Intel Core i3-9100 better than Intel Core i5-4570?
- 12.
 5% faster CPU speed?
4 x 3.6GHzvs4 x 3.2GHz - 800MHz higher ram speed?
2400MHzvs1600MHz - 27.28°C higher maximum operating temperature?
100°Cvs72.72°C - 8nm smaller semiconductor size?
14nmvs22nm - 0.6GHz higher turbo clock speed?
4.2GHzvs3.6GHz - 19W lower TDP?
65Wvs84W - 11.9GB/s more memory bandwidth?
37.5GB/svs25.6GB/s - 23.41% higher PassMark result (single)?
2546vs2063
Why is Intel Core i5-4570 better than Intel Core i3-9100?
- 6.5% higher PassMark result?
7156vs6719 - 1211million more transistors?
1400 millionvs189 million
Which are the most popular comparisons?
Intel Core i3-9100
vs
Intel Core i3-9100F
Intel Core i5-4570
vs
Intel Core i3-10100
Intel Core i3-9100
vs
Intel Core i3-8100
Intel Core i5-4570
vs
Intel Core i7-3770
Intel Core i3-9100
vs
Intel Core i5-6500
Intel Core i5-4570
vs
Intel Core i7-4770
Intel Core i3-9100
vs
Intel Core i5-8500
Intel Core i5-4570
vs
Intel Celeron N3060
Intel Core i3-9100
vs
Intel Core i5-7400
Intel Core i5-4570
vs
Intel Core i5-3470
Intel Core i3-9100
vs
Intel Core i3-10100
Intel Core i5-4570
vs
AMD FX-6300
Intel Core i3-9100
vs
AMD Ryzen 5 5600G
Intel Core i5-4570
vs
AMD A8-7600
Intel Core i3-9100
vs
Intel Core i3-9100T
Intel Core i5-4570
vs
Intel Core i7-2600
Intel Core i3-9100
vs
Intel Celeron G4930
Intel Core i5-4570
vs
Intel Core i5-6500
Intel Core i3-9100
vs
Intel Core i7-9700
Intel Core i5-4570
vs
Intel Core i5-2400
Price comparison
User reviews
Overall Rating
Intel Core i3-9100
4 User reviews
Intel Core i3-9100
9. 3/10
3/10
4 User reviews
Intel Core i5-4570
0 User reviews
Intel Core i5-4570
0.0/10
0 User reviews
Features
Value for money
9.8/10
4 votes
No reviews yet
Gaming
9.0/10
4 votes
No reviews yet
Performance
9.0/10
4 votes
No reviews yet
Reliability
9.5/10
4 votes
No reviews yet
Energy efficiency
9.5/10
4 votes
No reviews yet
Performance
1.CPU speed
4 x 3.6GHz
4 x 3.2GHz
The CPU speed indicates how many processing cycles per second can be executed by a CPU, considering all of its cores (processing units). It is calculated by adding the clock rates of each core or, in the case of multi-core processors employing different microarchitectures, of each group of cores.
2. CPU threads
More threads result in faster performance and better multitasking.
3.turbo clock speed
4.2GHz
3.6GHz
When the CPU is running below its limitations, it can boost to a higher clock speed in order to give increased performance.
4.Has an unlocked multiplier
✖Intel Core i3-9100
✖Intel Core i5-4570
Some processors come with an unlocked multiplier which makes them easy to overclock, allowing you to gain increased performance in games and other apps.
5.L2 cache
A larger L2 cache results in faster CPU and system-wide performance.
6.L3 cache
A larger L3 cache results in faster CPU and system-wide performance.
7.L1 cache
A larger L1 cache results in faster CPU and system-wide performance.
8.L2 core
0.25MB/core
0. 25MB/core
More data can be stored in the L2 cache for access by each core of the CPU.
9.L3 core
1.5MB/core
1.5MB/core
More data can be stored in the L3 cache for access by each core of the CPU.
Memory
1.RAM speed
2400MHz
1600MHz
It can support faster memory, which will give quicker system performance.
2.maximum memory bandwidth
37.5GB/s
25.6GB/s
This is the maximum rate that data can be read from or stored into memory.
3.DDR memory version
DDR (Double Data Rate) memory is the most common type of RAM. Newer versions of DDR memory support higher maximum speeds and are more energy-efficient.
4.memory channels
More memory channels increases the speed of data transfer between the memory and the CPU.
5. maximum memory amount
The maximum amount of memory (RAM) supported.
6.bus transfer rate
The bus is responsible for transferring data between different components of a computer or device.
7.Supports ECC memory
✔Intel Core i3-9100
✖Intel Core i5-4570
Error-correcting code memory can detect and correct data corruption. It is used when is it essential to avoid corruption, such as scientific computing or when running a server.
8.eMMC version
Unknown. Help us by suggesting a value. (Intel Core i3-9100)
Unknown. Help us by suggesting a value. (Intel Core i5-4570)
A higher version of eMMC allows faster memory interfaces, having a positive effect on the performance of a device. For example, when transferring files from your computer to the internal storage over USB.
9.bus speed
Unknown. Help us by suggesting a value. (Intel Core i3-9100)
Unknown. Help us by suggesting a value. (Intel Core i5-4570)
The bus is responsible for transferring data between different components of a computer or device.
Benchmarks
1.PassMark result
This benchmark measures the performance of the CPU using multiple threads.
2.PassMark result (single)
This benchmark measures the performance of the CPU using a single thread.
3.Geekbench 5 result (multi)
Unknown. Help us by suggesting a value. (Intel Core i5-4570)
Geekbench 5 is a cross-platform benchmark that measures a processor’s multi-core performance. (Source: Primate Labs, 2022)
4.Cinebench R20 (multi) result
Unknown. Help us by suggesting a value. (Intel Core i3-9100)
Unknown. Help us by suggesting a value. (Intel Core i5-4570)
Cinebench R20 is a benchmark tool that measures a CPU’s multi-core performance by rendering a 3D scene.
5.Cinebench R20 (single) result
Unknown. Help us by suggesting a value. (Intel Core i3-9100)
Unknown. Help us by suggesting a value. (Intel Core i5-4570)
Cinebench R20 is a benchmark tool that measures a CPU’s single-core performance by rendering a 3D scene.
6.Geekbench 5 result (single)
Unknown. Help us by suggesting a value. (Intel Core i5-4570)
Geekbench 5 is a cross-platform benchmark that measures a processor’s single-core performance. (Source: Primate Labs, 2022)
7.Blender (bmw27) result
Unknown. Help us by suggesting a value. (Intel Core i3-9100)
Unknown. Help us by suggesting a value. (Intel Core i5-4570)
The Blender (bmw27) benchmark measures the performance of a processor by rendering a 3D scene. More powerful processors can render the scene in less time.
8.Blender (classroom) result
Unknown. Help us by suggesting a value. (Intel Core i3-9100)
Unknown. Help us by suggesting a value. (Intel Core i5-4570)
The Blender (classroom) benchmark measures the performance of a processor by rendering a 3D scene. More powerful processors can render the scene in less time.
9.performance per watt
Unknown. Help us by suggesting a value. (Intel Core i5-4570)
This means the CPU is more efficient, giving a greater amount of performance for each watt of power used.
Features
1.uses multithreading
✔Intel Core i3-9100
✖Intel Core i5-4570
Multithreading technology (such as Intel’s Hyperthreading or AMD’s Simultaneous Multithreading) provides increased performance by splitting each of the processor’s physical cores into virtual cores, also known as threads. This way, each core can run two instruction streams at once.
2.Has AES
✔Intel Core i3-9100
✔Intel Core i5-4570
AES is used to speed up encryption and decryption.
3.Has AVX
✔Intel Core i3-9100
✔Intel Core i5-4570
AVX is used to help speed up calculations in multimedia, scientific and financial apps, as well as improving Linux RAID software performance.
4.SSE version
SSE is used to speed up multimedia tasks such as editing an image or adjusting audio volume. Each new version contains new instructions and improvements.
5.Has F16C
✔Intel Core i3-9100
✔Intel Core i5-4570
F16C is used to speed up tasks such as adjusting the contrast of an image or adjusting volume.
6.bits executed at a time
Unknown. Help us by suggesting a value. (Intel Core i3-9100)
Unknown. Help us by suggesting a value. (Intel Core i5-4570)
NEON provides acceleration for media processing, such as listening to MP3s.
7.Has MMX
✔Intel Core i3-9100
✔Intel Core i5-4570
MMX is used to speed up tasks such as adjusting the contrast of an image or adjusting volume.
8.Has TrustZone
✖Intel Core i3-9100
✖Intel Core i5-4570
A technology integrated into the processor to secure the device for use with features such as mobile payments and streaming video using digital rights management (DRM).
9.front-end width
Unknown. Help us by suggesting a value. (Intel Core i3-9100)
Unknown. Help us by suggesting a value. (Intel Core i5-4570)
The CPU can decode more instructions per clock (IPC), meaning that the CPU performs better
Price comparison
Cancel
Which are the best CPUs?
Intel Core i5-4590 vs. Intel Core i5-3470
Intel Core i5-4590
The Intel Core i5-4590 operates with 4 cores and 4 CPU threads. It run at 3.70 GHz base 3.50 GHz all cores while the TDP is set at 84 W.The processor is attached to the LGA 1150 CPU socket. This version includes 6.00 MB of L3 cache on one chip, supports 2 memory channels to support DDR3-1600 RAM and features 3. 0 PCIe Gen 16 lanes. Tjunction keeps below — degrees C. In particular, Haswell S Architecture is enhanced with 22 nm technology and supports VT-x, VT-x EPT, VT-d. The product was launched on Q3/2014
Intel Core i5-3470
The Intel Core i5-3470 operates with 4 cores and 4 CPU threads. It run at 3.60 GHz base 3.60 GHz all cores while the TDP is set at 77 W.The processor is attached to the LGA 1155 CPU socket. This version includes 6.00 MB of L3 cache on one chip, supports 2 memory channels to support DDR3-1600 RAM and features 3.0 PCIe Gen 16 lanes. Tjunction keeps below — degrees C. In particular, Ivy Bridge S Architecture is enhanced with 22 nm technology and supports VT-x, VT-x EPT, VT-d. The product was launched on Q2/2012
Intel Core i5-4590
Intel Core i5-3470
Compare Detail
| 3.30 GHz | Frequency | 3.20 GHz |
| 4 | Cores | 4 |
| 3.70 GHz | Turbo (1 Core) | 3. 60 GHz 60 GHz |
| 3.50 GHz | Turbo (All Cores) | 3.60 GHz |
| No | Hyperthreading | No |
| No | Overclocking | No |
| normal | Core Architecture | normal |
|
Intel HD Graphics 4600 |
GPU |
Intel HD Graphics 2500 |
| 1.10 GHz | GPU (Turbo) | 1.10 GHz |
| 22 nm | Technology | 22 nm |
| 1.10 GHz | GPU (Turbo) | 1.10 GHz |
| 11.1 | DirectX Version | 11.0 |
| 3 | Max. displays | 3 |
| DDR3-1600 | Memory | DDR3-1600 |
| 2 | Memory channels | 2 |
| Max memory | ||
| No | ECC | No |
| — | L2 Cache | — |
| 6.00 MB | L3 Cache | 6.00 MB |
| 3. 0 |
PCIe version | 3.0 |
| 16 | PCIe lanes | 16 |
| 22 nm | Technology | 22 nm |
| LGA 1150 | Socket | LGA 1155 |
| 84 W | TDP | 77 W |
| VT-x, VT-x EPT, VT-d | Virtualization | VT-x, VT-x EPT, VT-d |
| Q3/2014 | Release date | Q2/2012 |
|
Show more data |
Show more data |
Cinebench R23 (Single-Core)
Cinebench R23 is the successor of Cinebench R20 and is also based on the Cinema 4 Suite. Cinema 4 is a worldwide used software to create 3D forms. The single-core test only uses one CPU core, the amount of cores or hyperthreading ability doesn’t count.
Cinebench R23 (Multi-Core)
Cinebench R23 is the successor of Cinebench R20 and is also based on the Cinema 4 Suite. Cinema 4 is a worldwide used software to create 3D forms. The multi-core test involves all CPU cores and taks a big advantage of hyperthreading.
Cinebench R20 (Single-Core)
Cinebench R20 is the successor of Cinebench R15 and is also based on the Cinema 4 Suite. Cinema 4 is a worldwide used software to create 3D forms. The single-core test only uses one CPU core, the amount of cores or hyperthreading ability doesn’t count.
Cinebench R20 (Multi-Core)
Cinebench R20 is the successor of Cinebench R15 and is also based on the Cinema 4 Suite. Cinema 4 is a worldwide used software to create 3D forms. The multi-core test involves all CPU cores and taks a big advantage of hyperthreading.
Cinebench R15 (Single-Core)
Cinebench R15 is the successor of Cinebench 11.5 and is also based on the Cinema 4 Suite. Cinema 4 is a worldwide used software to create 3D forms. The single-core test only uses one CPU core, the amount of cores or hyperthreading ability doesn’t count.
Cinebench R15 (Multi-Core)
Cinebench R15 is the successor of Cinebench 11. 5 and is also based on the Cinema 4 Suite. Cinema 4 is a worldwide used software to create 3D forms. The multi-core test involves all CPU cores and taks a big advantage of hyperthreading.
Geekbench 5, 64bit (Single-Core)
Geekbench 5 is a cross plattform benchmark that heavily uses the systems memory. A fast memory will push the result a lot. The single-core test only uses one CPU core, the amount of cores or hyperthreading ability doesn’t count.
Geekbench 5, 64bit (Multi-Core)
Geekbench 5 is a cross plattform benchmark that heavily uses the systems memory. A fast memory will push the result a lot. The multi-core test involves all CPU cores and taks a big advantage of hyperthreading.
iGPU — FP32 Performance (Single-precision GFLOPS)
The theoretical computing performance of the internal graphics unit of the processor with simple accuracy (32 bit) in GFLOPS. GFLOPS indicates how many billion floating point operations the iGPU can perform per second.
Blender 2.81 (bmw27)
Blender is a free 3D graphics software for rendering (creating) 3D bodies, which can also be textured and animated in the software. The Blender benchmark creates predefined scenes and measures the time (s) required for the entire scene. The shorter the time required, the better. We selected bmw27 as the benchmark scene.
Geekbench 3, 64bit (Single-Core)
Geekbench 3 is a cross plattform benchmark that heavily uses the systems memory. A fast memory will push the result a lot. The single-core test only uses one CPU core, the amount of cores or hyperthreading ability doesn’t count.
Geekbench 3, 64bit (Multi-Core)
Geekbench 3 is a cross plattform benchmark that heavily uses the systems memory. A fast memory will push the result a lot. The multi-core test involves all CPU cores and taks a big advantage of hyperthreading.
Cinebench R11.5, 64bit (Single-Core)
Cinebench 11.5 is based on the Cinema 4D Suite, a software that is popular to generate forms and other stuff in 3D. The single-core test only uses one CPU core, the amount of cores or hyperthreading ability doesn’t count.
Cinebench R11.5, 64bit (Multi-Core)
Cinebench 11.5 is based on the Cinema 4D Suite, a software that is popular to generate forms and other stuff in 3D. The multi-core test involves all CPU cores and taks a big advantage of hyperthreading.
Cinebench R11.5, 64bit (iGPU, OpenGL)
Cinebench 11.5 is based on the Cinema 4D Suite, a software that is popular to generate forms and other stuff in 3D. The iGPU test uses the CPU internal graphic unit to execute OpenGL commands.
Estimated results for PassMark CPU Mark
Some of the CPUs listed below have been benchmarked by CPU-Comparison. However the majority of CPUs have not been tested and the results have been estimated by a CPU-Comparison’s secret proprietary formula. As such they do not accurately reflect the actual Passmark CPU mark values and are not endorsed by PassMark Software Pty Ltd.
Electric Usage Estimate
Average hours of use per day
Average CPU Utilization (0-100%)
Power cost, dollar per kWh
Electric Usage Estimate
Average hours of use per day
Average CPU Utilization (0-100%)
Power cost, dollar per kWh
| Intel Core i5-4590 | Intel Core i5-3470 | |
| 84 W | Max TDP | 77 W |
| NA | Power consumption per day (kWh) | NA |
| NA | Running cost per day | NA |
| NA | Power consumption per year (kWh) | NA |
| NA | Running cost per year | NA |
Popular Comparision
Comments
Comparison of Intel Core i3-9100 and Intel Core i5-4590
Comparative analysis of the Intel Core i3-9100 and Intel Core i5-4590 processors by all known characteristics in the categories: General information, Performance, Memory, Graphics, Graphic interfaces, Picture quality in graphics, Graphics API support, Compatibility, Peripherals, Security and reliability , Technology, Virtualization.
Analysis of processor performance by benchmarks: PassMark — Single thread mark, PassMark — CPU mark, Geekbench 4 — Single Core, Geekbench 4 — Multi-Core, GFXBench 4.0 — Car Chase Offscreen (Frames), GFXBench 4.0 — Manhattan (Frames), GFXBench 4.0 — T-Rex (Frames), GFXBench 4.0 — Car Chase Offscreen (Fps), GFXBench 4.0 — Manhattan (Fps), GFXBench 4.0 — T-Rex (Fps), 3DMark Fire Strike — Physics Score, CompuBench 1.5 Desktop — Face Detection ( mPixels/s), CompuBench 1.5 Desktop — Ocean Surface Simulation (Frames/s), CompuBench 1.5 Desktop — T-Rex (Frames/s), CompuBench 1.5 Desktop — Video Composition (Frames/s), CompuBench 1.5 Desktop — Bitcoin Mining ( mHash/s).
Intel Core i3-9100
versus
Intel Core i5-4590
Benefits
Reasons to choose Intel Core i3-9100
- Newer processor, 4 year(s) 11 month(s) approx.
 frequency: 4.20 GHz vs 3.70 GHz
 - Approximately 38% higher maximum core temperature: 100°C vs 72.72°C
- A newer process of manufacturing the processor allows it to be more powerful, but with lower power consumption: 14 nm vs 22 nm
- 2x more memory max size(s): 64 GB vs 32 GB
- About 29% less power consumption: 65 Watt vs 84 Watt
- About 20% more PassMark — Single thread mark performance: 2514 vs 2090
- Approximately 24% increase in PassMark — CPU mark performance: 6629 vs 5350
- Approx. 16% more: 3267 vs 2820
- About 50% more performance in GFXBench 4.0 — Car Chase Offscreen (Frames): 1602 vs 1067
- About 36% more performance in GFXBench 4.0 — Manhattan (Frames): 2758 vs 2023
- GFXBenchmark performance 4.0 — T-Rex (Frames) about 48% more: 5007 vs 3383
- GFXBench 4.0 performance — Car Chase Offscreen (Fps) about 50% more: 1602 vs 1067
- GFXBench 4.0 performance — Manhattan ( Fps) about 36% more: 2758 vs 2023
- GFXBench 4.
 0 performance — T-Rex (Fps) approximately 48% higher: 5007 vs 3383
| Release date | 23 Apr 2019 vs May 2014 |
| Maximum frequency | 4.20 GHz vs 3.70 GHz |
| Maximum core temperature | 100°C vs 72.72°C |
| Process | 14 nm vs 22 nm |
| Maximum memory size | 64 GB vs 32 GB |
| Power consumption (TDP) | 65 Watt vs 84 Watt |
| PassMark — Single thread mark | 2514 vs 2090 |
| PassMark — CPU mark | 6629 vs 5350 |
| Geekbench 4 — Single Core | 1068 vs 876 |
| Geekbench 4 — Multi-Core | 3267 vs 2820 |
GFXBench 4. 0 — Car Chase Offscreen (Frames) 0 — Car Chase Offscreen (Frames) |
1602 vs 1067 |
| GFXBench 4.0 — Manhattan (Frames) | 2758 vs 2023 |
| GFXBench 4.0 — T-Rex (Frames) | 5007 vs 3383 |
| GFXBench 4.0 — Car Chase Offscreen (Fps) | 1602 vs 1067 |
| GFXBench 4.0 — Manhattan (Fps) | 2758 vs 2023 |
| GFXBench 4.0 — T-Rex (Fps) | 5007 vs 3383 |
Benchmark comparison
CPU 1: Intel Core i3-9100
CPU 2: Intel Core i5-4590
| PassMark — Single thread mark |
|
|||
| PassMark — CPU mark |
|
|||
| Geekbench 4 — Single Core |
|
|||
| Geekbench 4 — Multi-Core |
|
|||
GFXBench 4. 0 — Car Chase Offscreen (Frames) 0 — Car Chase Offscreen (Frames) |
|
|||
| GFXBench 4.0 — Manhattan (Frames) |
|
|||
| GFXBench 4.0 — T-Rex (Frames) |
|
|||
| GFXBench 4.0 — Car Chase Offscreen (Fps) |
|
|||
GFXBench 4. 0 — Manhattan (Fps) 0 — Manhattan (Fps) |
|
|||
| GFXBench 4.0 — T-Rex (Fps) |
|
| Name | Intel Core i3-9100 | Intel Core i5-4590 |
|---|---|---|
| PassMark — Single thread mark | 2514 | 2090 |
| PassMark — CPU mark | 6629 | 5350 |
| Geekbench 4 — Single Core | 1068 | 876 |
| Geekbench 4 — Multi-Core | 3267 | 2820 |
GFXBench 4. 0 — Car Chase Offscreen (Frames) 0 — Car Chase Offscreen (Frames) |
1602 | 1067 |
| GFXBench 4.0 — Manhattan (Frames) | 2758 | 2023 |
| GFXBench 4.0 — T-Rex (Frames) | 5007 | 3383 |
| GFXBench 4.0 — Car Chase Offscreen (Fps) | 1602 | 1067 |
| GFXBench 4.0 — Manhattan (Fps) | 2758 | 2023 |
| GFXBench 4.0 — T-Rex (Fps) | 5007 | 3383 |
| 3DMark Fire Strike — Physics Score | 2840 | |
| CompuBench 1. 5 Desktop — Face Detection (mPixels/s) |
3.798 | |
| CompuBench 1.5 Desktop — Ocean Surface Simulation (Frames/s) | 71.742 | |
| CompuBench 1.5 Desktop — T-Rex (Frames/s) | 0.404 | |
| CompuBench 1.5 Desktop — Video Composition (Frames/s) | 2.137 | |
| CompuBench 1.5 Desktop — Bitcoin Mining (mHash/s) | 6.131 |
Performance comparison
| Intel Core i3-9100 | Intel Core i5-4590 | |
|---|---|---|
| Architecture name | Coffee Lake | Haswell |
| Issue date | 23 Apr 2019 | May 2014 |
| Price at first issue date | $122 | $300 |
| Place in the ranking | 630 | 1305 |
| Processor Number | i3-9100 | i5-4590 |
| Series | 9th Generation Intel Core i3 Processors | 4th Generation Intel® Core™ i5 Processors |
| Status | Launched | Discontinued |
| Applicability | Desktop | Desktop |
| Price now | $188. 99 99 |
|
| Price/performance ratio (0-100) | 11.38 | |
| Support 64 bit | ||
| Base frequency | 3.60 GHz | 3.30 GHz |
| Bus Speed | 8 GT/s | 5 GT/s DMI2 |
| Level 1 cache | 256KB | 64 KB (per core) |
| Level 2 cache | 1MB | 256 KB (per core) |
| Level 3 cache | 6MB | 6144 KB (shared) |
| Process | 14nm | 22 nm |
| Maximum case temperature (TCase) | 72 °C | 72 °C |
| Maximum core temperature | 100°C | 72. 72°C 72°C |
| Maximum frequency | 4.20 GHz | 3.70 GHz |
| Number of cores | 4 | 4 |
| Number of threads | 4 | 4 |
| Crystal area | 177mm | |
| Number of transistors | 1400 million | |
| ECC support | ||
| Maximum number of memory channels | 2 | 2 |
| Maximum memory bandwidth | 37. 5 GB/s 5 GB/s |
25.6 GB/s |
| Maximum memory size | 64GB | 32GB |
| Supported memory types | DDR4-2400 | DDR3-1333/1600, DDR3L-1333/1600 @ 1.5V |
| Device ID | 0x3E91 | 0x412 |
| Graphics base frequency | 350MHz | 350MHz |
| Graphics max dynamic frequency | 1.10 GHz | 1.15GHz |
| Intel® Clear Video HD Technology | ||
| Intel® Clear Video Technology | ||
| Intel® InTru™ 3D Technology | ||
| Intel® Quick Sync Video | ||
| Video memory size | 64GB | 2GB |
| Integrated graphics | Intel UHD Graphics 630 | Intel® HD Graphics 4600 |
| Maximum GPU clock | 1. 15GHz 15GHz |
|
| Intel® Flexible Display Interface (Intel® FDI) | ||
| Maximum number of monitors supported | 3 | 3 |
| DisplayPort | ||
| eDP | ||
| HDMI | ||
| VGA | ||
| WiDi support | ||
| 4K support | ||
| Maximum resolution via DisplayPort | [email protected] | [email protected] |
| Maximum resolution via eDP | [email protected] | [email protected] |
Maximum resolution via HDMI 1. 4 4 |
[email protected] | [email protected] |
| Maximum resolution via VGA | [email protected] | |
| DirectX | 12 | 11.2/12 |
| OpenGL | 4.5 | 4.3 |
| Maximum number of processors per configuration | 1 | 1 |
| Package Size | 37.5mm x 37.5mm | 37.5mm x 37.5mm |
| Supported sockets | FCLGA1151 | FCLGA1150 |
| Power consumption (TDP) | 65 Watt | 84 Watt |
| Thermal Solution | PCG 2015C (65W) | PCG 2013D |
| Low Halogen Options Available | ||
| Number of PCI Express lanes | 16 | 16 |
| PCI Express revision | 3. 0 0 |
Up to 3.0 |
| PCIe configurations | Up to 1×16, 2×8, 1×8+2×4 | Up to 1×16, 2×8, 1×8+2×4 |
| Scalability | 1S Only | 1S Only |
| Execute Disable Bit (EDB) | ||
| Intel® Identity Protection Technology | ||
| Intel® Memory Protection Extensions (Intel® MPX) | ||
| Intel® OS Guard | ||
| Intel® Secure Key Technology | ||
| Intel® Software Guard Extensions (Intel® SGX) | ||
| Intel® Trusted Execution Technology (TXT) | ||
| Secure Boot | ||
| Anti-Theft Technology | ||
| Enhanced Intel SpeedStep® Technology | ||
| Idle States | ||
| Extended instructions | Intel SSE4. 1, Intel SSE4.2, Intel AVX2 1, Intel SSE4.2, Intel AVX2 |
Intel® SSE4.1, Intel® SSE4.2, Intel® AVX2 |
| Intel 64 | ||
| Intel® Advanced Vector Extensions (AVX) | ||
| Intel® AES New Instructions | ||
| Intel® Hyper-Threading Technology | ||
| Intel® Optane™ Memory Supported | ||
| Intel® Stable Image Platform Program (SIPP) | ||
| Intel® TSX-NI | ||
| Intel® Turbo Boost Technology | ||
| Intel® vPro™ Platform Eligibility | ||
| Thermal Monitoring | ||
| Flexible Display interface (FDI) | ||
| Intel® My WiFi Technology | ||
| Intel® Virtualization Technology (VT-x) | ||
| Intel® Virtualization Technology for Directed I/O (VT-d) | ||
| Intel® VT-x with Extended Page Tables (EPT) |
Comparison of Intel Core i3-9100F and Intel Core i5-4590
Comparative analysis of the Intel Core i3-9100F and Intel Core i5-4590 processors by all known characteristics in the categories: General information, Performance, Memory, Compatibility, Peripherals, Security and reliability, Technology, Virtualization, Graphics, Graphical interfaces, Image quality in graphics , Graphics API support.
Analysis of processor performance by benchmarks: PassMark — Single thread mark, PassMark — CPU mark, Geekbench 4 — Single Core, Geekbench 4 — Multi-Core, 3DMark Fire Strike — Physics Score, CompuBench 1.5 Desktop — Face Detection (mPixels/s), CompuBench 1.5 Desktop — Ocean Surface Simulation (Frames/s), CompuBench 1.5 Desktop — T-Rex (Frames/s), CompuBench 1.5 Desktop — Video Composition (Frames/s), CompuBench 1.5 Desktop — Bitcoin Mining (mHash/s), GFXBench 4.0 — Car Chase Offscreen (Frames), GFXBench 4.0 — Manhattan (Frames), GFXBench 4.0 — T-Rex (Frames), GFXBench 4.0 — Car Chase Offscreen (Fps), GFXBench 4.0 — Manhattan (Fps), GFXBench 4.0 — T- Rex (Fps).
Intel Core i3-9100F
versus
Intel Core i5-4590
Benefits
Reasons to choose Intel Core i3-9100F
- Newer processor, approx. frequency: 4.20 GHz vs 3.
 70 GHz
 - Approximately 38% higher maximum core temperature: 100 °C vs 72.72°C
- A newer process of manufacturing the processor allows it to be more powerful, but with lower power consumption: 14 nm vs 22 nm
- 2x more max memory size: 64 GB vs 32 GB
- About 29% less power consumption: 65 Watt vs 84 Watt
- About 20% more PassMark — Single thread mark performance: 2516 vs 2090
- Approximately 27% more performance in PassMark — CPU mark: 6771 vs 5350
- Approximately 23% improvement in Geekbench 4 — Single Core performance: 1078 vs 876
- 20% more: 3394 vs 2820
- 3DMark Fire Strike — Physics Score performance about 29% better: 3666 vs 2840
| Release date | 23 April 2019 vs May 2014 |
| Maximum frequency | 4.20 GHz vs 3.70 GHz |
| Maximum core temperature | 100°C vs 72. 72°C 72°C |
| Process | 14 nm vs 22 nm |
| Maximum memory size | 64 GB vs 32 GB |
| Power consumption (TDP) | 65 Watt vs 84 Watt |
| PassMark — Single thread mark | 2516 vs 2090 |
| PassMark — CPU mark | 6771 vs 5350 |
| Geekbench 4 — Single Core | 1078 vs 876 |
| Geekbench 4 — Multi-Core | 3394 vs 2820 |
| 3DMark Fire Strike — Physics Score | 3666 vs 2840 |
Benchmark comparison
CPU 1: Intel Core i3-9100F
CPU 2: Intel Core i5-4590
| PassMark — Single thread mark |
|
|||
| PassMark — CPU mark |
|
|||
| Geekbench 4 — Single Core |
|
|||
| Geekbench 4 — Multi-Core |
|
|||
| 3DMark Fire Strike — Physics Score |
|
| Name | Intel Core i3-9100F | Intel Core i5-4590 |
|---|---|---|
| PassMark — Single thread mark | 2516 | 2090 |
| PassMark — CPU mark | 6771 | 5350 |
| Geekbench 4 — Single Core | 1078 | 876 |
| Geekbench 4 — Multi-Core | 3394 | 2820 |
| 3DMark Fire Strike — Physics Score | 3666 | 2840 |
CompuBench 1. 5 Desktop — Face Detection (mPixels/s) 5 Desktop — Face Detection (mPixels/s) |
3.798 | |
| CompuBench 1.5 Desktop — Ocean Surface Simulation (Frames/s) | 71.742 | |
| CompuBench 1.5 Desktop — T-Rex (Frames/s) | 0.404 | |
| CompuBench 1.5 Desktop — Video Composition (Frames/s) | 2.137 | |
| CompuBench 1.5 Desktop — Bitcoin Mining (mHash/s) | 6.131 | |
| GFXBench 4.0 — Car Chase Offscreen (Frames) | 1067 | |
GFXBench 4. 0 — Manhattan (Frames) 0 — Manhattan (Frames) |
2023 | |
| GFXBench 4.0 — T-Rex (Frames) | 3383 | |
| GFXBench 4.0 — Car Chase Offscreen (Fps) | 1067 | |
| GFXBench 4.0 — Manhattan (Fps) | 2023 | |
| GFXBench 4.0 — T-Rex (Fps) | 3383 |
Performance comparison
| Intel Core i3-9100F | Intel Core i5-4590 | |
|---|---|---|
| Architecture name | Coffee Lake | Haswell |
| Issue date | 23 April 2019 | May 2014 |
| Price at first issue date | $389 | $300 |
| Place in the ranking | 851 | 1305 |
| Processor Number | i3-9100F | i5-4590 |
| Applicability | Desktop | Desktop |
| Price now | $188. 99 99 |
|
| Series | 4th Generation Intel® Core™ i5 Processors | |
| Status | Discontinued | |
| Price/performance ratio (0-100) | 11.38 | |
| Support 64 bit | ||
| Base frequency | 3.60 GHz | 3.30 GHz |
| Bus Speed | 8 GT/s DMI | 5 GT/s DMI2 |
| Process | 14nm | 22 nm |
| Maximum core temperature | 100 °C | 72. 72°C 72°C |
| Maximum frequency | 4.20 GHz | 3.70 GHz |
| Number of cores | 4 | 4 |
| Number of threads | 4 | 4 |
| Unlocked | ||
| Crystal area | 177mm | |
| Level 1 cache | 64 KB (per core) | |
| Level 2 cache | 256 KB (per core) | |
| Level 3 cache | 6144 KB (shared) | |
| Maximum case temperature (TCase) | 72 °C | |
| Number of transistors | 1400 million | |
| ECC support | ||
| Maximum number of memory channels | 2 | 2 |
| Maximum memory bandwidth | 37. 5 GB/s 5 GB/s |
25.6 GB/s |
| Maximum memory size | 64GB | 32GB |
| Supported memory types | DDR4-2400 | DDR3-1333/1600, DDR3L-1333/1600 @ 1.5V |
| Maximum number of processors in configuration | 1 | 1 |
| Supported sockets | FCLGA1151 | FCLGA1150 |
| Power consumption (TDP) | 65 Watt | 84 Watt |
| Low Halogen Options Available | ||
| Package Size | 37. 5mm x 37.5mm 5mm x 37.5mm |
|
| Thermal Solution | PCG 2013D | |
| Number of PCI Express lanes | 16 | 16 |
| PCI Express revision | 3.0 | Up to 3.0 |
| PCIe configurations | 1×16, 2×8, 1×8+2×4 | Up to 1×16, 2×8, 1×8+2×4 |
| Scalability | 1S Only | |
| Execute Disable Bit (EDB) | ||
| Intel® Identity Protection Technology | ||
| Intel® Memory Protection Extensions (Intel® MPX) | ||
| Intel® OS Guard | ||
| Intel® Secure Key Technology | ||
| Intel® Software Guard Extensions (Intel® SGX) | ||
| Intel® Trusted Execution Technology (TXT) | ||
| Anti-Theft Technology | ||
| Enhanced Intel SpeedStep® Technology | ||
| Idle States | ||
| Extended instructions | Intel SSE4.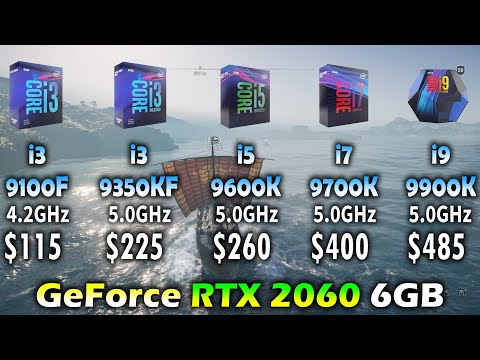 1, Intel SSE4.2, Intel AVX2 1, Intel SSE4.2, Intel AVX2 |
Intel® SSE4.1, Intel® SSE4.2, Intel® AVX2 |
| Integrated Intel® QuickAssist Technology | ||
| Intel® AES New Instructions | ||
| Intel® Hyper-Threading Technology | ||
| Intel® Optane™ Memory Supported | ||
| Intel® Stable Image Platform Program (SIPP) | ||
| Intel® TSX-NI | ||
| Intel® Turbo Boost Technology | ||
| Intel® vPro™ Platform Eligibility | ||
| Thermal Monitoring | ||
| Flexible Display interface (FDI) | ||
| Intel 64 | ||
| Intel® Advanced Vector Extensions (AVX) | ||
| Intel® My WiFi Technology | ||
| Intel® Virtualization Technology (VT-x) | ||
| Intel® Virtualization Technology for Directed I/O (VT-d) | ||
| Intel® VT-x with Extended Page Tables (EPT) | ||
| Device ID | 0x412 | |
| Graphics base frequency | 350MHz | |
| Graphics max dynamic frequency | 1. 15GHz 15GHz |
|
| Maximum GPU clock | 1.15GHz | |
| Intel® Clear Video HD Technology | ||
| Intel® Flexible Display Interface (Intel® FDI) | ||
| Intel® InTru™ 3D Technology | ||
| Intel® Quick Sync Video | ||
| Video memory size | 2GB | |
| Integrated graphics | Intel® HD Graphics 4600 | |
| DisplayPort | ||
| eDP | ||
| HDMI | ||
| Maximum number of monitors supported | 3 | |
| VGA | ||
| WiDi support | ||
| Maximum resolution via DisplayPort | [email protected] | |
| Maximum resolution via eDP | [email protected] | |
Maximum resolution via HDMI 1. 4 4 |
[email protected] | |
| Maximum resolution via VGA | [email protected] | |
| DirectX | 11.2/12 | |
| OpenGL | 4.3 |
i5-4590 vs i3-9100F — Call of Duty Modern Warfare vs GTX 1660 performance comparison
GTX 1660 with
Intel Core i5-4590 @ 3.30GHz
Call of Duty Modern Warfare
GTX 1660 with
Intel Core i3-9100F @ 3.60GHz
i5-4590
i3-9100F
Multi-Thread Performance
7296 Pts
8988 Pts
Single-Thread Performance
2113 Pts
2343 Pts
Call of Duty Modern Warfare
i5-4590 vs i3-9100F Call of Duty Modern Warfare using GTX 1660 — CPU performance comparison at Ultra, High, Medium and Low Quality settings at 1080p, 1440p, Ultrawide, 4K
i5-4590
i3-9100F
Ultra quality
| Resolution | Frames per second |
|---|---|
| 1080p |
88. |
| 1080p |
101.0 FPS |
| 1440p |
64.0 FPS |
| 1440p |
72.7 FPS |
| 2160p |
38.2 FPS |
| 2160p |
43.4 FPS |
| w1440p |
54.7 FPS |
| w1440p |
62.1 FPS |
 8 FPS
8 FPS High quality
| Resolution | Frames per second |
|---|---|
| 1080p |
142.6 FPS |
| 1080p |
158.9FPS |
| 1440p |
108.0 FPS |
| 1440p |
120.3 FPS |
| 2160p |
69.4 FPS |
| 2160p |
77.4 FPS |
| w1440p |
94.4 FPS |
| w1440p |
105. |
 2 FPS
2 FPS Medium quality
| Approval | Frames per second |
|---|---|
| 1080p |
196.3 FPS |
| 1080p |
216.8 FPS |
| 1440p |
152.0 FPS |
| 1440p |
168.0 FPS |
| 2160p |
100.6 FPS |
| 2160p |
111.5 FPS |
| w1440p |
134.2 FPS |
| w1440p |
148.4 FPS |
Low quality
| Resolution | Frames per second |
|---|---|
| 1080p |
303.8 FPS |
| 1080p |
332.6 FPS |
| 1440p |
239.9 FPS |
| 1440p |
263. |
| 2160p |
162.9 FPS |
| 2160p |
179.6 FPS |
| w1440p |
213.7 FPS |
| w1440p |
234.7 FPS |
 3 FPS
3 FPS i5-4590
i3-9100F
Compare i5-4590 vs i3-9100F specifications
Share your comments 91
Compare i5-4590 vs i3-9100F in more games
Elden Ring
2022
God of War
2022
Overwatch 2
2022
Forza Horizon 5
2021
Halo Infinite
2021
Battlefield 2042
2021
Assassin’s Creed Valhalla
2020
Microsoft Flight Simulator
2020
Valorant
2020
Call of Duty: Black Ops Cold War
2020
Death Stranding
2020
Marvel’s Avengers
2020
Godfall
2020
Cyberpunk 2077
2020
Apex Legends
2019
Anthem
2019
Far Cry New Dawn
2019
Resident Evil 2
2019
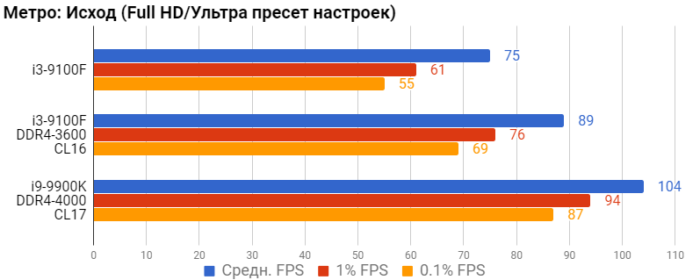
Metro Exodus
2019
World War Z
2019
Gears of War 5
2019
F1 2019
2019
GreedFall
2019
Borderlands 3
2019
Call of Duty Modern Warfare
2019
Red Dead Redemption 2
2019
Need For Speed: Heat
2019
Assassin’s Creed Odyssey
2018
Battlefield V
2018
Call of Duty: Black Ops 4
2018
Final Fantasy XV
2018
Shadow of the Tomb Raider
2018
Forza Horizon 4
2018
Fallout 76
2018
Hitman 2
2018
Just Cause 4
2018
Monster Hunter: World
2018
Strange Brigade
2018
Assassin’s Creed Origins
2017
Dawn of War III
2017
Ghost Recon Wildlands
2017
Destiny 2
2017
PlayerUnknown’s Battlegrounds
2017
Fortnite Battle Royale
2017
Need for Speed: Payback
2017
For Honor
2017
Project CARS 2
2017
Forza Motorsport 7
2017
Ashes of the Singularity: Escalation
2016
Battlefield 1
2016
Deus Ex: Mankind Divided
2016
Doom
2016
F1 2016
2016
Total War: Warhammer
2016
Overwatch
2016
Dishonored 2
2016
Grand Theft Auto V
2015
Rocket League
2015
Need For Speed
2015
Project CARS
2015
Rainbow Six Siege
2015
Counter-Strike: Global Offensive
2012
League of Legends
2009
Minecraft
2009
Intel Core i3-9100F vs Intel Core i5-4590 processor comparison in 14 benchmarks
Specifications and benchmarks comparison 3. 30GHz DDR3-1600
Intel Core i3-9100F
Intel Core i5-4590
Intel Core i3-9100F vs. Intel Core i5-4590
Processor cores and base frequency
When comparing Intel Core i3-9100F and Intel Core i5-4590, you should choose a model with a large number of cores and threads with base and turbo frequency. All functions affect system performance.
4 / 4
Processor Threads
4 / 4
No
Hyper Threads
No
No
Acceleration
No
3.60 GHZ
Frequency
3.30 GHZ
4.20 GHZ
Turbbo
3.70 GHZ
9000 3.80 GHZ
turbo 9000 3.50 GHZ 9000 3.50 GHZ
Intel Core i3-9100F vs. Intel Core i5-4590
CPU generation and family
4
Processor cores
4
ca. 97 $
Market price
ca. 175 $
Generation
7. 5
5
Intel Core i3-9100F vs. Intel Core i5-4590
Internal graphics
Some manufacturers include a graphics core in many processors, which is an added benefit. If you are using a graphics card separate from the CPU, we recommend that you skip this comparison as there is no need to compare the Intel Core i3-9100F to the Intel Core i5-4590 for integrated graphics.
GPU name
Intel HD Graphics 4600
Frequency of the graphic processor
0.35 GHZ
NO TURBO
GP (turbo)
1.10 GHZ
Fulfillment units
20
Shader
160
Maximum. displays
3
generation
7.5
Direct X
11.1
Technology
22 NM
Date of release
Q2/2013
Intel Core i3-9100f vs. Intel Core i5-4590
Hardware codec support
Pay attention to the support of different technology options by processors. Does not affect overall performance. In the interest of saving time, you can skip this section.
NO
H365 8 BIT
NO
No
H365 10 bits
No
NO
H364
Decode / Encode No.
No.
AVC
Decode / Encode
No
VK-1
Decode
No
JPEG
Decode
Intel Core i3-9100F vs. Intel Core i5-4590
RAM and PCIe
Modern processors support multi-channel memory for fast data transfer and improved performance. The higher the clock speed of the RAM, its standard (for example, DDR3, DDR4, DDR5) and the maximum amount in the system, the better it is.
3.0
PCI-version
3.0
16
Lines PCIE
16
DDR4-2400
Memorial type
DDR3-1600
64 GB
maximum. Memory
32 GB
2
Memory channels
2
YES
ECC
NO
YES
NPES
YES
Intel Core i3-9100f vs. Intel Core i5-4590
Thermal management
High performance and powerful processors require a good power supply. Here you will find out how many TDPs the Intel Core i3-9100F and Intel Core i5-4590 have. We recommend to pay attention to the model with a lower TDP.
65 W
Called capacity
84 W
—
TDP up
—
—
TDP
—
100 ° C
Max compound.
—
Intel Core i3-9100F vs. Intel Core i5-4590
Technical details
Here is the basic information that can determine the best processor by comparing specifications. Thus, the higher the L2 and L3 cache, the better. The lower the CPU manufacturing process, the better it is. An important factor is the year of manufacture, which directly affects the terms of support by the manufacturer and the possibility of upgrading the system with minimal costs in the future.
6.00 MB
L3 cache
6.00 MB
Coffee Lake Refresh
Architecture
Haswell Refresh
14 NM
Technology
22 NM
VT-X, VT-X EPT, VT-D
9000 VT-X, VT-X EPT, VT-X EPT, VT-X EPT, VT-X EPT, VT, CEPT, VT-X EPT, COMP VT-d
LGA 1151
Socket
LGA 1150
Q2/2019
Release date
Q3/2014
Intel0 Core i3-910 Intel Core i5-4590
Devices using this processor
Comparing between Intel Core i3-9100F and Intel Core i5-4590, you can find out which computer systems use these models.
Unknown
Used in
Unknown
Cinebench R20 (single core)
The version that has become the gold standard of the synthetic benchmark allows you to fairly accurately determine the performance of the processor in the Cinema 4 Suite software package. The highest score means the best performance of the model. Hyperthreading is not enabled.
Intel Core i3-9100F
4x 3.60 GHz (4.20 GHz)
445 (100%)
Intel Core i5-4590
4x 3.30 GHz (3.70 GHz)
319 (71%)
Cinebench R20 (multi-core)
This is the CPU performance test standard from Maxon. This is a specialized multi-platform set of tests that evaluate the power of all processor cores in rendering mode.
Intel Core i3-9100F
4x 3.60 GHz (4.20 GHz)
1630 (100%)
Intel Core i5-4590
4x 3.30 GHz (3.70 GHz)
1227 (75%)
Cinebench R15 (single core)
Cinebench R15 is Maxon’s actual benchmark for older CPUs that tests CPU performance without hyper-threading in single core mode.
Intel Core i3-9100F
4x 3.60 GHz (4.20 GHz)
Intel Core i5-4590
4x 3. 30 GHz (3.70 GHz)
144 (100%)
Cinebench R15 (multi-core)
Cinebench R15 benchmark reflects the performance of your processor in test mode. Runs on an older version of Cinema 4 Suite. Hyperthreading is not enabled.
Intel Core i3-9100F
4x 3.60 GHz (4.20 GHz)
660 (100%)
Intel Core i5-4590
4x 3.30 GHz (3.70 GHz)
505 (76%)
iGPU — FP32 performance (single precision gigaflops)
The benchmark is designed to determine the performance and speed of video cards built into their central processor. Works in iGPU mode, FP32 performance. The higher the rate, the better.
Intel Core i3-9100F
4x 3.60 GHz (4.20 GHz)
Intel Core i5-4590
4x 3.30 GHz (3.70 GHz)
352 (100%)
Geekbench 5 64 bit (single core)
A new approach to CPU benchmarking opens GeekBench 5! A detailed analysis of the system under load provides an accurate assessment of quality. The higher the score, the faster and more efficient the processor is. This is a version for testing one core.
Intel Core i3-9100F
4x 3. 60 GHz (4.20 GHz)
1086 (100%)
Intel Core i5-4590
4x 3.30 GHz (3.70 GHz)
877 (80%)
Geekbench 5 64 bit (multi-core)
The modern version of the GeekBench 5 benchmark reveals all the possibilities and potential of your processor. As a result of testing, you will be able to understand how fast and efficient the processor is in working with graphic applications or games.
Intel Core i3-9100F
4x 3.60 GHz (4.20 GHz)
3459 (100%)
Intel Core i5-4590
4x 3. 30 GHz (3.70 GHz)
2819 (81%)
Blender 2.81 (bmw27)
Blender 2.81 Universal Benchmark (bmw27) starts CPU testing when rendering animated 3D images. The faster the processor completes a task, the higher the overall performance score.
Intel Core i3-9100F
4x 3.60 GHz (4.20 GHz)
6340 (93%)
Intel Core i5-4590
4x 3.30 GHz (3.70 GHz)
6775 (100%)
Geekbench 3 64 bit (single core)
To determine how efficient and powerful a processor is among several models or in comparison with another, we recommend that you pay attention to the Geekbench 3 benchmark, which tests the performance of a single core processor.
Intel Core i3-9100F
4x 3.60 GHz (4.20 GHz)
Intel Core i5-4590
4x 3.30 GHz (3.70 GHz)
3412 (100%)
Geekbench 3 64-bit (multi-core)
To unleash the full potential of the hardware, Geekbench 3 benchmark uses all the cores for 64-bit models in a specialized software package that simulates the simulation of various 3D scenarios. The higher the score, the better the performance.
Intel Core i3-9100F
4x 3.60 GHz (4.20 GHz)
Intel Core i5-4590
4x 3. 30 GHz (3.70 GHz)
10726 (100%)
Cinebench R11.5 64 bit (single core)
Cinebench R11.5 is an outdated version of the benchmark for previous generation processors. To find out the potential or compare it with a modern processor model, just check the performance score. The higher it is, the better. Hyperthreading is not enabled.
Intel Core i3-9100F
4x 3.60 GHz (4.20 GHz)
Intel Core i5-4590
4x 3.30 GHz (3.70 GHz)
162 (100%)
Cinebench R11.5 64 bit (multi-core)
Cinebench R11.5 benchmark is designed to test early generation processors. Overall final performance based on 3D scene simulation in Cinema 4 Suite. It uses all the processor cores.
Intel Core i3-9100F
4x 3.60 GHz (4.20 GHz)
Intel Core i5-4590
4x 3.30 GHz (3.70 GHz)
572 (100%)
Cinebench R11.5 64bit (iGPU, OpenGL)
The classic benchmark is designed to test the integrated graphics processor operating in the OpenGL standard.
Intel Core i3-9100F
4x 3.60 GHz (4.20 GHz)
Intel Core i5-4590
4x 3. 30 GHz (3.70 GHz)
192 (100%)
PassMark results for processors
The authoritative PassMark benchmark shows how efficient the processor is in the overall performance rating. It takes into account the mode of operation of all cores and supports hyper-threading. The benchmark is based on various scenarios for performing calculations, 2D and 3D modeling.
Intel Core i3-9100F
4x 3.60 GHz (4.20 GHz)
8940 (100%)
Intel Core i5-4590
4x 3.30 GHz (3.70 GHz)
7284 (81%)
Popular comparisons with these processors
one.
|
Intel Core i3-10100F vs. Intel Core i3-9100F |
|
| 2. |
AMD A10-5757M vs. Intel Core i3-9100F |
|
| 3. |
Intel Pentium 7505 Intel Core i5-4590 |
|
four.
|
Intel Core i3-9100F vs. Intel Core i3-3130M |
|
| 5. |
Intel Core i3-9100F vs. Intel Core i3-8109U |
|
6.
|
Intel Core i3-10320 vs. Intel Core i3-9100F |
|
| 7. |
Intel Core i7-3770S vs. Intel Core i5-4590 |
Intel Core i3-9100F vs Intel Core i5-4570S: What is the difference?
49 BALLLA
Intel Core i3-9100f
38 Ballla
Intel Core i5-4570S
VS
64 Facts compared to
Intel i3-9100f
4 9000. 900S 900S 9000S Is the 9100F better than the Intel Core i5-4570S?
- 24.14% faster CPU speed?
4 x 3.6GHz vs 4 x 2.9GHz - 800MHz higher RAM speed?
2400MHz vs 1600MHz - Semiconductor size 8nm smaller?
14nm vs 22nm - 0.6GHz higher turbo clock speed? more memory bandwidth?
4.2GHz vs 3.6GHz - 37.5GB/s vs 25.6GB/s
- 25.35% higher PassMark result (single)?
2532 vs 2020 - 32GB more than the maximum memory?
64GB vs 32GB - Supports memory debug code?
Why is Intel Core i5-4570S better than Intel Core i3-9100F?
- Has integrated graphics?
What are the most popular comparisons?
AMD Ryzen 5 5500U
vs
Intel Core i5-1135G7
AMD Ryzen 3 3250U
vs
Intel Core i3-1115G4
AMD RYZEN 3 5300U
VS
Intel Core i3-1115g4
AMD Ryzen 7 3700U
VS
Intel Core i5-10210u
AMD Ryzen 7 3700U
VS 9000 VS 9000 VS 9000 VS 9000 VS 9000 VS 9000 VS 9000 VS 9000 VS 9000 VS 9000 VS 9000 VS 9000 VS 9000 VS 9000 VS 9000 VS 9000 VS 9000) AMD RYZEN 5 4600H
VS
Intel Core i5-10300H
Intel Core i3-1115g4
VS
Intel Core i5-10210u
AMD Ryzen 5 3500U
INTEL CORE CORE INTEL CORE Ryzen 5 5500U
VS
Intel Core i3-1115g4
AMD Ryzen 7 5800h
VS
Intel Core i7-11800H
Reviews of users
General rating
Intel Core INTEL CORETEL COREE
Intel Core i3-9100F
10. 0 /10
0 /10
3 User reviews0002 0.0 /10
0 reviews of users
Functions
Price and quality ratio
8.3 /10
3 Votes
Reviews yet not
9000 9000 9000 9000 9000 9000 9000 9000 9000 9000 9000 9000 9000 3 VOTES
reviews not yet
performance
10.0 /10
3 votes
reviews yet there are no
Reliability
0002 9.7 /10
3 Votes
Reviews yet not
Energy efficiency
10.0 /10
9000 3 Votes 9000 4 x 3.6GHz
4 x 2.9GHz
CPU speed indicates how many processing cycles per second a processor can perform, considering all its cores (processors). It is calculated by adding the clock speeds of each core or, in the case of multi-core processors, each group of cores.
2nd processor thread
More threads result in better performance and better multitasking.
3.speed turbo clock
4.2GHz
3.6GHz
When the processor is running below its limits, it can jump to a higher clock speed to increase performance.
4. Has unlocked multiplier
✖Intel Core i3-9100F
✖Intel Core i5-4570S
Some processors come with an unlocked multiplier and are easier to overclock, allowing you to get better performance in games and other applications.
5.L2 Cache
More L2 scratchpad memory results in faster results in CPU and system performance tuning.
6.L3 cache
More L3 scratchpad memory results in faster results in CPU and system performance tuning.
7.L1 cache
More L1 cache results in faster results in CPU and system performance tuning.
8.core L2
0.25MB/core
0.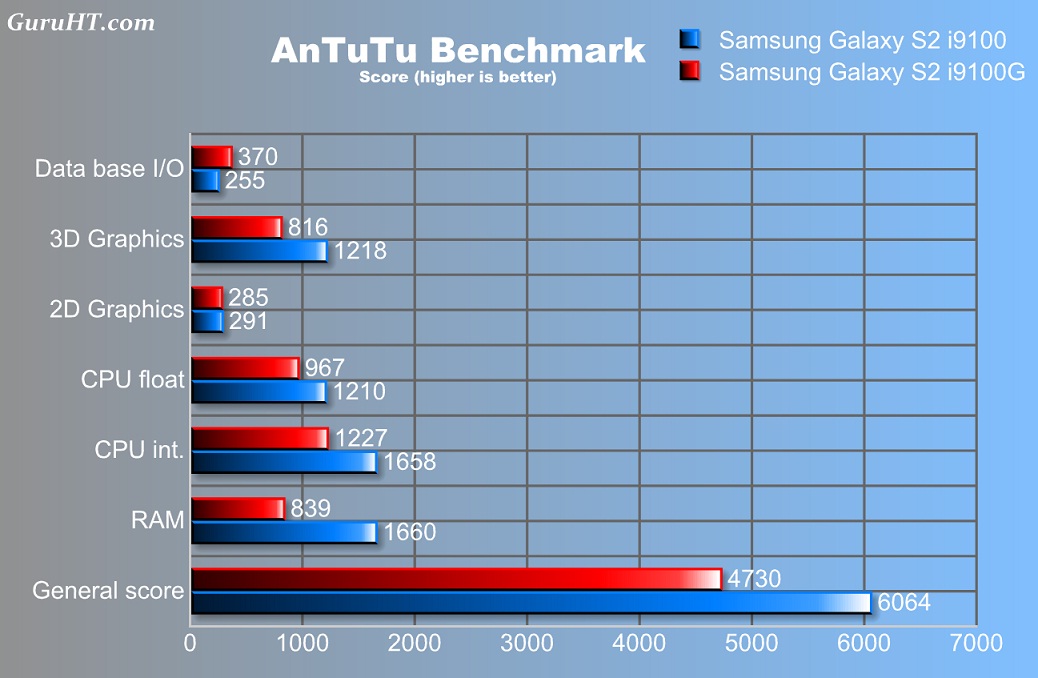 25MB/core
More data can be stored in the L2 scratchpad for access by each processor core.
9.core L3
1.5MB/core
1.5MB/core
More data can be stored in the L3 scratchpad for access by each processor core.
Memory
1.RAM speed
2400MHz
1600MHz
Can support faster memory which speeds up system performance.
2.max memory bandwidth
37.5GB/s
25.6GB/s
This is the maximum rate at which data can be read from or stored in memory.
3rd DDR memory version
Unknown. Help us offer a price. (Intel Core i5-4570S)
DDR (Double Data Rate Synchronous Dynamic Random Access Memory) is the most common type of RAM. New versions of DDR memory support higher maximum speeds and are more energy efficient.
4.Memory channels
More memory channels increase the speed of data transfer between memory and processor.
5.Maximum memory
Maximum memory (RAM).
6.bus baud rate
The bus is responsible for transferring data between various components of a computer or device.
7. Supports memory debug code
✔Intel Core i3-9100F
✖Intel Core i5-4570S
Memory debug code can detect and fix data corruption. It is used when necessary to avoid distortion, such as in scientific computing or when starting a server.
8.eMMC version
Unknown. Help us offer a price. (Intel Core i3-9100F)
Unknown. Help us offer a price. (Intel Core i5-4570S)
The newer version of eMMC — built-in flash memory card — speeds up the memory interface, has a positive effect on device performance, for example, when transferring files from a computer to internal memory via USB.
9.bus frequency
Unknown. Help us offer a price. (Intel Core i3-9100F)
Unknown. Help us offer a price. (Intel Core i5-4570S)
The bus is responsible for transferring data between various components of a computer or device
Geotagging
1. PassMark result
This test measures processor performance using multi-threading.
2. PassMark result (single)
This test measures processor performance using a thread of execution.
3.Geekbench 5 result (multi-core)
Unknown. Help us offer a price. (Intel Core i5-4570S)
Geekbench 5 is a cross-platform test that measures the performance of a multi-core processor. (Source: Primate Labs, 2022)
4. Cinebench R20 result (multi-core)
Unknown. Help us offer a price. (Intel Core i5-4570S)
Cinebench R20 is a benchmark that measures the performance of a multi-core processor by rendering a 3D scene.
5.Cinebench R20 result (single core)
Unknown. Help us offer a price. (Intel Core i5-4570S)
Cinebench R20 is a test to evaluate the performance of a single core processor when rendering a 3D scene.
6.Geekbench 5 result (single core)
Unknown. Help us offer a price. (Intel Core i5-4570S)
Geekbench 5 is a cross-platform benchmark that measures the single-core performance of a processor. (Source: Primate Labs, 2022)
7. Blender test result (bmw27)
545.8seconds
Unknown. Help us offer a price. (Intel Core i5-4570S)
The Blender benchmark (bmw27) measures CPU performance by rendering a 3D scene. More powerful processors can render a scene in a shorter time.
8.Blender result (classroom)
1798seconds
Unknown. Help us offer a price. (Intel Core i5-4570S)
The Blender (classroom) benchmark measures CPU performance by rendering a 3D scene. More powerful processors can render a scene in a shorter time.
9.performance per watt
Unknown. Help us offer a price. (Intel Core i5-4570S)
This means that the processor is more efficient, resulting in more performance per watt of power used.
Functions
1.uses multithreading
✖Intel Core i3-9100F
✖Intel Core i5-4570S
physical processor core into logical cores, also known as threads. Thus, each core can run two instruction streams at the same time.
2. Has AES
✔Intel Core i3-9100F
✔Intel Core i5-4570S
AES is used to speed up encryption and decryption.
3. Has AVX
✔Intel Core i3-9100F
✔Intel Core i5-4570S
AVX is used to help speed up calculations in multimedia, scientific and financial applications, and to improve the performance of the Linux RAID program.
4.Version SSE
SSE is used to speed up multimedia tasks such as editing images or adjusting audio volume. Each new version contains new instructions and improvements.
5. Has F16C
✔Intel Core i3-9100F
✔Intel Core i5-4570S
F16C is used to speed up tasks such as adjusting image contrast or adjusting volume.
6.bits transmitted at the same time
Unknown. Help us offer a price. (Intel Core i3-9100F)
Unknown. Help us offer a price. (Intel Core i5-4570S)
NEON provides faster media processing such as MP3 listening.
7. Has MMX
✔Intel Core i3-9100F
✔Intel Core i5-4570S
MMX is used to speed up tasks such as adjusting image contrast or adjusting volume.
8. Has TrustZone
✖Intel Core i3-9100F
✖Intel Core i5-4570S
The technology is integrated into the processor to ensure device security when using features such as mobile payments and streaming video using digital rights management ( DRM).
9.interface width
Unknown. Help us offer a price. (Intel Core i3-9100F)
Unknown. Help us offer a price. (Intel Core i5-4570S)
The processor can decode more instructions per clock (IPC), which means the processor performs better
Price comparison
Cancel
Which CPUs are better?
Intel Core i5-3470 vs. Intel Core i3-9100
Cpu Benchmark with
9 tests0003
| Intel Core i5-3470 | Intel Core i3-9100 | |
| 3.20 GHz | Frequency | 3.60 GHz |
| 3.60GHz | Turbo (1 core) | 4.20 GHz |
| 3.60GHz | Turbo (all cores) | 3.80 GHz |
| 4 | Cores | 4 |
| No | Hyperthreading ? | No |
| No | Overclocking? | No |
| normal | Basic architecture | normal |
| Intel HD Graphics 2500 | GPU | Intel UHD Graphics 630 |
11. 0 0 |
DirectX Version | 12 |
| 3 | Max. displays | 3 |
| DDR3-1600 | memory size | DDR4-2400 |
| 2 | Memory channels | 2 |
| Max. memory size | ||
| No | ECC | yes |
| — | L2 Cache | — |
| 6.00MB | L3 Cache | 6.00 MB |
| 3.0 | PCIe version | 3.0 |
| 16 | PCIe lanes | 16 |
| 22nm | Technology | 14nm |
| LGA 1155 | socket | LGA 1151 |
| 77 W | TDP | 65W |
| VT-x, VT-x EPT, VT-d | Virtualization | VT-x, VT-x EPT, VT-d |
| Q2/2012 | Issue date | Q2/2019 |
| show more details | show more details |
Cinebench R23 (Single-Core)
Cinebench R23 is the successor to Cinebench R20 and is also based on Cinema 4 Suite. Cinema 4 is software used all over the world to create 3D forms. The single-core test uses only one CPU core, the number of cores or hyper-threading capability is not taken into account.
Cinebench R23 (Multi-Core)
Cinebench R23 is the successor to Cinebench R20 and is also based on the Cinema 4 Suite. Cinema 4 is software used all over the world to create 3D forms. The multi-core test uses all the CPU cores and has a big advantage of hyper-threading.
Cinebench R20 (Single-Core)
Cinebench R20 is the successor to Cinebench R15 and is also based on the Cinema 4 Suite. Cinema 4 is software used all over the world to create 3D forms. The single-core test uses only one CPU core, the number of cores or hyper-threading capability is not taken into account.
Cinebench R20 (Multi-Core)
Cinebench R20 is the successor to Cinebench R15 and is also based on the Cinema 4 Suite. Cinema 4 is software used all over the world to create 3D forms. The multi-core test uses all the CPU cores and has a big advantage of hyper-threading.
Cinebench R15 (Multi-Core)
Cinebench R15 is the successor to Cinebench 11.5 and is also based on Cinema 4 Suite. Cinema 4 is software used all over the world to create 3D forms. The multi-core test uses all the CPU cores and has a big advantage of hyper-threading.
Geekbench 5, 64bit (Single-Core)
Geekbench 5 is a memory-intensive, cross-platform test. A fast memory will greatly push the result. The single-core test uses only one CPU core, the number of cores or hyper-threading capability is not taken into account.
Geekbench 5, 64bit (Multi-Core)
Geekbench 5 is a memory-intensive, cross-platform test. A fast memory will greatly push the result. The multi-core test uses all the CPU cores and has a big advantage of hyper-threading.
iGPU — FP32 Performance (Single-precision GFLOPS)
Theoretical processing performance of the processor’s internal graphics unit with simple precision (32 bits) in GFLOPS. GFLOPS specifies how many billions of floating point operations the iGPU can perform per second.
Blender 2.81 (bmw27)
Blender is a free 3D graphics software for rendering (creating) 3D bodies that can also be textured and animated in the program. The Blender test creates predefined scenes and measures the time(s) required for the entire scene. The less time it takes, the better. We chose the bmw27 as our reference scene.
Cinebench R11.5, 64bit (Single-Core)
Cinebench 11.5 is based on the Cinema 4D Suite, a software that is popular for creating shapes and other things in 3D. The single-core test uses only one CPU core, the number of cores or hyper-threading capability is not taken into account.
Cinebench R11.5, 64bit (Multi-Core)
Cinebench 11.5 is based on Cinema 4D Suite, a software that is popular for creating shapes and other things in 3D. The multi-core test uses all the CPU cores and has a big advantage of hyper-threading.
Estimated results for PassMark CPU Mark
Some of the processors listed below have passed CPU-Benchmark testing.