Intel Celeron N4020 vs Intel Pentium B960 Benchmarks, Specs, Performance Comparison and Differences
|
|
|
|
|
Intel Celeron N4020 vs Intel Pentium B960
Comparison of the technical characteristics between the processors, with the Intel Celeron N4020 on one side and the Intel Pentium B960 on the other side. The first is dedicated to the entry-level notebook sector, It has 2 cores, 2 threads, a maximum frequency of 2,8GHz. The second is used on the entry-level laptop segment, it has a total of 2 cores, 2 threads, its turbo frequency is set to 2,2 GHz. The following table also compares the lithography, the number of transistors (if indicated), the amount of cache memory, the maximum RAM memory capacity, the type of memory accepted, the release date, the maximum number of PCIe lanes, the values obtained in Geekbench 4 and Cinebench R15.
Note: Commissions may be earned from the links above.
This page contains references to products from one or more of our advertisers. We may receive compensation when you click on links to those products. For an explanation of our advertising policy, please visit this page.
Specification comparison:
| Processor | Intel Celeron N4020 | Intel Pentium B960 | ||||||
| Market (main) | Entry-level notebook | Entry-level laptop | ||||||
| ISA | x86-64 (64 bit) | x86-64 (64 bit) | ||||||
| Microarchitecture | Goldmont Plus | Sandy Bridge | ||||||
| Core name | Gemini Lake Refresh | Sandy Bridge | ||||||
| Family | Celeron 4000 | Pentium 900 | ||||||
| Part number(s), S-Spec |
FH8068003067426, |
FF8062700997701, |
||||||
| Release date | Q4 2019 | Q4 2011 | ||||||
| Lithography | 14 nm | 32 nm | ||||||
| Transistors | — | 504. 000.000 000.000 |
||||||
| Cores | 2 | 2 | ||||||
| Threads | 2 | 2 | ||||||
| Base frequency | 1,1 GHz | 2,2 GHz | ||||||
| Turbo frequency | 2,8 GHz | — | ||||||
| Cache memory | 4 MB | 2 MB | ||||||
| Max memory capacity | 8 GB | 16 GB | ||||||
| Memory types |
DDR4/LPDDR4 |
DDR3 1066/1333 |
||||||
| Max # of memory channels | 2 | 2 | ||||||
| Max memory bandwidth | 38,4 GB/s | 21,3 GB/s | ||||||
| Max PCIe lanes | 6 | 16 | ||||||
| TDP | 6 W | 35 W | ||||||
| GPU integrated graphics | Intel UHD Graphics 600 | Intel HD Graphics (Sandy Bridge) | ||||||
| GPU execution units | 12 | 6 | ||||||
| GPU shading units | 96 | 48 | ||||||
| GPU base clock | 200 MHz | 650 MHz | ||||||
| GPU boost clock | 650 MHz | 1100 MHz | ||||||
| GPU FP32 floating point | 144 GFLOPS | 76,8 GFLOPS | ||||||
| Socket | BGA1090 | PGA988, FCPGA988 | ||||||
| Compatible motherboard | — | Socket PGA 988 Motherboard | ||||||
| Maximum temperature | 105°C | 85°C | ||||||
| CPU-Z single thread | 206 | 195 | ||||||
| CPU-Z multi thread | 418 | 394 | ||||||
| Cinebench R15 single thread | 80 | 70 | ||||||
| Cinebench R15 multi-thread | 145 | 137 | ||||||
| Cinebench R20 single thread | 170 | 130 | ||||||
| Cinebench R20 multi-thread | 300 | 255 | ||||||
| PassMark single thread | 1. 188 188 |
927 | ||||||
| PassMark CPU Mark | 1.578 | 879 | ||||||
| (Windows 64-bit) Geekbench 4 single core |
1.991 | 1.863 | ||||||
| (Windows 64-bit) Geekbench 4 multi-core |
3.426 | 3.001 | ||||||
| (Windows) Geekbench 5 single core |
468 | 391 | ||||||
| (Windows) Geekbench 5 multi-core |
851 | 722 | ||||||
| (SGEMM) GFLOPS performance |
24,5 GFLOPS | 25,6 GFLOPS | ||||||
| (Multi-core / watt performance) Performance / watt ratio |
571 pts / W | 86 pts / W | ||||||
| Amazon | ||||||||
| eBay |
Note: Commissions may be earned from the links above.
We can better compare what are the technical differences between the two processors.
Price: For technical reasons, we cannot currently display a price less than 24 hours, or a real-time price. This is why we prefer for the moment not to show a price. You should refer to the respective online stores for the latest price, as well as availability.
We see that the two processors have an equivalent number of cores, the maximum frequency of Intel Celeron N4020 is greater, that the PDT of Intel Celeron N4020 is lower. The Intel Celeron N4020 was designed earlier.
Performance comparison with the benchmarks:
Performance comparison between the two processors, for this we consider the results generated on benchmark software such as Geekbench 4.
| CPU-Z — Multi-thread & single thread score | |
|---|---|
| Intel Celeron N4020 |
206 418 |
| Intel Pentium B960 |
195 394 |
In single core, the difference is 6%. In multi-core, the differential gap is 6%.
Note: Commissions may be earned from the links above. These scores are only an
average of the performances got with these processors, you may get different results.
CPU-Z is a system information software that provides the name of the processor, its model number, the codename, the cache levels, the package, the process. It can also gives data about the mainboard, the memory. It makes real time measurement, with finally a benchmark for the single thread, as well as for the multi thread.
| Cinebench R15 — Multi-thread & single thread score | |
|---|---|
| Intel Celeron N4020 |
80 145 |
| Intel Pentium B960 |
70 137 |
In single core, the difference is 14%. In multi-core, the differential gap is 6%.
Note: Commissions may be earned from the links above. These scores are only an
average of the performances got with these processors, you may get different results.
Cinebench R15 evaluates the performance of CPU calculations by restoring a photorealistic 3D scene. The scene has 2,000 objects, 300,000 polygons, uses sharp and fuzzy reflections, bright areas, shadows, procedural shaders, antialiasing, and so on. The faster the rendering of the scene is created, the more powerful the PC is, with a high number of points.
| Cinebench R20 — Multi-thread & single thread score | |
|---|---|
| Intel Celeron N4020 |
170 300 |
| Intel Pentium B960 |
130 255 |
In single core, the difference is 31%. In multi-core, the differential gap is 18%.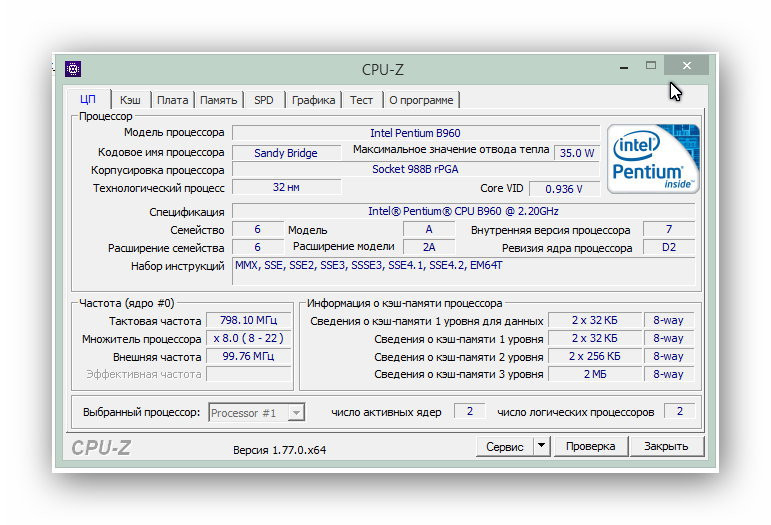
Note: Commissions may be earned from the links above. These scores are only an
average of the performances got with these processors, you may get different results.
Cinebench R20 is a multi-platform test software which allows to evaluate the hardware capacities of a device such as a computer, a tablet, a server. This version of Cinebench takes into account recent developments in processors with multiple cores and the latest improvements in rendering techniques. The evaluation is ultimately even more relevant.
| PassMark — CPU Mark & single thread | |
|---|---|
| Intel Celeron N4020 |
1.188 1.578 |
| Intel Pentium B960 |
927 879 |
In single core, the difference is 28%. In multi-core, the differential gap is 80%.
Note: Commissions may be earned from the links above. These scores are only an
average of the performances got with these processors, you may get different results.
PassMark is a benchmarking software that performs several performance tests including prime numbers, integers, floating point, compression, physics, extended instructions, encoding, sorting. The higher the score is, the higher is the device capacity.
On Windows 64-bit:
| Geekbench 4 — Multi-core & single core score — Windows 64-bit | |
|---|---|
| Intel Celeron N4020 |
1.991 3.426 |
| Intel Pentium B960 |
1.863 3.001 |
In single core, the difference is 7%. In multi-core, the differential gap is 14%.
Note: Commissions may be earned from the links above. These scores are only an
average of the performances got with these processors, you may get different results.
Geekbench 4 is a complete benchmark platform with several types of tests, including data compression, images, AES encryption, SQL encoding, HTML, PDF file rendering, matrix computation, Fast Fourier Transform, 3D object simulation, photo editing, memory testing. This allows us to better visualize the respective power of these devices. For each result, we took an average of 250 values on the famous benchmark software.
On Windows:
| Geekbench 5 — Multi-core & single core score — Windows | |
|---|---|
| Intel Celeron N4020 |
468 851 |
| Intel Pentium B960 |
391 722 |
In single core, the difference is 20%. In multi-core, the differential gap is 18%.
Note: Commissions may be earned from the links above. These scores are only an
average of the performances got with these processors, you may get different results.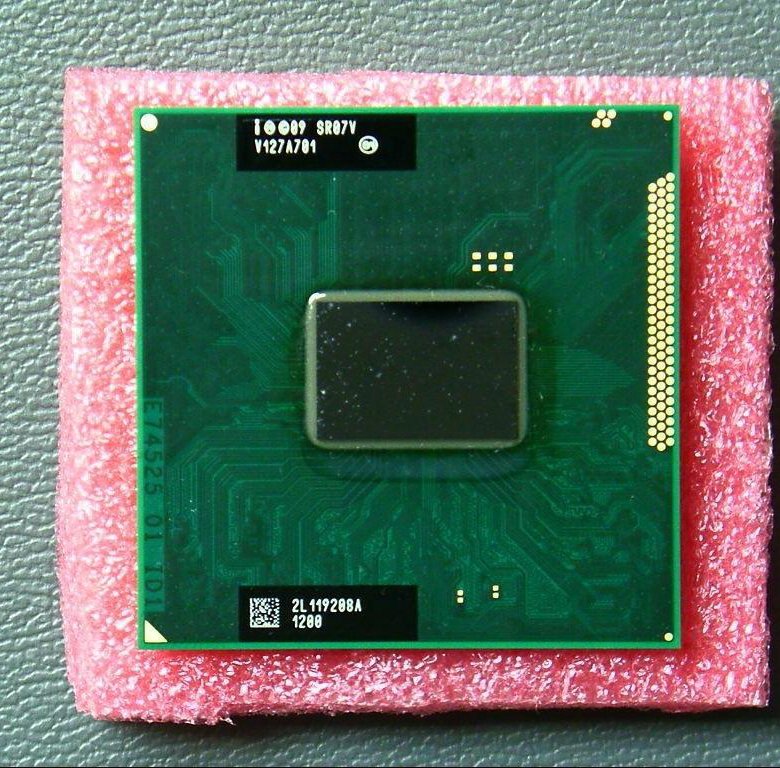
Geekbench 5 is a software for measuring the performance of a computer system, for fixed devices, mobile devices, servers. This platform makes it possible to better compare the power of the CPU, the computing power and to compare it with similar or totally different systems. Geekbench 5 includes new workloads that represent work tasks and applications that we can find in reality.
Equivalence:
Intel Celeron N4020 AMD equivalentIntel Pentium B960 AMD equivalent
Intel Pentium B960 Drivers & Specs 2023
Last updated:
FREE Drivers Download
Check Price
Pentium B960 is a mobile processor from Intel released on 2 October 2011, and it is in end-of-life production status now. It belongs to Pentium family and has a Sandy Bridge architecture. This processor is built on Intel Socket G2 (988B), and uses unknown PCI express connection. 32 nm process is used in production.
Processor has 2 cores and 2 threads, with the base frequency of 2.2 GHz. It has DDR3 Dual-channel memory support. As for the cache, it supports L1 64K (per core), L2 256K (per core) and L3 2MB (shared).
Learn more about Intel Pentium B960:
- Specifications
- Drivers
- Benchmark & Performance
- Gaming
Specifications
- Vertical Segment
- Mobile
- Release date
- 2 October 2011
- Production status
- End-of-life
- Generation
- Pentium
- Codename
- Sandy Bridge
- Socket
- Intel Socket G2 (988B)
- Total Cores
- 2
- Total Threads
- 2
- Frequency
- 2.2 GHz
- Turbo clock
- N/A
- Cache L1
- 64K (per core)
- Cache L2
- 256K (per core)
- Cache L3
- 2MB (shared)
- TDP
- 35 W
Physical Specifications
- Socket
- Intel Socket G2 (988B)
- Foundry
- Intel
- Process size
- 32 nm
- Transistors
- 504 million
- Die size
- 131 mm²
- Package
- rPGA
Performance
- Frequency
- 2.
 2 GHz
2 GHz - Turbo clock
- N/A
- Base clock
- 100 MHz
- Multiplier
- 22.0x
- Multiplier unlocked
- No
- TDP
- 35 W
Architecture Details
- Vertical Segment
- Mobile
- Production status
- End-of-life
- Release date
- 2 October 2011
- Codename
- Sandy Bridge
- Generation
- Pentium
- Part
- SR07V
- Memory support
- DDR3 Dual-channel
- ECC memory
- No
Cores
- Total Cores
- 2
- Total Threads
- 2
- SMP # CPUs
- 1
- Integrated graphics
- Intel HD (Sandy Bridge)
Cache
- Cache L1
- 64K (per core)
- Cache L2
- 256K (per core)
- Cache L3
- 2MB (shared)
Features & Technologies
- MMX
- SSE
- SSE2
- SSE3
- SSSE3
- SSE4.
