Real Temp — CPU temperature monitoring
Real Temp is a temperature monitoring program designed for all Intel single Core, Dual Core, Quad Core and Core i7 processors.
Each core on these processors has a digital thermal sensor (DTS) that reports temperature data relative to TJMax which is the safe maximum operating core temperature for the CPU. As your CPU heats up, your Distance to TJMax will decrease. If it reaches zero, your processor will start to thermal throttle or slow down so maximizing your distance away from TJMax will help your computer run at full speed and more reliably too.
Download Real TempSupport Forum
Main Features
- Reads temperature information from all Intel Core based processors. Pentium 4 processors are not supported.
- Ability to individually calibrate Real Temp for each core of your CPU.
- Program is based on temperature data gathered using a Fluke 62 IR Thermometer.
- Test Sensors feature will check your DTS sensors for any sign of problems.
- Keeps track of Minimum and Maximum temperatures with full logging features.
- Reporting and logging of the Intel PROCHOT# thermal throttle activity bit.
- Quick, very accurate and repeatable benchmark.
- Displays MHz, TJMax, CPUID, APIC ID and Calibration settings.
- High temperature alarm and shutdown feature based on CPU or NVIDIA GPU temperature.
- No installation or registry modifications required.
- Support for Windows 2000 / XP / Vista / Windows 7 / Windows 8 / Windows 10 (32 & 64 bit) / Windows 11
Forums
- Official Discussion Forums
- Discussion Thread at XtremeSystems
Screenshots
Documentation
See the Installation & Calibration Page.
Downloads
The latest version is available in the downloads section.
Changes in Version 3.
 70
70
- Support for Sandy Bridge CPUs.
- VID based power consumption estimates for the newer CPUs.
- Improved log file formatting.
- Added a single system tray icon that reports the maximum core temperature.
- RealTemp GT updated for the 6 core Sandy Bridge E CPUs.
- i7 Turbo GT 1.30 multiplier monitoring tool.
Changes in Version 3.60
- Added Core i Turbo multiplier and Turbo TDP/TDC overclocking for Extreme / K series CPUs.
- Added ATI GPU and improved NVIDIA GPU monitoring with CrossFire and SLI support.
- Added a system tray / notification area font selector.
- New Fahrenheit and 3 digit system tray option.
- Fixed Core 2 Extreme multiplier reporting.
- Fixed Core 2 mobile CPU C0% based load reporting.
- Changed how Core 2 Super Low Frequency Mode (SLFM) is reported.
- Improved sensor test consistency.
- Bug with Reset button on ATI systems fixed.
- RealTemp GT for the 6 core Gulftown CPUs was also updated.
- Separate i7 Turbo GT multiplier monitoring tool for 6 core Gulftown CPUs added.
Changes in Version 3.40
- Core i7/i5/Xeon socket 1156 support including accurate turbo mode reporting.
- new information window for Nvidia GPUs with improved SLI support.
- correct reporting of Super Low Frequency Mode (SLFM) for Core 2 mobile CPUs.
- correct reporting of Intel Dynamic Acceleration (IDA) for Core 2 mobile CPUs.
- added VID reporting to the main GUI for Core 2 based CPUs.
- added a Fahrenheit=1 INI file option.
- added the option to view a Task Manager based or a C0% based load meter.
- added the ability to toggle C1E state and view the SpeedStep (EIST) state.
- improved dual and multi-monitor support including Anchor mode.
- includes RealTemp GT, a 6 core version of RealTemp for Gulftown CPUs.
- includes i7 Turbo, a high precision multiplier monitoring tool for all Core CPUs.
- and includes LoadTester, a variable load, single core testing program.
- Skull=1 or Skull=2 INI option for reading each CPU on a Dual Quad system.
- thanks rge, burebista and somebody on TPU for all of your ideas and help.
Changes in Version 3.00
- Core i7 temperature and frequency support including Turbo mode.
- NVIDIA temperature reporting with highest GPU temperature displayed in SLI mode.
- Ability to run a file or shutdown based on user defined alarm temperature.
- Updated interface with modern XP / Vista style and border in Mini Mode.
- Start Minimized Vista issues finally fixed.
- New RivaTuner plug-in support.
- Extra information on the main screen and the retirement of the toggle button.
- Switch to UNICODE for better international support.
- Adjustable GUI colors and bold System Tray font option.
- TJMax updated based on new Intel documentation and further testing.
- Calibration formula simplified.
- All new CPU Cool Down Test for a more thorough look at your sensors.
- Clock Modulation & Minimize on Close options.
- New CPU Load meter, log file headings and Distance to TJMax in the System Tray.
- 101 other improvements including initial Windows 7 Beta support.
Changes in Version 2.70
- Redesigned user interface (GUI) with larger temperature fonts.
- Added a movable Mini-Mode that is turned on and off with a double left mouse click on the GUI.
- Added an Anchor position so the GUI will move to a fixed screen position after a double right mouse click.
- Anchor position can be customized by holding down the Shift key while double right clicking.
- The correct physical core order of Quad core processors is now reported based on APIC ID.
- Added reporting of Minimum and Maximum VID as well as current VID.
- A new user selectable high temperature alarm with two alarms for Quad core processors.
- More accurate MHz calculation as well as FSB and CPU multiplier reporting.
- New program Up Time feature.
- Bug fix for log file output when using a Single or Dual core processor.
- Fixed and improved the Default button in the Settings window.
- Button labels and functionality changed in Settings window to follow the Windows style guide.
- Improved multi-threading and memory usage for better long term stability.
- Start Minimized option improved for better Vista support. See the documentation for more info.
- Option to save the Log file in .CSV format for easy Excel support.
- Gamer Mode temporarily retired.
Changes in Version 2.60
- Added a new Settings screen where all adjustments can be made in real time including TjMax.
- Temperatures of any core are now displayed in the System Tray area. Thanks W1zzard!
- 4 font options for the System Tray.
- Choice of Current, Minimum, Maximum or Average termperature displayed in the System Tray.

- Test Sensors feature improved to increase repeatability.
- CPU real time MHz calculation was re-worked for better SetFSB / ClockGen support.
- Calibration options now include one digit after the decimal point for finer adjustments.
- Experimental Gamer Mode introduced which allows core temperatures to be seen in some games.
Changes in Version 2.5
- Added minimize to System Tray support.
- Correctly reports CPU MHz for the new 45nm processors.
- Displays CPU voltage identification (VID).
- Start minimized option and now opens and closes in the same location.
Changes in Version 2.41
- adjustable Idle calibration for each core and expanded range from -3 to 3.
- adjustable TjMax for each core.
- log interval options expanded from 1 to 60 seconds.
- a change of timers used for the benchmark feature to better support overclocking from within Windows.
- Reset button added to the gui to reset minimum and maximum temperatures.

- better support of the Enter and Tab keys.
Dec 22nd, 2022 13:12 CET
change timezone
Sign in / Register
- NVIDIA GeForce 527.56 WHQL
- AMD Radeon 22.11.2 WHQL
-
Intel
IGP 101.3790
/
Arc 101.3975 Beta
-
by
720p lowIs it worth it to try to restore original bios from a mining rx 580? (11)
-
by
rosscoHP 800 g2 sff — SSD query. (0)
-
by
720p lowWill you upgrade your case for a new GPU? | Poll (53)
-
by
QuietBobWhat is your RoboHornet Pro score? (2)
-
by
KissamiesRare GPUs / Unreleased GPUs (1469)
-
by
FrickWhat are you playing? (16816)
-
by
GerKNG7900 XTX Fps/performance problem (16)
-
by
siluro818Is it worth getting more DDR3 RAM now? (62)
-
by
OmmadawnXeon Owners Club (8084)
-
by
Chrispy_I used this memory in my old intel 10900k with xmp profile and it worked perfectly.
 Unfortunately, it doesn’t work with my new ryzen (32)
- AMD Radeon RX 7900 XTX Review — Disrupting the RTX 4080
- ASUS Radeon RX 7900 XTX TUF OC Review — Amazing Overclocking
- Sapphire Radeon RX 7900 XTX Nitro+ Review — Maxing out 3x 8-Pin
- Portal with RTX Review — Amazing Raytracing
- The Callisto Protocol Benchmark Test & Performance Analysis Review
- AMD Radeon RX 7900 XT Review
- AMD «Navi 31» Radeon RX 7900 XTX and XT Unboxing
- MSI MEG X670E ACE Review
- XFX Radeon RX 7900 XTX Merc 310 OC Review — 3x 8-pin FTW
- Fractal Design North Review
-
AMD Readies 16-core, 12-core, and 8-core Ryzen 7000X3D «Zen 4» Processors
(150) -
First Alleged AMD Radeon RX 7900-series Benchmarks Leaked
(146) -
$700-800 Ideal Price for GeForce RTX 4080: TechPowerUp Poll Surveying 11,000 Respondents
(139) -
Announcing the TechPowerUp SSD Specs Database
(134) -
The Witcher 3 Next-Gen Update Adds Higher-res Textures, Ray Traced GI, DLSS and FSR 2
(132) -
NVIDIA GeForce RTX 4080 Could Get a Price Cut to Better Compete with RDNA3
(111) -
US Might Reimpose GPU Import Tariffs in the New Year
(108) -
RTX 4090 has Issues with Need for Speed Unbound that can Only be Fixed with a VBIOS Update
(100)
Real Temp Download 3.
 7.0 for Windows
Reliable app to monitor CPU temperature for Intel Processors
Real Temp is a free portable CPU temp monitor specially built for Intel CPUs such as single Core, Dual Core, Quad-Core, and Core i7. Real Temp Intel CPU temp monitor shows an active reading of your system’s main components.
Real Temp displays accurate information. You can instantly check CPU temperature, maximum, and minimum PC temp range. No installation is required just download Real Temp, extract zip folder files, and monitor your PC temperature.
Download Real Temp latest version 3.7.0 for windows. Works with both 32bit -64 bit versions of Windows 10, Windows 8, Windows 7, Windows Vista, Windows XP.
This CPU heat monitor is a compact and portable software utility which adds up in the system tray, so that you may keep an eye on your PC temp.
If you are worried about your system health then you must download RealTemp for Windows latest version with an offline installer.
Real Temp Download Not Necessary
There is no installation setup pack involved in this app. So, when you download Real Temp Intel CPU temperature monitor, you can drop this PC temp monitor app in any part of the hard disk. If you want to run this app simply click the executable to launch the app.
You can also save RealTemp in a flash drive and run it directly on any PC. This app does not create new entries in the Windows registry or Start menu.
Reliable PC temperature monitor
It’s not the earth that is getting hot, these days CPU overheating has also become a major problem of hardware failure. Heavy games and software only increased the chances of the high CPU temperature. This is why all PC users need to know what temp should my CPU be or how to check PC temperature on windows.
Real Temp download is the best system monitoring tool that keeps a close eye on your PC temp. It’s the best core temp gadget to monitor CPU heat regularly and let its users know if their PC is overheating or not. You can see live CPU temperature readings going up and down with this CPU monitor.
You can also run sensor benchmarks or temps tests to check CPU load or enable system tray notifications and create a log activity file.
Clean interface
This free Windows utility has a very clear user interface. In its main window, you can see temp readings. At the top, it shows the CPU model, CPU load, and CPU frequency.
At the bottom, it shows the current CPU temperature, but the most interesting feature of Real Temp is that it shows distance to TJ. Max value.
What is Tj Max CPU?
It’s an abbreviation of T junction Max which is another word used for core temp. It’s the maximum temperature value provided for Intel CPUs. If that distance decreases then you need to cool down your PC.
This temp monitor shows live readings, if the CPU temp range is high then it will ask you to take the necessary steps. You can prevent computer overheating and protect against system hardware failure by using this CPU temp monitor.
At the bottom, it shows record time, minimum, and maximum computer temperature. Through these readings, you can easily determine what should be a good CPU temp?
Easily customizable settings
Many configuration options are included in its setting. You can easily navigate them if you want. You can manually set Tj. Max value and alarm. The alarm helps you to inform in case if the CPU temp goes high. The alarm will let you know through its temperature icon.
The only drawback of this CPU temp program is that it cannot shut down the PC, in case the temperature reaches a critical limit.
This free windows utility also has a built-in option to display GPU temp. If GPU is installed in our PC and you want to check GPU temp. Then you can enable the GPU option from settings. This tool also works as a reliable GPU temp monitor and shows accurate GPU temp readings.
Final thoughts
In our experience, it proved to be a reliable CPU temp monitor. While reviewing this app, occasionally it caused a pop-up error or hangs our OS but it’s not a big issue most of the time.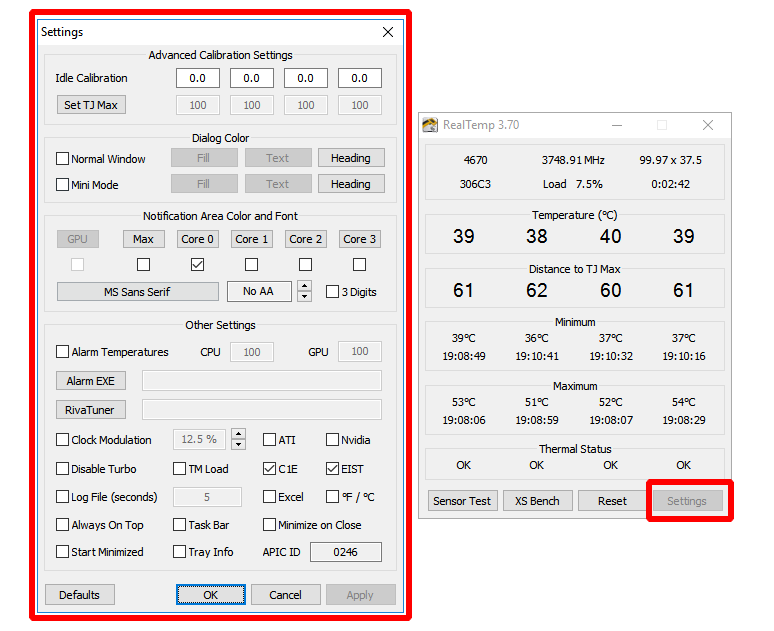
Although this PC heat monitor was initially developed to monitor Intel CPU’s it has also proved to be the reliable AMD temperature monitor.
For your ease in identifying core temps, you can assign a different color to each CPU core. Show PC temp readings in both Fahrenheit and Celsius values. When minimized it adds up in system try, here you can easily see core temp by clicking on the notification bar. You should give it a try.
Download
Real Temp
Full Version 3.70 For PC
3.5 (4)
?️ Safe & Secure
Download Specs
- License: Free
- Platform: Windows OS
- Language: English
- File Size: 323.1 KB
- Downloads: 1,910
- Developer: Techpowerup
Russian translation, synonyms, antonyms, pronunciation, example sentences, transcription, meaning, phrases
|
Most often, Modi’s patrons provide data on average growth rates GDP in the period from 2001 to 2011. |
||
|
Despite the global depression, Greece managed to suffer comparatively little, AVERAGING AN Average Growth Rate of 3.5% FROM 1932 To 1939. |
Despite the global depression, Greece was able to suffer relatively from 1932 to 1939, 1 9000 9000 9000 growth of was 3.5%. |
|
|
The average growth rate of the urban population has recently increased which is attributed mainly to migration and rapid urbanization. nine0010 |
The average growth rate of the urban population has recently increased, mainly due to migration and rapid urbanization. |
|
|
Illiteracy growth rate below average Oman. |
The rate of growth of the number of illiterates is below the average value . |
|
|
In the rest of Asia, economic growth has been robust, at an average annual rate of 8 per cent. |
The rest of Asia experienced strong economic growth, with an average annual growth of 8 percent. |
|
|
As a result, there is the average wage growth. |
As a result — the growth of the average wage . |
|
|
These sectors usually command a higher than average wage and are important factors in promoting savings and consumption-led growth. |
These sectors, which are typically above average wages , are an important factor in increasing savings and consumption-led growth . |
|
|
The average wage, too, has posted a certain, though slow growth in both the private and public sector. |
With average wages also showed clear, albeit slow, growth in both the private and public sectors. Although this was below the European average , the Government pointed out that the growth rate was above average . |
Although this is below the European average , the government indicated that the growth rate is above the average . |
|
The rise in the participation rate was limited to women, and female employment growth remained above average after a record increase of 4.5 per cent in 1986. |
and remained above the average of after a record rise of 4.5% in 1986. |
|
|
The difference between the average and median measures of performance reveals the uneven growth among the subregions, economic groupings and countries. nine0010 |
The difference between the average and the median indicates different growth rates in different sub-regions, economic groupings and countries. |
|
|
Devaluation would also boost average eurozone GDP growth by stimulating exports and encouraging Europeans to substitute domestically produced goods and services for imported items. |
Devaluation will also increase medium growth Eurozone GDP by stimulating exports and encouraging Europeans to replace domestically produced goods and services with imported ones. |
|
|
It may be that the company making all this effort is having such growth in revenue from other and older products that the drain on profits is not noticed by the average stockholder. |
Of course, a company doing this may have such an increase in revenue from the sale of other long-established products that the «leakage» of profits is not noticeable to the ordinary shareholder. nine0010 |
|
|
Stable democracies have better long-term economic growth records (on average ) and do much better in terms of protecting basic human rights. |
Countries with stable democracies experience longer-term economic growth (average ) and do better in protecting basic human rights. |
|
|
nine0010 |
This means a average increase in gross receipts of 6 percent, an increase in net operating income of 10 percent and an increase in postcard sales of 2 percent. |
|
|
This above sector-average growth in margins and revenues in 2015. |
||
|
Alongside immigration, birth rates and average life expectancy also factor into population growth. |
Along with immigration, population growth factors include the birth rate and average life expectancy. |
|
|
My presentation of average real GDP growth of below 4% was roundly regarded as deeply pessimistic and appeared to surprise many. |
As a result, my words about average real GDP growth below 4 percent surprised many, appearing extremely pessimistic. |
|
|
All this has been achieved in a context of stability, sound public finances, low inflation and an average annual economic growth of 5 per cent in the last four years. |
All this was achieved in conditions of stability, a stable state budget, low inflation and average annual economic growth growth of 5 percent over the past four years. |
|
|
The average high-debt episodes since 1800 last 23 years and are associated with a growth rate more than one percentage point below the rate typical for periods of lower debt levels. |
In the average all high-debt episodes have lasted 23 years and are associated with growth rates more than one percentage point lower than the level characteristic of lower levels of debt. nine0010 |
|
|
The nation needs to set ambitious goals, aiming for an average economic growth rate of 6-7 percent a year. |
The nation should set itself ambitious goals and reach an average economic growth rate of 6 — 7% annually. |
|
|
I still think we are in for a repeat, over the coming decade, of slower growth on average than we would like, but not this year. |
I still think that in the coming decade we will see a repeat of the period of slow growth that will be slower than we would like. |
|
|
This trend is expected to continue, with annual population growth in the GCC averaging 1.8% – twice the average for emerging markets. |
This trend is expected to continue, with annual population growth in GCC at averaged at 1.8%, which is double the average for emerging markets. |
|
|
In the four years since the global financial crisis struck, the growth rate fell to -1.2%, compared to the eurozone average of -0.2%, and it is expected to remain negative this year. |
Four years since the start of the global financial crisis growth rate GDP growth fell to — 1.2%, while the eurozone average is -0.2% and is expected to remain negative this year. |
|
|
But when it comes time to calculate taxes and profits, investors and politicians will have to refocus on the new normal growth rate , which will be below the average . |
||
|
According to the Internet, it takes the average marijuana plant three months of growth to reach the height of this plant. |
According to the internet, it takes three months for a marijuana seedling to reach that height. |
|
|
The unemployment rate in March 2016 was 6.4%, which is below the EU average , while real GDP growth in 2011 was 8.0%, five times the euro-zone average . |
The unemployment rate in March 2016 was 6.4%, below the EU average , while real GDP growth in 2011 was 8.0%, five times the average across the eurozone. |
|
|
In the period 2001–10, Angola had the world’s highest annual average GDP growth, at 11.1%. |
In the period 2001-10, Angola had the world’s highest average annual GDP growth of 11.1%. |
|
|
Average annual growth is between 13% and 14%. |
Average annual growth ranges from 13% to 14%. |
|
|
Ann Carrns responded that using an average annual return rate is misleading and that the compound annual growth rate is a better measurement for planning investments. |
Anne Carrns responded that using the annual average rate of return is misleading and that the compound annual growth rate is the best indicator for investment planning. |
|
|
But personal disposable income has not risen as fast as the economy as a whole in many years—at 1 percentage point less than average GNP growth in the late 1980s. 90,010 90,011 90,004 90,005 But household disposable income for many years has not grown as fast as the economy as a whole—1 percentage point less than 90,006 the average 90,007 GNP growth in the late 1980s. |
||
|
The growth in billionaires took a dramatic leap since the early 1980s, when the average net worth of the individuals on the Forbes 400 list was $400 million. |
The growth in the number of billionaires has risen sharply since the beginning of 1980 — ies, when average net worth of people included in the Forbes 400 list, was 400 million dollars. |
|
|
Since 1980, Latin America also lost growth versus the world average . |
Since 1980, Latin America has also lost growth from the world average. |
|
|
Global demand for crude oil grew an average of 1.76% per year from 1994 to 2006, with a high growth of 3.4% in 2003–2004. |
From 1994 to 2006, the world demand for crude oil grew by on average by 1.76% per year, and in 2003-2004 by 3.4%. |
|
|
Enron’s stock increased from the start of the 1990s until year-end 1998 by 311%, only modestly higher than the average rate of growth in the Standard & Poor 500 index. |
Enron shares have risen since the beginning of 19 to the end of 1998 by 311%, which only slightly exceeded the average growth rate of the Standard & Poor 500 index. |
Ecuador’s economy is the eighth largest in Latin America, and between 2000 and 2006, its average growth was 4.6%. nine0010 |
|
From 1980 to 1990, the country’s economy grew by an average of 2.7% a year, but this was outstripped by population growth and real income declined. |
From 1980 to 1990, the country’s economy grew by an average of by 2.7% per year, but this outpaced population growth and the decline in real incomes of the population. |
|
|
On 1 January 2002, Spain fully adopted the euro, and Spain experienced strong economic growth, well above the EU average during the early 2000s. |
On January 1, 2002, Spain fully adopted the euro, and in the early 2000s Spain experienced strong economic growth, well above the EU average. Since 1980, the average annual growth rate in the number of cruise passengers worldwide has been 8. |
Since 1980, the average annual growth rate in the number of cruise passengers worldwide has been 8.4%, and in 2005 cruises took about 11.5 million passengers. |
|
Ohio’s population growth lags that of the entire United States, and Caucasians are found in a greater density than the United States average . |
Ohio’s population growth lags the population growth of the entire United States, and Caucasians are found in greater density than in is an average of in the US. |
|
|
Over his two terms, the economy saw a reduction of inflation from 12.5% to 4.4% and an average real GDP annual growth of 3.4%. |
During his two terms, the economy experienced a decrease in inflation from 12.5% to 4.4% and an average annual real GDP growth of 3.4%. |
|
|
The fast food market has experienced an average annual growth rate of 6. |
The fast food market has an average annual growth rate of 6.5 percent, which is the fastest growing sector of the retail food market. |
|
|
Although Tunisia managed an average 5% growth over the last decade it continues to suffer from a high unemployment especially among youth. nine0010 |
Despite the fact that over the past decade Tunisia has managed to achieve an average of 5% growth of over the past decade, it continues to suffer from high unemployment, especially among young people. |
|
|
Legazpi had an average annual population growth of 1.86% between 2000 and 2007 according to the 2010 census. |
According to the 2010 census, from 2000 to 2007 average annual population growth in Legazpi was 1.86%. |
|
|
The growth in the elderly population brought along higher health care costs, most notably seen in the 10% average increase in state prison budgets from 2005 to 2006. |
||
|
The 10 °C average temperature was found to be the minimum temperature necessary for tree growth. |
An average temperature of 10°C turned out to be the minimum temperature required for growth of trees. |
|
|
Economic growth was on average 0.4% annually, and living standards saw minimal growth, and eventually became completely stagnant. |
Economic growth was 0.4% per year on average, and the standard of living experienced minimal growth and eventually became completely stagnant. Productivity growth in the United States had declined to an average annual rate of 1%, compared to an average annual rate increase of 3.2% during the 1960s. |
Labor productivity growth in the United States fell to average annual rate of 1% compared with average annual growth of 3. |
|
Growth then slowed, rising 11 percent to 3.8 million in 1970, and an average of 9 percent over the next three decades to 4.9 million in the 2000 Census. |
Growth then slowed, rising by 11 percent to 3.8 million in 1970 and averaging by 9 percent over the next three decades to 4.9million in 2000. |
|
|
In 2018, Indonesia received 15.8 million visitors, a growth of 12.5% from last year, and received an average receipt of US$967. |
In 2018, Indonesia received 15.8 million visitors, up 12.5% from last year, and received an average of $90,007,967 in . |
|
|
In 2014 the state with the highest minimum wage in the nation, Washington, exceeded the national average for job growth in the United States. |
In 2014, the state with the highest minimum wage in the nation, Washington, surpassed the national average for employment growth in the United States. |
|
|
In terms of per capita growth, France was about average . |
In terms of growth per capita, France was about middle . |
|
|
From 1985 to 1996, Thailand’s economy grew at an average rate of more than more than 9% per year, which is the highest rate of economic growth in any country at that time. |
||
|
Between 1999 and 2005 average per capita annual growth was 8.2%, investment growth nearly 9%, foreign direct investment 17.5%. |
In the period from 1999 to 2005 the average annual growth per capita was 8.2%, investment growth — almost 9%, foreign direct investment — 17.5%. |
|
|
The market is expected to reach US$30 billion by 2020 by following an average annual growth of 5.5%. |
This market is expected to reach $30 billion by 2020, with a average annual growth of 5. |
|
|
If there is more than average growth of sternum than pectus carinatum protrudes. |
If there is more than average growth of the sternum, then the pectus carinatum comes forward. |
|
|
Real GDP per capita grew 2.6% under Reagan, compared to 1.9% average growth during the preceding eight years. |
Real GDP per capita grew 2.6% under Reagan, compared with an average growth of 1.9% over the previous eight years. |
|
|
A country can both increase its average living standard and grow total GDP even though its population growth is low or even negative. |
A country can both increase its average standard of living, and increase the overall GDP, even if its population growth is low or even negative. |
|
|
Average annual real GDP growth rates were 6.8% in the 1960s, 4.8% in the 1970s, and 6. |
Average annual growth rates of real GDP were 6.8% in the 1960s, 4.8% in the 1970s and 6.5% in the 1980s. |
|
|
Average annual growth fell to 4.6% in the 1990s with significantly lower growth in the second half of that decade. |
In the 1990s the average annual growth rate fell to 4.6%, and in the second half of this decade they were much lower. |

 But it won’t happen this year.

 of 4.6% between 2000 and 2006.
  4%, and in 2005, cruises hosted an estimated 11.5 million passengers. nine0010
 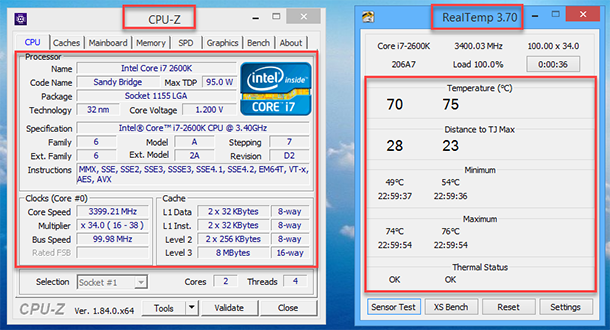 5 percent, which is the most rapidly growing sector of the retail food market.
  health care spending, most notably in the 90,006 average of 90,007 on the 10% increase in the state prison budget from 2005 to 2006. nine0010
  2% in the 1960s.
 5%.
5%. 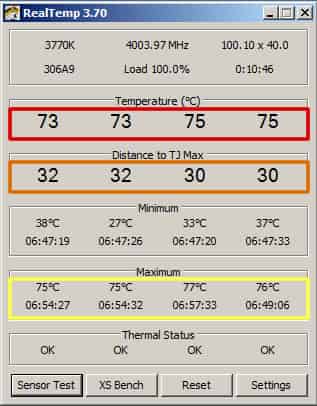 5% in the 1980s.
 Agriculture — smart and sustainable
¿Hablas español?
By
Barnaby
Lewis
Tags: AgricultureTechnologySustainability
Most of us agree that humanity is facing serious problems. And while the increasing pace of life may have contributed to these problems, emerging technologies also offer us new ways to solve them. For example, we can use the power of connectivity to feed our planet’s growing population, which is rapidly declining.
What are your ideas on the future of farming?
Get involved in the ISO strategic advisory group (SAG) and tell us. nine0010
Within the SAG, the ISO members for the USA and Germany are coordinating experts from 21 other member countries. Each ISO member interested in participating has nominated an expert to introduce content relevant to the context and interests of their respective countries.
Reach out to us and find out how you can take part.
The SAG has been tasked with mapping the standardization landscape surrounding smart farming across the entire food value chain situated within the context of the UN SDGs, and assessing the need for future standardization. nine0977
The SAG is working with relevant stakeholders to produce an overview and plan for smart farming standards, expected towards the end of 2022. comprehensive solutions are needed. This approach is provided by ISO standards. You can see the role standards play in many situations, such as how we help smart cities develop. Now, at the other end of the spectrum, we have focused on fields and food. nine0010
The artificially fast, hyper-connected, uninterrupted and uninterrupted digital world finds leaves, shoots, grains and tubers growing too slowly for it. But these are two things that should not be combined at all, right?
The fact is that agriculture has become extremely data-driven. As resources and profits dwindle and climate change makes the weather less predictable, commercial farmers must collect, interpret and share more and more information to stay afloat in their business. But all too often, different machines, sensors, and the software they use don’t play well with each other. Addressing this interoperability problem is just one area where ISO can help. nine0010
Cookie consent is required
Please view on YouTube or .
SAG «Smart Farming» is a model of how to connect all the dots in this puzzle. Its members ensure that relevant experts from around the world and outside the agricultural sector can work together seamlessly. So, when it comes to growing plants in an artificially controlled environment, it is only logical that lighting experts can share their bright ideas. Likewise, we need robotics experts to share their ideas on how drones can do the most repetitive or dangerous jobs on the farm. It should be clear by now what is going on. That’s why over 30 ISO technical committees (as well as their highly specialized sub-committees) form the core of the group. nine0010
Relevant experts from different sectors work together.
The ISO Group on Smart Agriculture is convened by ISO members from the US and Germany, two world leaders in industrial agriculture. The core of the new group brings together ISO’s 21 member countries and represents the full range of agricultural conditions and problems imaginable.
These include giants such as China and India (both countries combine family subsistence farming with industrial-scale exports of goods) and countries such as Singapore and the Netherlands (both countries are addressing the problem of high population density living on high-value land through high-intensity, high-tech manufacturing). nine0010
We need to find agricultural land that is equivalent to the combined area of Italy, Japan, New Zealand, France, South Korea and Germany.
Now or never — the situation with chain food production
After a prolonged (and still ongoing) health crisis, one would expect the state of the world economy to be worse than it is now. Perhaps part of this is due to our resilience, adapting to new ways of behaving and the rapid development of vaccines. But this is also largely due to the pace of digitalization, which has received a serious acceleration, allowing us to both ensure business continuity and develop new services. Even in 2020, when many companies and institutions were still in “battle mode,” consulting gurus told us that COVID forced us through a technology tipping point and forced the digital world to change to the level of 2030 in just a few months. nine0010
With internet connectivity at an all-time high, there has never been a better time to develop smart farming technology, which is essentially «networked food production».
The main opportunities identified by SAG are the standardization of interfaces and the way data are collected, formatted, stored and exchanged throughout the food supply chain, as well as the optimization of production methods based on precision agriculture and new cultivation technologies. nine0010
Precision farming is perhaps the most widely understood way to shape smart agriculture. It has been around in one form or another for several decades — for example, we already have automatic control capabilities that make much better use of time and labor in the field. But only now, thanks to technologies such as artificial intelligence (AI), we have the ability to collect, process and interpret data at a fast enough pace to provide farmers with valuable insights at the right time and consistently help them grow their crops profitably, sustainably and in compliance with regulations. . nine0010
Precision agriculture involves applying input data in the most efficient way, as it allows for minute changes in growth rates, soil conditions, pest and disease levels within a crop to be accounted for. Thus, fertilizers, for example, are applied only where they are really needed at the moment. Given the huge amount of energy required to manufacture synthetic fertilizers, their efficient use is essential to reduce the carbon footprint of the food that ends up on our plates. The same can be said for any technology that reduces waste, such as mechanical weeding robots that use artificial intelligence to recognize and isolate unwanted plants, and then destroy them with a laser. nine0010
Farm Management Information Systems (FMIS) provide an overview of all operations occurring on one or even several farms at once. Again, the concept itself is no longer new, but the degree of connectivity and the ability to securely store and access information about operations has opened the way for us to new levels of management with the support of external consultants, such as agronomists, who can develop ideas and strategies without spending a lot of time. for travel between locations. nine0010
By comparing stock levels, looking at historical consumption and current production levels, suppliers can work with farmers to make more accurate forecasts. This means that planting and harvesting, especially of fast-growing crops (such as lettuces and herbs), can be done in response to demand, significantly reducing waste and post-harvest losses. To make this a reality, remote farms will need reliable, high-speed connectivity as well as a standardized way to securely share, store, process, and interpret information from the fields. nine0010
Robotics and automation go hand in hand with precision agriculture. Machines not only apply variable fertilizer rates more accurately in the pursuit of absolute precision, but they can make a real difference in improving the working conditions of farmers and agricultural workers. After all, farming is a hard business, often requiring long days of hard work, which can also be quite dangerous. And while it is certainly possible to take precautions to minimize the biggest risks (such as working at heights, or carrying heavy loads, or using chemicals), my personal experience on farms is that such precautions are all too often ignored, especially when operations must be carried out within a limited time frame to suit the weather, market requirements or crop maturation. nine0010
ISO members active in smart farming
The core ISO SAG includes the national standards bodies of the following countries:
Argentina, Australia, Brazil, Canada, China, France, Germany, India, Iran, Italy, Japan, Korea, Netherlands, New Zealand, Rwanda, Russia, Saudi Arabia, Singapore, Switzerland, UK, USA.
Smart farming for human prosperity
In addition to making our lives safer, robotics and automation can also help improve a farm’s weak profitability, or even its viability. The general movement of people to cities is an important part of efficient and diverse life on a changing planet, but it means there is a dearth of people willing to roll up their sleeves and work on the farm. In many developed countries, the lack of movement of people during the COVID-19 pandemicled to the fact that the crop simply rotted right in the field. The growth of automated agriculture may be one solution to the important problem of the outflow of the rural population.
We need to find agricultural land that is equivalent to the combined area of Italy, Japan, New Zealand, France, South Korea and Germany.
Small farmers can also benefit from the new data standards created through the work of the SAG. As smartphones become more accessible, it is becoming easier for these most vulnerable farmers to access more effective risk management tools such as crop insurance, use AI-based diagnostic tools that can help them better care for their crops when away from the field. qualified agronomists, and even access market data and sell their crops at the best price for them. In addition to the examples above, there are hundreds of ways to further develop specific technologies within the ISO smart farming SAG project. nine0010
In 2020, a group of international researchers published a detailed overview of the state of smart farming in the journal Agronomy. In addition to detailing the current state and future possibilities of smart farming, the article provides a map of the types of smart farming technologies that will address the challenges of growing crops in open fields.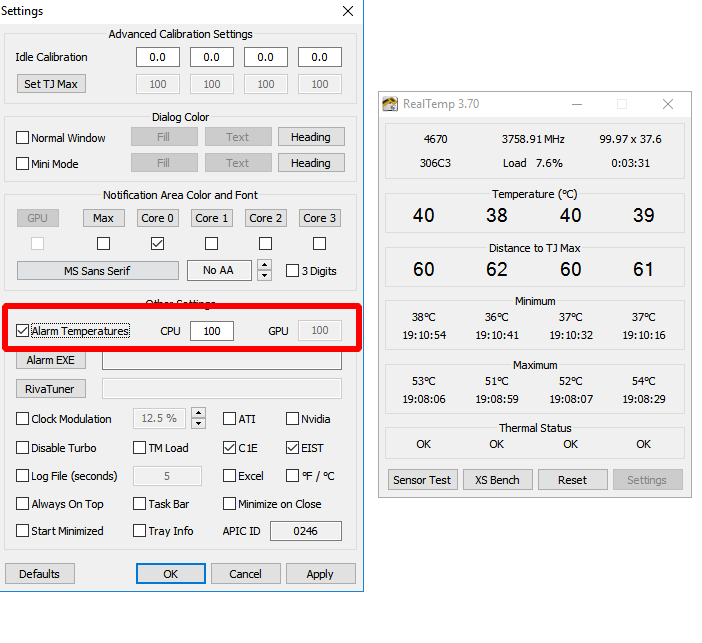 It points to the clear role of standards in ensuring compatibility and compliance with evolving legislation. nine0010
Protecting our planet and meeting our needs
A 2021 article in Nature Sustainability explores some of the problems of farming and their potential solutions. It sets the scene in the following way: “If current agricultural trends continue, pressures on biodiversity will increase substantially; projections based on population growth and dietary transitions estimate the need for two to ten million square kilometers of new agricultural land, largely cleared at the expense of natural habitats.” nine0010
Let’s just get that into perspective. Taking the lower figure, we’d potentially need to find farmland with the equivalent combined area of Italy, Japan, New Zealand, France, South Korea and Germany. The upper figure exceeds the size of Canada or China.
The only way to create such farmland would be to clear all the other stuff away from existing terrain.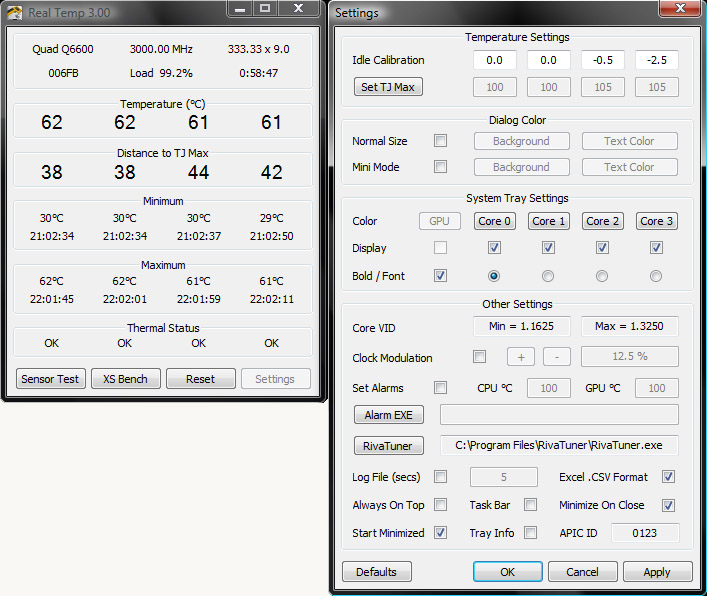 Things like wetlands, forests, parks and wilderness, together with the plants, fungi, bugs, birds, people and other animals that live there. nine0010
Whilst the UN Climate Change Conference, and every generation of its offspring up to COP26, has seen “commitments” from governments and “engagements” by corporate actors, we’re still setting new records in global deforestation. We’re destroying unique ecosystems that help regulate the planet’s climate. That makes it even more likely that rising sea levels will submerge low-lying areas and actually reduce the habitable surface of the planet, forcing populations to move and putting additional pressure on the areas where we can grow food. nine0010
In 2022, our species urgently requires solutions that adequately address our most fundamental need: growing enough food for everyone to eat. Recognizing the vital importance of farming to our future, ISO is bringing the world’s experts in agriculture, and many other sectors, together in the new smart farming SAG.
For ISO, smart farming isn’t just mixing tech and tillage for the sake of it. It’s about addressing a pressing sustainability problem. Namely, world population and demand for food are going to rise (a lot) before flattening out and becoming manageable. That means finding new ways to define and manage our priorities and our resources, especially when it comes to land and water use. nine0010
Protecting our planet and meeting our own needs
An article published in Nature Sustainability in 2021 looks at some of the challenges of agriculture and their potential solutions. It states: “If current agricultural trends continue, pressures on biodiversity will increase substantially; projections based on population growth and dietary shifts will require between two and ten million square kilometers of new agricultural land, which will be cleared largely by account of the natural habitats of animals and plants. nine0010
Let’s put this into perspective. At the lowest value, we would potentially need to find farmland with the equivalent combined area of Italy, Japan, New Zealand, France, South Korea, and Germany, while the upper value exceeds the area of Canada or China.
The only way to create such farmland is to remove everything else from the existing terrain. Namely, to destroy such natural landscapes as swamps, forests, parks and other wild landscapes, together with all plants, mushrooms, beetles, birds, people and other animals that live there. nine0010
Despite the fact that at the UN Climate Change Conference and in every generation of its descendants up to COP26 there were «commitments» of governments and «statements of participation» of corporations, we still set new records for global clearing of primary forests. We are destroying the unique ecosystems that help regulate our planet’s climate, making it even more likely that rising sea levels will flood low-lying areas and actually shrink the planet’s habitable surface, forcing populations to move even faster and putting additional pressure on where we are. we can potentially grow food. nine0010
In 2022, our species urgently needs solutions that will adequately meet our most basic need: growing enough food for everyone. Recognizing the vital importance of agriculture to our future, ISO is bringing together the world’s experts in agriculture and many other industries in the new Smart Farming SAG.
For ISO, smart farming is more than just blending technology and tillage for the sake of it. It is about addressing the pressing issue of environmental sustainability. Namely, the planet’s population and food demand will grow (very strongly) before leveling off and becoming manageable. This means finding new ways to define and manage our priorities and resources, especially when it comes to the use of land and water. nine0010
Principal technical committees dealing with smart agriculture
ISO/IEC JTC 1/SC 41
Internet of things and digital twin
ISO/TC 23
Tractors and machinery for agriculture and forestry
ISO/TC 34
Food products
ISO/TC 93
Starch (including derivatives and by-products)
ISO/TC 154
Processes, data elements and documents in commerce, industry and administration
ISO/TC 190
Soil quality
ISO/TC 184
Automation systems and integration
Core smart farming Technical committees
ISO/TC 207
Environmental management
ISO/TC 211
Geographic information/ Geomatics
ISO/TC 268
Sustainable cities and communities
ISO/TC 274
Light and lighting
ISO/TC 281
Fine bubble technology
ISO/TC 282
Water reuse
ISO/TC 293
Feed machinery
Core smart farming Technical committees
ISO/TC 299
Robotics
ISO/TC 315
Cold chain logistics
ISO/
ISO/TC 331
Biodiversity
ISO/CASCO
Committee on conformity assessment
ISO/COPOLCO
Committee on consumer policy
Five Questions to Code
In an effort to learn more about the role of standards on World Food Safety Day, we asked Tom Heilandt of the United Nations Commission on Food Safety, Codex Alimentarius.