Intel Core 2 Duo T9300 Processor Benchmarks and Specs
|
|
|
|
|
Intel Core 2 Duo T9300 Processor Benchmarks and Specs
Specifications of the Intel Core 2 Duo T9300 processor dedicated to the mid-range laptop sector, it has 2 cores, 2 threads, a maximum frequency of 2,5GHz. The table below makes it possible to observe well the lithography, the number of transistors (if present), the offered cache memory, the maximum capacity of RAM memory that we can get, the type of compatible memory, the release date, the maximum number of PCIe lanes, the values obtained in the Passmark platform, Cinebench R23 and Geekbench 5.
Note: Commissions may be earned from the link above.
This page contains references to products from one or more of our advertisers. We may receive compensation when you click on links to those products. For an explanation of our advertising policy, please visit this page.
Specifications:
| Processor | Intel Core 2 Duo T9300 | |||
| Market (main) | Mid-range laptop | |||
| ISA | x86-64 (64 bit) | |||
| Microarchitecture | Core | |||
| Core name | Penryn-3M | |||
| Family | Core 2 Duo 9000 | |||
| Part number(s), S-Spec |
BX80576T9300, |
|||
| Release date | Q1 2008 | |||
| Lithography | 45 nm | |||
| Transistors | 410. 000.000 000.000 |
|||
| Cores | 2 | |||
| Threads | 2 | |||
| Frequency | 2,5 GHz | |||
| Bus speed | 0,8 GT/s | |||
| Cache memory | 6 MB | |||
| Max memory capacity | 4 GB | |||
| Memory types |
DDR2-666 |
|||
| TDP | 35 W | |||
| GPU integrated graphics | None | |||
| Socket | PGA478, BGA479 | |||
| Maximum temperature | 105°C | |||
| Security |
Execute Disable Bit |
|||
| CPU-Z single thread | 252 | |||
| CPU-Z multi thread | 476 | |||
| Cinebench R15 single thread | 72 | |||
| Cinebench R15 multi-thread | 136 | |||
| Cinebench R20 single thread | 162 | |||
| Cinebench R20 multi-thread | 307 | |||
| PassMark single thread | 1. 007 007 |
|||
| PassMark CPU Mark | 935 | |||
| (Windows 64-bit) Geekbench 4 single core |
1.621 | |||
| (Windows 64-bit) Geekbench 4 multi-core |
2.634 | |||
| (Windows) Geekbench 5 single core |
386 | |||
| (Windows) Geekbench 5 multi-core |
676 | |||
| (SGEMM) GFLOPS performance |
24,8 GFLOPS | |||
| (Multi-core / watt performance) Performance / watt ratio |
75 pts / W | |||
| Amazon | ||||
| eBay |
Note: Commissions may be earned from the links above.
Performance with the benchmarks:
Performance comparison between this processor and those of equivalent power, for this we consider the results generated on benchmark softwares such as Geekbench 4.
Price: For technical reasons, we cannot currently display a price less than 24 hours, or a real-time price. This is why we prefer for the moment not to show a price. You should refer to the respective online stores for the latest price, as well as availability.
Performance comparison on the CPU-Z benchmark software for IT processors:
| CPU-Z — Multi-thread & single thread score | |
|---|---|
|
Intel Core i5-L16G7 |
204 611 |
|
Intel Core i5-8200Y |
229 576 |
|
AMD Ryzen 3 2300U |
322 556 |
|
AMD 3020e |
276 556 |
|
Intel Pentium Gold 4425Y |
178 483 |
|
Intel Core 2 Duo T9300 |
252 476 |
|
Intel Celeron N4020 |
206 418 |
|
AMD Ryzen 3 3200U |
134 402 |
|
Intel Celeron 3867U |
194 389 |
|
Intel Celeron 4205U |
191 384 |
Note: Commissions may be earned from the links above. These scores are only an
average of the performances got with these processors, you may get different results.
CPU-Z is a system information software that provides the name of the processor, its model number, the codename, the cache levels, the package, the process. It can also gives data about the mainboard, the memory. It makes real time measurement, with finally a benchmark for the single thread, as well as for the multi thread.
Performance comparison on the Cinebench R15 benchmark platform for IT devices:
| Cinebench R15 — Multi-thread & single thread score | |
|---|---|
|
AMD 3020e |
80 187 |
|
AMD PRO A6-7350B |
57 166 |
|
Intel Pentium Gold 4425Y |
70 160 |
|
Intel Celeron N4020 |
80 145 |
|
Intel Celeron 4205U |
73 138 |
|
Intel Core 2 Duo T9300 |
72 136 |
|
Intel Celeron 3867U |
68 127 |
|
AMD A6-9225 |
70 110 |
|
AMD A4-9125 |
60 100 |
|
AMD A9-9420e |
51 95 |
Note: Commissions may be earned from the links above. These scores are only an
average of the performances got with these processors, you may get different results.
Cinebench R15 evaluates the performance of CPU calculations by restoring a photorealistic 3D scene. The scene has 2,000 objects, 300,000 polygons, uses sharp and fuzzy reflections, bright areas, shadows, procedural shaders, antialiasing, and so on. The faster the rendering of the scene is created, the more powerful the PC is, with a high number of points.
Performance comparison on the Cinebench R20 benchmark platform for computers:
| Cinebench R20 — Multi-thread & single thread score | |
|---|---|
|
Intel Core m3-8100Y |
208 416 |
|
Intel Celeron N4120 |
170 410 |
|
Intel Pentium Gold 4425Y |
160 370 |
|
AMD 3020e |
225 356 |
|
Intel Celeron 5205U |
151 330 |
|
Intel Core 2 Duo T9300 |
162 307 |
|
Intel Celeron N4020 |
170 300 |
|
Intel Celeron 3867U |
145 296 |
|
Intel Celeron 4205U |
158 279 |
|
AMD A6-9225 |
180 270 |
Note: Commissions may be earned from the links above. These scores are only an
average of the performances got with these processors, you may get different results.
Cinebench R20 is a multi-platform test software which allows to evaluate the hardware capacities of a device such as a computer, a tablet, a server. This version of Cinebench takes into account recent developments in processors with multiple cores and the latest improvements in rendering techniques. The evaluation is ultimately even more relevant.
Performance comparison on the Passmark benchmark platform for computing machines:
| PassMark — CPU Mark | |
|---|---|
|
Intel Celeron 4205U |
1.027 1.268 |
|
Intel Celeron 5205U |
934 1.266 |
|
AMD A4-9125 |
1.  028 0281.202 |
|
AMD A9-9420e |
990 1.128 |
|
AMD A6-9220e |
879 1.098 |
|
Intel Core 2 Duo T9300 |
1.007 935 |
|
AMD A4-9120e |
736 856 |
|
AMD A4-9120C |
821 755 |
Note: Commissions may be earned from the links above. These scores are only an
average of the performances got with these processors, you may get different results.
PassMark is a benchmarking software that performs several performance tests including prime numbers, integers, floating point, compression, physics, extended instructions, encoding, sorting. The higher the score is, the higher is the device capacity.
On Windows: performance comparison in Geekbench 4 with Windows operating system.
| Geekbench 4 — Multi-core & single core score — Windows 64-bit | |
|---|---|
|
Intel Celeron 3867U |
2.129 3.537 |
|
Intel Celeron 4205U |
2.114 3.480 |
|
Intel Celeron N4020 |
1.991 3.426 |
|
AMD PRO A6-7350B |
2.228 3.219 |
|
AMD A6-9225 |
1.756 2.650 |
|
Intel Core 2 Duo T9300 |
1.621 2.634 |
|
AMD A4-9125 |
1.  560 5602.393 |
|
AMD A9-9420e |
1.606 2.306 |
|
AMD A4-9120C |
1.328 2.013 |
|
AMD A6-9220e |
1.351 1.951 |
Note: Commissions may be earned from the links above. These scores are only an
average of the performances got with these processors, you may get different results.
On Linux: performance comparison in Geekbench 4 with Linux operating system.
| Geekbench 4 — Multi-core & single core score — Linux 64-bit | |
|---|---|
|
Intel Pentium Gold 4417U |
2.654 4.554 |
|
Intel Core i3-7020U |
2.  837 8374.361 |
|
Intel Celeron N4120 |
1.918 3.913 |
|
AMD PRO A6-7350B |
2.306 3.517 |
|
AMD A6-9225 |
2.024 2.943 |
|
Intel Core 2 Duo T9300 |
1.682 2.448 |
|
AMD A4-9120C |
1.695 2.437 |
|
AMD A9-9420e |
1.656 2.262 |
|
AMD A6-9220e |
1.538 2.134 |
|
AMD A4-9125 |
1.430 1.513 |
Note: Commissions may be earned from the links above. These scores are only an
average of the performances got with these processors, you may get different results.
On MAC OS X: performance comparison in Geekbench 4 with MAC OS X operating system.
| Geekbench 4 — Multi-core & single core score — Mac OS X 64-bit | |
|---|---|
|
Intel Core i5-8210Y |
3.943 7.207 |
|
Intel Core i3-8130U |
3.423 6.517 |
|
Intel Core m3-8100Y |
3.731 6.148 |
|
Intel Core i7-8500Y |
4.093 6.058 |
|
Intel Core i3-7020U |
2.902 5.395 |
|
Intel Core 2 Duo T9300 |
1.661 2.832 |
Note: Commissions may be earned from the links above. These scores are only an
average of the performances got with these processors, you may get different results.
Geekbench 4 is a complete benchmark platform with several types of tests, including data compression, images, AES encryption, SQL encoding, HTML, PDF file rendering, matrix computation, Fast Fourier Transform, 3D object simulation, photo editing, memory testing. This allows us to better visualize the respective power of these devices. For each result, we took an average of 250 values on the famous benchmark software.
On Windows: performance comparison in Geekbench 5 with Windows operating system.
| Geekbench 5 — Multi-core & single core score — Windows | |
|---|---|
|
Intel Celeron 5205U |
439 900 |
|
Intel Celeron N4020 |
468 851 |
|
Intel Celeron 3867U |
413 827 |
|
Intel Celeron 4205U |
423 814 |
|
Qualcomm Snapdragon 7c Gen 2 |
360 708 |
|
Intel Core 2 Duo T9300 |
386 676 |
|
AMD PRO A6-7350B |
419 668 |
|
AMD A4-9125 |
308 518 |
|
AMD A6-9225 |
319 506 |
|
AMD A9-9420e |
303 480 |
Note: Commissions may be earned from the links above. These scores are only an
average of the performances got with these processors, you may get different results.
On Linux: performance comparison in Geekbench 5 with Linux operating system.
| Geekbench 5 — Multi-core & single core score — Linux | |
|---|---|
|
AMD 3015Ce |
574 1.099 |
|
AMD Athlon Gold 3150U |
698 1.079 |
|
Intel Pentium Gold 4417U |
565 1.048 |
|
AMD 3015e |
429 686 |
|
Intel Celeron 3867U |
443 686 |
|
Intel Core 2 Duo T9300 |
414 668 |
|
Intel Pentium Gold 4425Y |
430 637 |
|
AMD PRO A6-7350B |
121 630 |
|
AMD A9-9420e |
398 598 |
|
AMD A4-9120e |
356 566 |
Note: Commissions may be earned from the links above. These scores are only an
average of the performances got with these processors, you may get different results.
On Android: performance comparison in Geekbench 5 with Android operating system.
| Geekbench 5 — Multi-core & single core score — Android | |
|---|---|
|
Intel Celeron 4305U |
502 892 |
|
Intel Celeron N4020 |
469 867 |
|
Intel Celeron 5205U |
451 826 |
|
Intel Celeron 3867U |
424 809 |
|
AMD A4-9125 |
408 667 |
|
Intel Core 2 Duo T9300 |
348 597 |
|
AMD A9-9420e |
381 483 |
|
AMD A4-9120C |
269 412 |
|
AMD A6-9220e |
343 398 |
Note: Commissions may be earned from the links above. These scores are only an
average of the performances got with these processors, you may get different results.
On macOS: performance comparison in Geekbench 5 with macOS operating system.
| Geekbench 5 — Multi-core & single core score — macOS | |
|---|---|
|
Intel Core i3-1000NG4 |
953 1.807 |
|
Intel Core i3-1115G4 |
990 1.802 |
|
Intel Core i3-8145U |
866 1.801 |
|
Intel Core m3-8100Y |
669 1.356 |
|
Intel Core i7-8500Y |
725 1.286 |
|
Intel Core 2 Duo T9300 |
340 658 |
|
AMD A6-9225 |
272 276 |
Note: Commissions may be earned from the links above.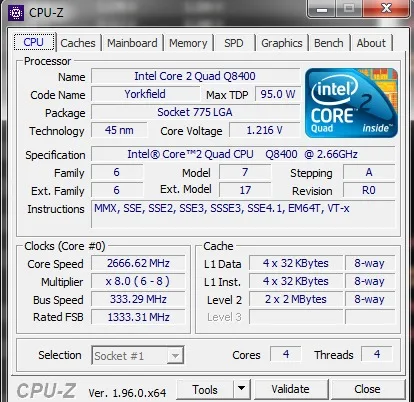 These scores are only an
average of the performances got with these processors, you may get different results.
Geekbench 5 is a software for measuring the performance of a computer system, for fixed devices, mobile devices, servers. This platform makes it possible to better compare the power of the CPU, the computing power and to compare it with similar or totally different systems. Geekbench 5 includes new workloads that represent work tasks and applications that we can find in reality.
List of comparisons:
AllwinnerAMDAMD A10AMD A12AMD A4AMD A6AMD A8AMD A9AMD AthlonAMD Athlon 64AMD Athlon 64 X2AMD Athlon GoldAMD Athlon IIAMD Athlon SilverAMD EPYCAMD FXAMD JaguarAMD OpteronAMD PhenomAMD RyzenAMD Ryzen 1000AMD Ryzen 2000AMD Ryzen 3AMD Ryzen 3 1000AMD Ryzen 3 2000AMD Ryzen 3 3000AMD Ryzen 3 4000AMD Ryzen 3 5000AMD Ryzen 3 MobileAMD Ryzen 3000AMD Ryzen 4000AMD Ryzen 5AMD Ryzen 5 1000AMD Ryzen 5 2000AMD Ryzen 5 3000AMD Ryzen 5 4000AMD Ryzen 5 5000AMD Ryzen 5 6000 MobileAMD Ryzen 5 7000AMD Ryzen 5 MobileAMD Ryzen 5000AMD Ryzen 6000 MobileAMD Ryzen 7AMD Ryzen 7 1000AMD Ryzen 7 2000AMD Ryzen 7 3000AMD Ryzen 7 4000AMD Ryzen 7 5000AMD Ryzen 7 6000 MobileAMD Ryzen 7 7000AMD Ryzen 7 MobileAMD Ryzen 7000AMD Ryzen 9AMD Ryzen 9 3000AMD Ryzen 9 4000AMD Ryzen 9 5000AMD Ryzen 9 6000 MobileAMD Ryzen 9 7000AMD Ryzen 9 MobileAMD Ryzen MobileAMD Ryzen ThreadripperAMD Ryzen Threadripper 1000AMD Ryzen Threadripper 2000AMD Ryzen Threadripper 3000AMD Ryzen Threadripper 5000AMD Ryzen Threadripper ProAMD ZenAMD Zen 2AMD Zen 3AMD Zen+AmlogicAppleARMARM CortexARM Cortex-A15ARM Cortex-A17ARM Cortex-A35ARM Cortex-A5ARM Cortex-A53ARM Cortex-A55ARM Cortex-A57ARM Cortex-A7ARM Cortex-A72ARM Cortex-A73ARM Cortex-A75ARM Cortex-A76ARM Cortex-A77ARM Cortex-A78ARM Cortex-A8ARM Cortex-A9ARM Cortex-X1ARM920TAutoChipsBroadcomDeca coreDodeca coreDual AMDDual AMD EPYCDual AMD OpteronDual coreDual Intel XeonDual Intel Xeon E5Dual Intel Xeon PlatinumHexa coreHexadeca coreHiSiliconHiSilicon KirinIBMIBM POWERIBM POWER10IBM POWER9Icosi coreIngenicIntelIntel Alder LakeIntel Amber LakeIntel Apollo LakeIntel AtomIntel Bay TrailIntel BraswellIntel BroadwellIntel Cascade LakeIntel Cascade Lake-XIntel CeleronIntel Celeron NIntel Coffee LakeIntel Comet LakeIntel CoreIntel Core 1000Intel Core 10000Intel Core 1100Intel Core 11000Intel Core 1200Intel Core 12000Intel Core 12000 MobileIntel Core 13000Intel Core 2Intel Core 2 DuoIntel Core 2 QuadIntel Core 2000Intel Core 3000Intel Core 4000Intel Core 5000Intel Core 6000Intel Core 7000Intel Core 8000Intel Core 9000Intel Core DuoIntel Core iIntel Core i3Intel Core i3-1000Intel Core i3-10000Intel Core i3-1100Intel Core i3-11000Intel Core i3-1200Intel Core i3-12000Intel Core i3-13000Intel Core i3-2000Intel Core i3-3000Intel Core i3-4000Intel Core i3-5000Intel Core i3-6000Intel Core i3-7000Intel Core i3-8000Intel Core i3-9000Intel Core i5Intel Core i5-1000Intel Core i5-10000Intel Core i5-1100Intel Core i5-11000Intel Core i5-1200Intel Core i5-12000Intel Core i5-12000 MobileIntel Core i5-13000Intel Core i5-2000Intel Core i5-3000Intel Core i5-4000Intel Core i5-5000Intel Core i5-6000Intel Core i5-7000Intel Core i5-8000Intel Core i5-9000Intel Core i7Intel Core i7 mobile quad coreIntel Core i7 quad coreIntel Core i7-1000Intel Core i7-10000Intel Core i7-1100Intel Core i7-11000Intel Core i7-1200Intel Core i7-12000Intel Core i7-12000 MobileIntel Core i7-13000Intel Core i7-2000Intel Core i7-3000Intel Core i7-4000Intel Core i7-5000Intel Core i7-6000Intel Core i7-6000KIntel Core i7-7000Intel Core i7-7000KIntel Core i7-8000Intel Core i7-9000Intel Core i9Intel Core i9-10000Intel Core i9-11000Intel Core i9-12000Intel Core i9-12000 MobileIntel Core i9-12000KIntel Core i9-13000Intel Core i9-13000KIntel Core i9-7000Intel Core i9-8000Intel Core i9-9000Intel Core mIntel Core m3Intel Core m5Intel Core XIntel deca coreIntel dual coreIntel Gemini LakeIntel HaswellIntel hexa coreIntel Ice LakeIntel Ivy BridgeIntel Kaby LakeIntel LGA1150Intel LGA1151Intel LGA1200Intel LGA1700Intel LGA775Intel octa coreIntel PentiumIntel Pentium 4Intel Pentium dual coreIntel Pentium GoldIntel Pentium IIIntel Pentium IIIIntel Pentium quad coreIntel Pentium SilverIntel quad coreIntel Raptor LakeIntel Rocket LakeIntel Sandy BridgeIntel SkylakeIntel Skylake-XIntel Tiger LakeIntel XeonIntel Xeon BronzeIntel Xeon E3Intel Xeon E5Intel Xeon GoldIntel Xeon PlatinumIntel Xeon WJLQMarvellMediaTekMediaTek DimensityMediaTek Helio GMediaTek Helio PMicrosoftMono coreNvidiaNvidia TegraNXPNXP i. MXNXP i.MX 8NXP i.MX 8MNXP i.MX 8XOcta coreOcta Intel XeonOctodeca coreQuad coreQuad Intel XeonQualcommQualcomm Kryo 260Qualcomm Kryo 468Qualcomm Kryo 585Qualcomm Kryo 670Qualcomm SnapdragonQualcomm Snapdragon 700Qualcomm Snapdragon 8Qualcomm Snapdragon 800 seriesRealtekRockchipSamsungSamsung ExynosSamsung Exynos 7Samsung Exynos 7 OctaSamsung Exynos 9Samsung Exynos 9 OctaSonyTessaradeca coreTexas InstrumentsUnisocUnisoc TigerXiaomiProcessors groups
List of benchmarks:
CPU-ZCinebench R15Cinebench R20Geekbench 4 on LinuxGeekbench 4 on Mac OS XGeekbench 4 on WindowsGeekbench 5 on AndroidGeekbench 5 on LinuxGeekbench 5 on macOSGeekbench 5 on WindowsPassMarkGFLOPS performance
Equivalence:
Intel Core 2 Duo T9300 AMD equivalent
Intel Core 2 Duo T9300 Specs, Price, and FPS in Games
Build a PC
| 2 | 2 | 2. 5 GHz 5 GHz |
| Cores | Threads | Base Frequency |
|---|
Geekbench 5 Single-Core
352
12%
Geekbench 5 Multi-Core
608
1%
Availability
No items available
Graphics Card
Resolution
Select game resolution
Graphics Settings
Select game graphics
Offset
…
Apply Offset
Value Rating
Performance Rating
Value per FPS
You will receive
… FPS
TOP 6 Games With Intel Core 2 Duo T9300
452
FPS
Counter-Strike: Global Offensive
750
FPS
League of Legends
320
FPS
VALORANT
182
FPS
Grand Theft Auto V
1009
FPS
Minecraft
194
FPS
Apex Legends
Alternatives For Core 2 Duo T9300
1080p, High
No alternatives — this is the best option
Specifications
| General | |
|---|---|
| Release Date | Jan 7th, 2008 |
| Segment | Mobile |
| Socket | Intel Socket P |
| Collection | Core 2 Duo |
| Codename | Penryn |
| Performance | |
|---|---|
| Cores | 2 |
| Threads | 2 |
| Base Frequency | 2. 5 GHz 5 GHz |
| Other | |
|---|---|
| Power Consumption | 35 W |
| Overclockable | No |
| Integrated Graphics | None |
Find out which of the 2 CPUs performs better, view a side-by-side specification comparison.
Core 2 Duo T9300
N/A Stock
Core i7-1165G7
N/A Stock
Core 2 Duo T9300
N/A Stock
Core i9-10910
N/A Stock
Core 2 Duo T9300
N/A Stock
Xeon E-2288G
N/A Stock
Core 2 Duo T9300
N/A Stock
Core i7-1068NG7
N/A Stock
Core 2 Duo T9300
N/A Stock
Core i7-10875H
N/A Stock
Core 2 Duo T9300
N/A Stock
Xeon E-2276M
N/A Stock
Refine results to filter 1678 processors by performance, release date, price, and value. Click on a CPU to view more in-depth specifications and game FPS.
Calculation Parameters
Graphics Card
Resolution
Select game resolution
Graphics Settings
Select game graphics
Sort By
Popularity
Filters
Performance Rating
Value Rating
CPU Type
Desktop
25
Mobile
0
Server
0
Found 1678 CPUs.
Popularity
Processor
Performance
Ryzen 5 5600X
Nov 5th, 2020
Performance Rating
$156.63 on Amazon
In Stock
Ryzen 7 5800X3D
Apr 20th, 2022
Performance Rating
$323 on Amazon
In Stock
Ryzen 7 5800X
Nov 5th, 2020
Performance Rating
$220.95 on Amazon
In Stock
Ryzen 7 5700X
Apr 4th, 2022
Performance Rating
$189 on Amazon
In Stock
Ryzen 5 5600G
Apr 13th, 2021
Performance Rating
$128.97 on Amazon
In Stock
Core i9-13900K
Sep 27th, 2022
Performance Rating
$579.99 on Amazon
In Stock
Ryzen 7 5700G
Apr 13th, 2021
Performance Rating
$178 on Amazon
In Stock
Ryzen 9 5900X
Nov 5th, 2020
Performance Rating
Core i7-12700K
Nov 4th, 2021
Performance Rating
$309. 95 on Amazon
In Stock
Core i7-13700K
Sep 27th, 2022
Performance Rating
$417.95 on Amazon
In Stock
Core i5-12600KF
Nov 4th, 2021
Performance Rating
$213.82 on Amazon
In Stock
Ryzen 7 7700X
Sep 27th, 2022
Performance Rating
$340.89 on Amazon
In Stock
Core i7-13700KF
Sep 27th, 2022
Performance Rating
$398.79 on Amazon
In Stock
Core i5-13600K
Sep 27th, 2022
Performance Rating
$319.84 on Amazon
In Stock
Core i7-12700KF
Nov 4th, 2021
Performance Rating
$277.96 on Amazon
In Stock
Ryzen 5 5600
Apr 20th, 2022
Performance Rating
$139.79 on Amazon
In Stock
Ryzen 5 3600
Jul 7th, 2019
Performance Rating
$107.99 on Amazon
In Stock
Core i5-12600K
Nov 4th, 2021
Performance Rating
$233. 99 on Amazon
In Stock
Ryzen 5 7600X
Sep 27th, 2022
Performance Rating
$240.86 on Amazon
In Stock
Core i7-11700K
Mar 16th, 2021
Performance Rating
$239.99 on Amazon
In Stock
Ryzen 9 5950X
Nov 5th, 2020
Performance Rating
$498 on Amazon
In Stock
Core i5-13600KF
Sep 27th, 2022
Performance Rating
$296.96 on Amazon
In Stock
Ryzen 9 7900X
Sep 27th, 2022
Performance Rating
$448 on Amazon
In Stock
Core i3-12100F
Jan 29th, 2022
Performance Rating
$106.93 on Amazon
In Stock
Core i5-12400
Jan 4th, 2022
Performance Rating
$182.99 on Amazon
In Stock
- Previous
- 1
- 2
- 3
- 4
- …
- 66
- 67
- 68
- Next
Intel Core 2 Duo T9300
Top specifications and features
- PassMark CPU score
- Heat dissipation (TDP)
- Technological process
- Number of transistors
- Number of Cores
PassMark CPU
Intel Core 2 Duo T9300 score:
1755
Best score:
89379
Test results
Intel Core 2 Duo T9300:
13933
Best score:
Technologies
Intel Core 2 Duo T9300:
1000
Best score:
Performance
Intel Core 2 Duo T9300:
1699
Best score:
Memory Specification
Intel Core 2 Duo T9300:
19
Best score:
Description
Intel Core 2 Duo T9 processor300 runs at 2. 5Hz. 2 cores available. Power consumption at peak times can reach 35 watts.
Intel Core 2 Duo T9300 runs on 45nm architecture. Total number of transistors 410 million
Regarding memory specification.
Now about the tests of Intel Core 2 Duo T9300. According to PassMark, the processor scored 1755 of the possible points. Based on the analysis of more than 4000 processors, Intel Core 2 Duo T9300 ranked 1654 in the ranking of the best.
Why Intel Core 2 Duo T9300 is better than others
- Thermal Dissipation (TDP) 35 W. This parameter is lower than 72% of products
- The base clock frequency of the processor is 2.5 GHz. This parameter is higher than that of 40% of goods
- L2 cache size 6 MB. This parameter is higher than that of 66% of goods
- PassMark CPU score 1755 . This parameter is lower than that of 34% of products
- 45 nm process. This parameter is higher than that of 67% of goods
- Number of transistors 410 million.
 This parameter is lower than that of 33% of goods
 - Number of cores 2 . This parameter is lower than 85% of products
- L1 cache size 128 KB. This parameter is lower than that of 53% of goods
Overview Intel Core 2 Duo T9300
Test results
Technologies
Performance
Memory specification
Interfaces and communications
Main characteristics
Intel Core 2 Duo T9300 Review: Highlights
PassMark CPU score
The PassMark benchmark considers read speed, write speed, and seek time when testing SSD performance.
Show all
1755
max 89379
Average: 6033.5
89379
3DMark06 test score
2335
max 18628
Average: 3892.6
18628
Function Execution override bit
Yes
Intel Trusted Execution Technology
No
L1 cache size
Large amount of L1 memory accelerates results in CPU and system performance settings
Show all
128KB
max 4608
Average: 299. 3 KB
3 KB
4608KB
L2 cache size
Large scratchpad L2 cache to increase processor speed and overall system performance.
Show all
6MB
max 512
Average: 4.5 MB
512MB
Number of cores
2
max 72
Mean: 5.8
72
Processor base clock speed
2.5GHz
max 4.7
Average: 2.5 GHz
4.7GHz
Idle states
Yes
FSB parity
No
System bus frequency
Data between computer components and other devices is transferred via the bus.
Show all
800 GT/s
max 1600
Average: 156.1 GT/s
1600 GT/s
Enhanced SpeedStep (EIST)
Yes
Hyper-Threading Technology
Many Intel processors use state-of-the-art hyper-threading technology. Thus, each processor core works simultaneously on two threads, which significantly increases performance. Most processors work on the principle: one thread per core, therefore, their performance is lower.
Show all
No
Socket
PGA478. BGA479
Demand Based Switching
No
TXT
No
EDB
Yes
VT-x
Yes
Process technology
The small size of the semiconductor means it is a new generation chip.
45 nm
Average: 36.8 nm
5nm
Number of transistors
410 million
max 57000
Average: 1517.3 million
57000 million
Heat Dissipation (TDP)
The Heat Dissipation Requirements (TDP) is the maximum amount of energy that can be dissipated by the cooling system. The lower the TDP, the less power will be consumed.
Show all
35W
Average: 67.6W
0.025W
Status
Discontinued
Release date
01/01/2008
Embedded options available
No
Case size
35mm x 35mm
Supports 64-bit system
A 64-bit system, unlike a 32-bit system, can support more than 4 GB of RAM. This increases productivity. It also allows you to run 64-bit applications.
Show all
Yes
Maximum processor temperature
If the maximum temperature at which the processor operates is exceeded, a reset may occur.
Show all
105°C
max 110
Average value: 96 °C
110°C
Codename
Penryn
Destination
Mobile
FAQ
How fast is the 5600X Intel Core 2 Duo T9300?
The processor runs at 2.5 GHz.
How many cores does the Intel Core 2 Duo T9300 have?
2 cores.
What is the socket of the Intel Core 2 Duo T9300
PGA478 is used to install the Intel Core 2 Duo T9300. BGA479.
Is the Intel Core 2 Duo T9300 a 64-bit processor
Yes
What architecture does the Intel Core 2 Duo T9300 use?
The Intel Core 2 Duo T9300 is based on the Penryn architecture.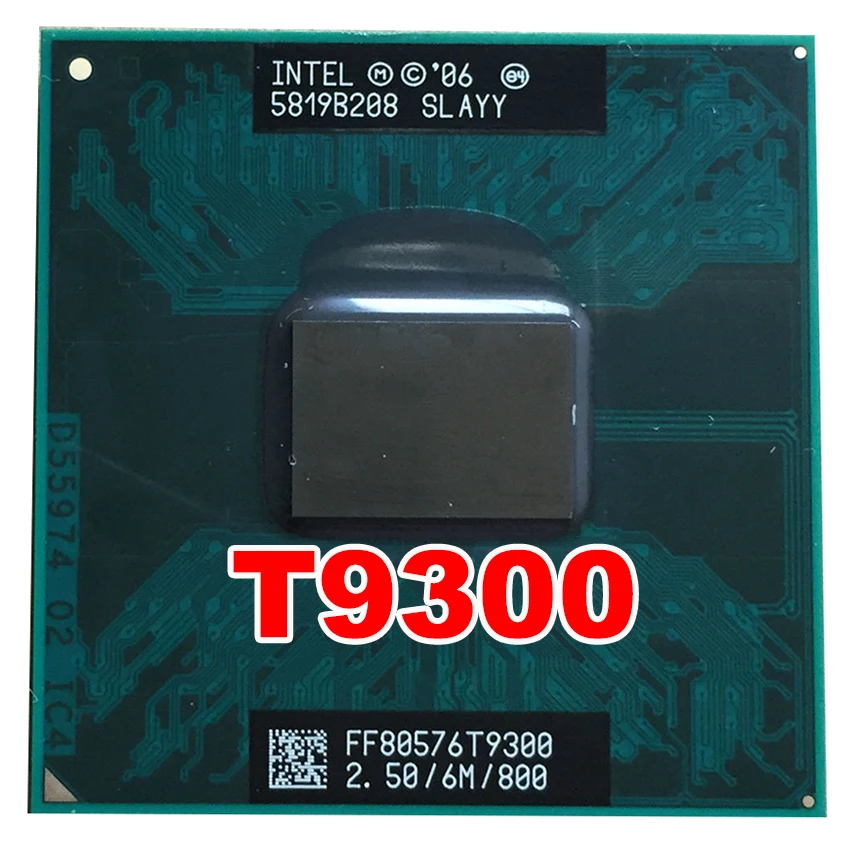
What is the frequency of the Intel Core 2 Duo T9 processor300?
Intel Core 2 Duo T9300 processor running at 2.5 Hz.
How many watts does the Intel Core 2 Duo T9300 consume?
Power consumption at peak times can be up to 35 watts.
AMD Ryzen Threadripper PRO 5995WX
VS
Intel Celeron 6305
AMD Ryzen Threadripper PRO 5995WX
VS
Intel Celeron G4930T
AMD Ryzen Threadripper PRO 5995WX
VS
Intel Core i5-4200U
AMD Ryzen Threadripper PRO 5995WX
VS
Intel Celeron G3900
AMD Ryzen Threadripper PRO 5995WX
VS
Intel Xeon E5430
AMD Ryzen Threadripper PRO 5995WX
VS
Intel Core i3-3220
AMD Ryzen Threadripper PRO 5995WX
VS
Intel Core i5-4250U
AMD Ryzen Threadripper PRO 5995WX
VS
Intel Core M-5Y51
AMD Ryzen Threadripper PRO 5995WX
VS
Intel Pentium G4400TE
AMD Ryzen Threadripper PRO 5995WX
VS
AMD Athlon II X4 638
AMD Ryzen Threadripper PRO 5995WX
VS
AMD A10-5750M
AMD Ryzen Threadripper PRO 5995WX
VS
AMD Phenom II X4 925
AMD Ryzen Threadripper PRO 5995WX
VS
Intel Pentium G3460
AMD Ryzen Threadripper PRO 5995WX
VS
Intel Xeon L5520
AMD Ryzen Threadripper PRO 5995WX
VS
AMD Athlon II X4 640
AMD Ryzen Threadripper PRO 5995WX
VS
Intel Xeon X3350
AMD Ryzen Threadripper PRO 5995WX
VS
Intel Core i3-5010U
AMD Ryzen Threadripper PRO 5995WX
VS
AMD PRO A8-8600B
AMD Ryzen Threadripper PRO 5995WX
VS
Intel Pentium N4200
AMD Ryzen Threadripper PRO 5995WX
VS
AMD Athlon II X4 641
leave your feedback
Core 2 Duo T9300 [in 7 benchmarks]
Intel
Core 2 Duo T9300
- Interface
- Core frequency
- Video memory size
- Memory type
- Memory frequency
- Maximum resolution
Description
Intel launched the Intel Core 2 Duo T9300 on January 10, 2008 at a suggested retail price of $316.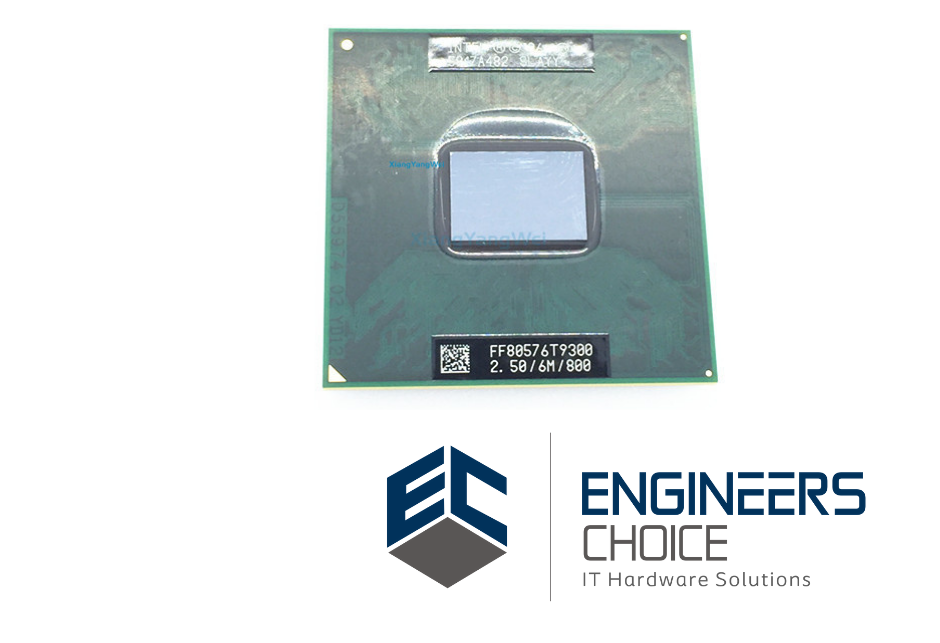 This is a notebook processor based on the Penryn architecture, primarily designed for office systems. It has 2 cores and 2 threads and is manufactured using 45 nm process technology, the maximum frequency is 2500 MHz, the multiplier is locked.
In terms of compatibility, this is a processor for socket PGA478, BGA479 with a TDP of 35W.
It provides poor benchmark performance at
1.35%
from the leader, which is AMD EPYC 9654.
EPYC
9654
Compare
General information
Core 2 Duo T9 type (desktop or laptop) and architecture details0005
| Enhanced SpeedStep (EIST) | + | |
| Turbo Boost Technology | — | |
| Hyper-Threading Technology | — | |
| Idle States | + | |
| Demand Based Switching0004
Technologies supported by Core 2 Duo T9300 that speed up virtual machines are listed. Benchmark testsThese are the results of Core 2 Duo T9300 performance tests in non-gaming benchmarks. The overall score is set from 0 to 100, where 100 corresponds to the fastest processor at the moment. Overall performance in testsThis is our overall performance rating. We regularly improve our algorithms, but if you find any inconsistencies, feel free to speak up in the comments section, we usually fix problems quickly.
Core 2 Duo T9300
Passmark Passmark CPU Mark is a widely used benchmark that consists of 8 different tests, including integer and floating point calculations, extended instruction tests, compression, encryption, and game physics calculations. Benchmark coverage: 67%
Core 2 Duo T9300 GeekBench 5 Single-CoreGeekBench 5 Single-Core is a cross-platform application designed as CPU benchmarks that independently recreate certain real world tasks that can accurately measure performance. This version uses only one processor core. Benchmark coverage: 37%
Core 2 Duo T9300 GeekBench 5 Multi-CoreGeekBench 5 Multi-Core is a cross-platform application designed as CPU benchmarks that independently recreate certain real world tasks that can accurately measure performance. This version uses all available processor cores. Benchmark coverage: 37%
Core 2 Duo T9300 Cinebench 10 32-bit single-core Cinebench R10 is a very outdated ray tracing benchmark for processors developed by the authors of Cinema 4D, Maxon. Benchmark coverage: 20%
Core 2 Duo T9300 Cinebench 10 32-bit multi-coreCinebench Release 10 Multi Core is a variant of Cinebench R10 that uses all processor threads. The possible number of threads in this version is limited to 16. Benchmark coverage: 19%
Core 2 Duo T9300 3DMark06 CPU3DMark06 is an outdated set of benchmarks based on DirectX 9 by Futuremark. Its processor part contains two tests, one of which calculates the pathfinding of game AI, the other emulates game physics using the PhysX package. Benchmark coverage: 19%
Core 2 Duo T9300 Relative capacityOverall performance of the Core 2 Duo T9300 compared to its nearest competitor in notebook processors.
Intel Core i7-2617M
AMD A4-7210
Intel Core i3-3120M
Intel Core 2 Duo T9300
AMD A8-4500M
AMD A6-6310
Intel Core i3-4005U Competitor from AMDWe believe that the nearest equivalent to Core 2 Duo T9300 from AMD is A6-6310, which is slower by 1% and lower by 1 position in our rating on average. Compare Here are some of AMD’s closest competitors to the Core 2 Duo T9300:
AMD A8-5557M
AMD Phenom II X3 N870
AMD A4-7210
Intel Core 2 Duo T9300
AMD A8-4500M
AMD A6-6310
AMD A6-5200 Other processorsHere we recommend several processors that are more or less similar in performance to the reviewed one. Compare Compare Compare Compare Compare Compare Best graphics cards for Core 2 Duo T9300 We have 169 configurations based on Core 2 Duo T9300 in our database. According to statistics, these cards are most often used with Core 2 Duo T9300: 7.7% 6.5% 5.3% 4.7% 3.6% 3% 2.4% 2.4% 1. 1.8% Here are the most powerful video cards used with Core 2 Duo T9300 according to user statistics: 1.2% (2/169) 0.6% (1/169) 0.6% (1/169) 0.6% (1/169) 0.6% (1/169) 3% (5/169) 0. |

 Also includes a separate single-threaded test.
  The Single-Core version uses a single CPU thread to render a futuristic motorcycle model.
  74
74
 26
26

 8%
8% 