FX-7500 [in 18 benchmarks]
AMD
FX-7500
Buy
- Interface
- Core clock speed
- Max video memory
- Memory type
- Memory clock speed
- Maximum resolution
Summary
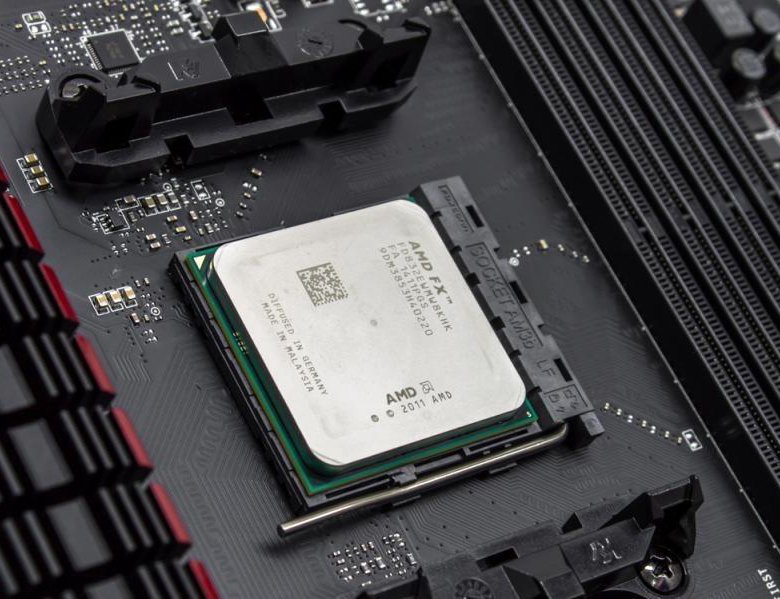
AMD started AMD FX-7500 sales 4 June 2014. This is Kaveri architecture notebook processor primarily aimed at office systems. It has 4 cores and 4 threads, and is based on 28nm manufacturing technology, with a maximum frequency of 3300 MHz and a locked multiplier.
Compatibility-wise, this is FP3 processor with a TDP of 19 Watt. It supports DDR3-1600 memory.
It provides poor benchmark performance at
3.18%
of a leader’s which is AMD EPYC 7h22.
FX
7500
vs
EPYC
7h22
General info
FX-7500 processor market type (desktop or notebook), architecture, sales start time and pricing.
| Place in performance rating | 1582 | |
| Market segment | Laptop | |
| Series | AMD Kaveri | |
| Architecture codename | Kaveri (2014−2015) | |
| Release date | 4 June 2014 (8 years ago) | |
| Current price | $267 | of 18494 (Xeon Platinum 8280M) |
Technical specs
Basic microprocessor parameters such as number of cores, number of threads, base frequency and turbo boost clock, lithography, cache size and multiplier lock state. These parameters can generally indicate CPU performance, but to be more precise you have to review its test results.
| Physical cores | 4 (Quad-Core) | |
| Threads | 4 | |
| Base clock speed | 2. 1 GHz 1 GHz |
of 4.7 (FX-9590) |
| Boost clock speed | 3.3 GHz | of 5.8 (Core i9-13900K) |
| L2 cache | 4096 KB | of 12288 (Core 2 Quad Q9550) |
| Chip lithography | 28 nm | of 5 (Apple M1) |
| Die size | 245 mm2 | |
| Number of transistors | 2410 Million | of 9900000 (Ryzen 9 7950X) |
| 64 bit support | + | |
| Windows 11 compatibility | — |
Compatibility
Information on FX-7500 compatibility with other computer components and devices: motherboard (look for socket type), power supply unit (look for power consumption) etc. Useful when planning a future computer configuration or upgrading an existing one.
Note that power consumption of some processors can well exceed their nominal TDP, even without overclocking. Some can even double their declared thermals given that the motherboard allows to tune the CPU power parameters.
| Socket | FP3 | |
| Thermal design power (TDP) | 19 Watt | of 400 (Xeon Platinum 9282) |
Technologies and extensions
Technological capabilities and additional instructions supported by FX-7500. You’ll probably need this information if you require some particular technology.
| Instruction set extensions | 86x SSE (1, 2, 3, 3S, 4.1, 4.2, 4A),-64, AES, AVX, FMA, DDR3-1600 Controller | |
| AES-NI | + | |
| FMA | + | |
| AVX | + | |
| FRTC | 1 | |
| PowerTune | — | |
| TrueAudio | + | |
| PowerNow | + | |
| PowerGating | + | |
| Out-of-band client management | + | |
| VirusProtect | + | |
| HSA | 1 |
Virtualization technologies
Supported virtual machine optimization technologies. Some are specific to Intel only, some to AMD.
| AMD-V | 1 | |
| IOMMU 2.0 | + |
Memory specs
Types, maximum amount and channel number of RAM supported by FX-7500’s memory controller. Depending on the motherboard, higher memory frequency may be supported.
| Supported memory types | DDR3-1600 | of 5200 (Ryzen 5 7600X) |
| Max memory channels | 2 | of 12 (Xeon Platinum 9221) |
Graphics specifications
General parameters of GPU integrated into FX-7500.
| Integrated graphics card | AMD Radeon R7 Graphics | |
| iGPU core count | 6 | |
| Enduro | + | |
| Switchable graphics | 1 | |
| UVD | + | |
| VCE | + |
Graphics interfaces
Available interfaces and connections of FX-7500’s integrated GPU.
| DisplayPort | + | |
| HDMI | + |
Graphics API support
APIs supported by FX-7500’s integrated GPU, sometimes API versions are included.
| DirectX | DirectX® 12 | |
| Vulkan | 1 |
Peripherals
Specifications and connection types of supported peripherals.
| PCIe version | 3.0 | of 5 (Core i9-12900K) |
Benchmark performance
Single-core and multi-core benchmark results of FX-7500. Overall benchmark performance is measured in points in 0-100 range, higher is better.
Overall score
This is our combined benchmark performance rating. We are regularly improving our combining algorithms, but if you find some perceived inconsistencies, feel free to speak up in comments section, we usually fix problems quickly.
FX-7500
3.18
- Passmark
- GeekBench 5 Single-Core
- GeekBench 5 Multi-Core
- Cinebench 10 32-bit single-core
- Cinebench 10 32-bit multi-core
- 3DMark06 CPU
- Cinebench 11.5 64-bit multi-core
- Cinebench 15 64-bit multi-core
- Cinebench 15 64-bit single-core
- Cinebench 11.5 64-bit single-core
- TrueCrypt AES
- x264 encoding pass 2
- x264 encoding pass 1
- WinRAR 4.0
- Geekbench 3 32-bit multi-core
- Geekbench 3 32-bit single-core
- Geekbench 2
Passmark
Passmark CPU Mark is a widespread benchmark, consisting of 8 different types of workload, including integer and floating point math, extended instructions, compression, encryption and physics calculation. There is also one separate single-threaded scenario measuring single-core performance.
Benchmark coverage: 69%
FX-7500
3209
GeekBench 5 Single-Core
GeekBench 5 Single-Core is a cross-platform application developed in the form of CPU tests that independently recreate certain real-world tasks with which to accurately measure performance. This version uses only a single CPU core.
Benchmark coverage: 38%
FX-7500
349
GeekBench 5 Multi-Core
GeekBench 5 Multi-Core is a cross-platform application developed in the form of CPU tests that independently recreate certain real-world tasks with which to accurately measure performance. This version uses all available CPU cores.
Benchmark coverage: 38%
FX-7500
899
Cinebench 10 32-bit single-core
Cinebench R10 is an ancient ray tracing benchmark for processors by Maxon, authors of Cinema 4D. Its single core version uses just one CPU thread to render a futuristic looking motorcycle.
Benchmark coverage: 20%
FX-7500
2060
Cinebench 10 32-bit multi-core
Cinebench Release 10 Multi Core is a variant of Cinebench R10 using all the processor threads. Possible number of threads is limited by 16 in this version.
Benchmark coverage: 20%
FX-7500
5482
3DMark06 CPU
3DMark06 is a discontinued DirectX 9 benchmark suite from Futuremark. Its CPU part contains two scenarios, one dedicated to artificial intelligence pathfinding, another to game physics using PhysX package.
Benchmark coverage: 19%
FX-7500
2771
Cinebench 11.5 64-bit multi-core
Cinebench Release 11.5 Multi Core is a variant of Cinebench R11.5 which uses all the processor threads. A maximum of 64 threads is supported in this version.
Benchmark coverage: 17%
FX-7500
2
Cinebench 15 64-bit multi-core
Cinebench Release 15 Multi Core (sometimes called Multi-Thread) is a variant of Cinebench R15 which uses all the processor threads.
Benchmark coverage: 14%
FX-7500
153
Cinebench 15 64-bit single-core
Cinebench R15 (standing for Release 15) is a benchmark made by Maxon, authors of Cinema 4D. It was superseded by later versions of Cinebench, which use more modern variants of Cinema 4D engine. The Single Core version (sometimes called Single-Thread) only uses a single processor thread to render a room full of reflective spheres and light sources.
Benchmark coverage: 14%
FX-7500
55
Cinebench 11.5 64-bit single-core
Cinebench R11. 5 is an old benchmark by Maxon, authors of Cinema 4D. It was superseded by later versions of Cinebench, which use more modern variants of Cinema 4D engine. The Single Core version loads a single thread with ray tracing to render a glossy room full of crystal spheres and light sources.
Benchmark coverage: 14%
FX-7500
0.7
TrueCrypt AES
TrueCrypt is a discontinued piece of software that was widely used for on-the-fly-encryption of disk partitions, now superseded by VeraCrypt. It contains several embedded performance tests, one of them being TrueCrypt AES, which measures data encryption speed using AES algorithm. Result is encryption speed in gigabytes per second.
Benchmark coverage: 13%
FX-7500
1
x264 encoding pass 2
x264 Pass 2 is a slower variant of x264 video compression that produces a variable bit rate output file, which results in better quality since the higher bit rate is used when it is needed more. Benchmark result is still measured in frames per second.
Benchmark coverage: 13%
FX-7500
14
x264 encoding pass 1
x264 version 4.0 is a video encoding benchmark uses MPEG 4 x264 compression method to compress a sample HD (720p) video. Pass 1 is a faster variant that produces a constant bit rate output file. Its result is measured in frames per second, which means how many frames of the source video file were encoded per second.
Benchmark coverage: 13%
FX-7500
69
WinRAR 4.0
WinRAR 4.0 is an outdated version of a popular file archiver. It contains an internal speed test, using ‘Best’ setting of RAR compression on large chunks of randomly generated data. Its results are measured in kilobytes per second.
Benchmark coverage: 12%
FX-7500
1479
Geekbench 3 32-bit multi-core
Benchmark coverage: 6%
FX-7500
4116
Geekbench 3 32-bit single-core
Benchmark coverage: 6%
FX-7500
1769
Geekbench 2
Benchmark coverage: 5%
FX-7500
4730
Relative perfomance
Overall FX-7500 performance compared to nearest competitors among notebook CPUs.
Intel Core i7-5557U
100
Intel Core i5-4330M
100
Intel Core i5-6260U
100
AMD FX-7500
100
Intel Core i5-6198DU
99.37
Intel Core i7-4600M
99.06
Intel Pentium Silver N6000
98.43
Intel equivalent
We believe that the nearest equivalent to FX-7500 from Intel is Core i7-5557U, which is nearly equal in speed and lower by 1 position in our rating.
Core i7
5557U
Compare
Here are some closest Intel rivals to FX-7500:
Intel Core i5-4330M
100
Intel Core i5-6260U
100
Intel Core i7-5557U
100
AMD FX-7500
100
Intel Core i5-6198DU
99. 37
37
Intel Core i7-4600M
99.06
Intel Pentium Silver N6000
98.43
Similar processors
Here is our recommendation of several processors that are more or less close in performance to the one reviewed.
Core i5
6260U
Compare
Core i7
5557U
Compare
Core i5
4330M
Compare
Core i5
6198DU
Compare
Pentium Gold
4415U
Compare
Core i7
4600M
Compare
Recommended graphics cards
These graphics cards are most commonly used with FX-7500 according to our statistics.
Radeon R7
Graphics
24.2%
Radeon R7
M260DX
12.9%
Radeon R5
M230
9.2%
Radeon R7
M265
5.7%
Radeon R7
M260
2.8%
GeForce GTX
1050 Ti
1.7%
Radeon R7
240
1.5%
Radeon R7
250
1. 3%
3%
GeForce GTX
650
1.1%
Mobility
Radeon X800
0.9%
User rating
Here is the rating given to the reviewed processor by our users. Let others know your opinion by rating it yourself.
Questions and comments
Here you can ask a question about FX-7500, agree or disagree with our judgements, or report an error or mismatch.
Please enable JavaScript to view the comments powered by Disqus.
AMD FX-7500 — review. CPU Benchmark & Specs
The processor AMD FX-7500 is developed on the 28 nm technology node and architecture Kaveri. Its base clock speed is 2.10 GHz, and maximum clock speed in turbo boost — 3.30 GHz. AMD FX-7500 contains 4 processing cores. To make a right choice for computer upgrading, please get familiar with the detailed technical specifications and benchmark results. Check socket compatibility before choosing.
0.0
Out of 0
Hitesti score
TOP-10 CPU
Most viewed
Intel Celeron N4020
2x 1.10 GHz (2.80 GHz)
AMD Ryzen 5 5500U
6x 2.10 GHz (4.00 GHz) HT
Intel Celeron J4125
4x 2. 00 GHz (2.70 GHz)
AMD Ryzen 3 3250U
2x 2.60 GHz (3.50 GHz) HT
AMD Ryzen 7 5700U
8x 1.80 GHz (4.30 GHz) HT
AMD Athlon Silver 3050U
2x 2.30 GHz (3.20 GHz)
Intel Core i3-1115G4
2x 1. 70 GHz (4.10 GHz) HT
Intel Core i5-1135G7
4x 2.40 GHz (4.00 GHz) HT
Intel Celeron N4500
2x 1.10 GHz (2.90 GHz)
AMD Ryzen 5 4600G
6x 3.70 GHz (4.20 GHz) HT
Buy here:
AliExpress
0. 0
0
Out of 0
Hitesti score
Share on social network:
In order to leave a review you need to login
Reviews of AMD FX-7500
Compare AMD FX-7500
VS
AMD C-50
Intel Core i5-2430M
Intel Core i3-7102E
AMD Ryzen 5 5600U
AMD A10-5750M
Intel Core i3-3217UE
AMD A10-4657M
AMD A10-4600M
AMD A10-4655M
Intel Core i9-10900KF
Processor FX-7500 [in 18 benchmarks]
AMD
FX-7500
- Interface
- Core frequency
- Video memory size
- Memory type
- Memory frequency
- Maximum resolution
Description
AMD started AMD FX-7500 sales 4 June 2014. This is Kaveri architecture notebook processor primarily aimed at office systems. It has 4 cores and 4 threads and is manufactured using 28nm process technology, the maximum frequency is 3300MHz, the multiplier is locked.
In terms of compatibility, this is an FP3 socket processor with a TDP of 19W. It supports DDR3-1600 memory.
It provides poor benchmark performance at
3.18%
from the leader, which is AMD EPYC 7h22.
FX
7500
vs
EPYC
7h22
General information
Information about the type (desktop or laptop) and architecture of the FX-7500, as well as when sales started and cost at that time.
| place in performance rating | 1582 | ||||||||||||||||||||||||||||||||||||||
| Type | 0040 + | ||||||||||||||||||||||||||||||||||||||
| Compatible with Windows 11 Information on FX-7500 compatibility with other computer components.  Useful, for example, when choosing the configuration of a future computer or to upgrade an existing one. Useful, for example, when choosing the configuration of a future computer or to upgrade an existing one.
Please note that the power consumption of some processors can significantly exceed their nominal TDP even without overclocking. Some may even double their claims if the motherboard allows you to adjust the power settings of the processor.
Virtualization technologies 0
|
| AMD-V | 1 | |
| Immu 2.0 | + |
90AM0059
90AM
Interfaces and connections supported by the FX-7500’s integrated graphics card.
| DisplayPort | + | |
| HDMI | + 1
| |
|
Integrated video — API support
APIs supported by the FX-7500’s integrated graphics card, including their versions.
| DirectX | Directx® 12 | VULKAN | 1 |

| CHILDER PCI Express | 3.0 | of 5 (Core i9-12900K) |
Tests in the benchmarks
These are the results of the FX-7500 performance tests in non-gaming benchmarks. The overall score is set from 0 to 100, where 100 corresponds to the fastest processor at the moment.
Overall performance in tests
This is our overall performance rating. We regularly improve our algorithms, but if you find any inconsistencies, feel free to speak up in the comments section, we usually fix problems quickly.
FX-7500
3.18
- Passmark
- GeekBench 5 Single-Core
- GeekBench 5 Multi-Core
- Cinebench 10 32-bit single-core
- Cinebench 10 32-bit multi-core
- 3DMark06 CPU
- Cinebench 11.5 64-bit multi-core
- Cinebench 15 64-bit multi-core
- Cinebench 15 64-bit single-core
- Cinebench 11.
 5 64-bit single-core
 - TrueCrypt AES
- x264 encoding pass 2
- x264 encoding pass 1
- WinRAR 4.0
- Geekbench 3 32-bit multi-core
- Geekbench 3 32-bit single-core
- Geekbench 2
Passmark
Passmark CPU Mark is a widely used benchmark that consists of 8 different tests, including integer and floating point calculations, extended instruction tests, compression, encryption, and game physics calculations. Also includes a separate single-threaded test.
Benchmark coverage: 69%
FX-7500
3209
GeekBench 5 Single-Core
GeekBench 5 Single-Core is a cross-platform application developed in the form of CPU tests that independently recreate certain real-world tasks that can be used to accurately measure performance. This version uses only one processor core.
Benchmark coverage: 38%
FX-7500
349
GeekBench 5 Multi-Core
GeekBench 5 Multi-Core is a cross-platform application designed as CPU benchmarks that independently recreate certain real world tasks that can accurately measure performance. This version uses all available processor cores.
Benchmark coverage: 38%
FX-7500
899
Cinebench 10 32-bit single-core
Cinebench R10 is a very outdated ray tracing benchmark for processors developed by the authors of Cinema 4D, Maxon. The Single-Core version uses a single CPU thread to render a futuristic motorcycle model.
Benchmark coverage: 20%
FX-7500
2060
Cinebench 10 32-bit multi-core
Cinebench Release 10 Multi Core is a variant of Cinebench R10 that uses all processor threads. The possible number of threads in this version is limited to 16.
Benchmark coverage: 20%
FX-7500
5482
3DMark06 CPU
3DMark06 is an outdated set of benchmarks based on DirectX 9 by Futuremark. Its processor part contains two tests, one of which calculates the pathfinding of game AI, the other emulates game physics using the PhysX package.
Benchmark coverage: 19%
FX-7500
2771
Cinebench 11.5 64-bit multi-core
Cinebench Release 11.5 Multi Core is a variant of Cinebench R11.5 that uses all processor threads. This version supports a maximum of 64 threads.
Benchmark coverage: 17%
FX-7500
2
Cinebench 15 64-bit multi-core
Cinebench Release 15 Multi Core (sometimes referred to as Multi-Thread) is a variant of Cinebench R15 that uses all of the processor threads.
Benchmark coverage: 14%
FX-7500
153
Cinebench 15 64-bit single-core
Cinebench R15 (Release 15) is a benchmark created by Maxon, the creator of the popular Cinema 4D 3D modeling package. It was superseded by later versions of Cinebench using more modern variants of the Cinema 4D engine. The Single Core version (sometimes referred to as Single-Thread) uses only one CPU thread to render a room full of mirror balls and complexly shaped lights.
Benchmark coverage: 14%
FX-7500
55
Cinebench 11.5 64-bit single-core
Cinebench R11.5 is an old benchmark developed by Maxon. authors of Cinema 4D. It has been superseded by later versions of Cinebench which use more modern variants of the Cinema 4D engine. The Single Core version loads one CPU thread with ray tracing, rendering a glossy room full of crystal spheres and lights.
Benchmark coverage: 14%
FX-7500
0.7
TrueCrypt AES
TrueCrypt is a deprecated program that was widely used to encrypt disk partitions on the fly. It contains several built-in benchmarks, one of which is TrueCrypt AES. It measures the speed of data encryption using the AES algorithm. The result of the test is the encryption speed in gigabytes per second.
Benchmark coverage: 13%
FX-7500
1
x264 encoding pass 2
x264 Pass 2 is a slower MPEG4 x264 video compression benchmark, resulting in a variable bit rate output file. This results in a better quality of the resulting video file, as a higher bit rate is used when it is needed more. The benchmark result is still measured in frames per second.
Benchmark coverage: 13%
FX-7500
14
x264 encoding pass 1
The x264 benchmark uses the MPEG 4 x264 compression method to encode the HD (720p) sample video. Pass 1 is a faster option that produces an output file at a constant bit rate. Its result is measured in frames per second, that is, how many frames of the source video file were encoded in one second on average.
Benchmark coverage: 13%
FX-7500
69
WinRAR 4.0
WinRAR 4.0 is an outdated version of the popular archiver. It contains an internal speed test using maximum compression by the RAR algorithm on large amounts of randomly generated data. Results are measured in kilobytes per second.
Benchmark coverage: 12%
FX-7500
1479
Geekbench 3 32-bit multi-core
Benchmark coverage: 6%
FX-7500
4116
Geekbench 3 32-bit single-core
Benchmark coverage: 6%
FX-7500
1769
Geekbench 2
Benchmark coverage: 5%
FX-7500
4730
Relative performance
Overall performance of the FX-7500 compared to its closest competitor in notebook processors.
Intel Core i5-6260U
100
Intel Core i5-4330M
100
Intel Core i7-5557U
100
AMD FX-7500
100
Intel Core i5-6198DU
99.37
Intel Core i7-4600M
99.06
Intel Pentium Silver N6000
98.43
Competitor from Intel
We believe that the nearest equivalent to FX-7500 from Intel is Core i7-5557U, which is approximately equal in speed and lower by 1 position in our rating.
Core i7
5557U
Compare
Here are some of Intel’s closest competitors to the FX-7500:
Intel Core i5-4330M
100
Intel Core i5-6260U
100
Intel Core i7-5557U
100
AMD FX-7500
100
Intel Core i5-6198DU
99. 37
37
Intel Core i7-4600M
99.06
Intel Pentium Silver N6000
98.43
Other processors
Here we recommend several processors that are more or less similar in performance to the reviewed one.
Core i5
4330M
Compare
Core i7
5557U
Compare
Core i5
6198DU
Compare
Pentium Gold
4415U
Compare
Core i5
4400E
Compare
Core i5
6300U
Compare
Recommended video cards
According to our statistics, these video cards are most often used with FX-7500:
Radeon R7
Graphics
24. 2%
2%
Radeon R7
M260DX
12.9%
Radeon R5
M230
9.2%
Radeon R7
M265
5.7%
Radeon R7
M260
2.8%
GeForce GTX
1050 Ti
1.7%
Radeon R7
240
1.5%
Radeon R7
250
1.3%
GeForce GTX
650
1.1%
Mobility
Radeon X800
0.9%
User rating
Here you can see the evaluation of the processor by users, as well as put your own rating.