AMD FX-8350 vs Intel Core i7-4770K Benchmarks, Specs, Performance Comparison and Differences
|
|
|
|
|
AMD FX-8350 vs Intel Core i7-4770K
Note: Commissions may be earned from the links above.
This page contains references to products from one or more of our advertisers. We may receive compensation when you click on links to those products. For an explanation of our advertising policy, please visit this page.
Specification comparison:
| Processor | AMD FX-8350 | Intel Core i7-4770K | ||||||
| Market (main) | Desktop | Desktop | ||||||
| ISA | x86-64 (64 bit) | x86-64 (64 bit) | ||||||
| Microarchitecture | Piledriver | Haswell | ||||||
| Core name | Vishera | Haswell-DT | ||||||
| Family | FX-8000 | Core i7-4000 | ||||||
| Part number(s), S-Spec |
FD8350FRW8KHK, |
BX80646I74770K, |
||||||
| Release date | Q4 2012 | Q2 2013 | ||||||
| Lithography | 32 nm SOI | 22 nm | ||||||
| Transistors | 1. 200.000.000 200.000.000 |
1.400.000.000 | ||||||
| Cores | 8 | 4 | ||||||
| Threads | 8 | 8 | ||||||
| Base frequency | 4,0 GHz | 3,5 GHz | ||||||
| Turbo frequency | 4,2 GHz | 3,9 GHz | ||||||
| High performance cores |
8 Cores 8 Threads @ 4,0 / 4,2 GHz |
4 Cores 8 Threads @ 3,5 / 3,9 GHz |
||||||
| Cache memory | 8 MB | 8 MB | ||||||
| Max memory capacity | 32 GB | 32 GB | ||||||
| Memory types |
DDR3-1866 |
DDR3-1333/1600, |
||||||
| Max # of memory channels | 2 | 2 | ||||||
| Max memory bandwidth | 29,9 GB/s | 25,6 GB/s | ||||||
| Max PCIe lanes | 16 | 16 | ||||||
| TDP | 125 W | 84 W | ||||||
| Suggested PSU | 650W ATX Power Supply | 600W ATX Power Supply | ||||||
| GPU integrated graphics | None | Intel HD Graphics 4600 | ||||||
| GPU execution units | — | 20 | ||||||
| GPU shading units | — | 160 | ||||||
| GPU base clock | — | 350 MHz | ||||||
| GPU boost clock | — | 1250 MHz | ||||||
| GPU FP32 floating point | — | 352 GFLOPS | ||||||
| Socket | AM3+ | LGA1150 | ||||||
| Compatible motherboard | Socket AM3+ Motherboard | Socket LGA 1150 Motherboard | ||||||
| Maximum temperature | 61°C | 105°C | ||||||
| Drystone MIPS | 97.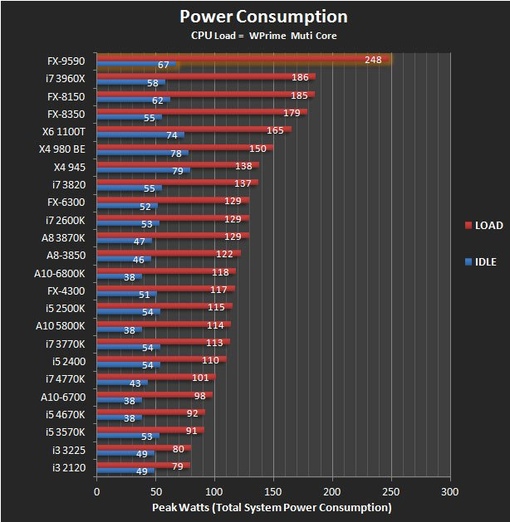 114 DMIPS 114 DMIPS |
127.282 DMIPS | ||||||
| Crypto engine |
Advanced Encryption Standard instructions |
AES New Instructions, |
||||||
| Security |
Enhanced Virus Protection |
OS Guard, |
||||||
| Max display resolution |
— |
4096 x 2304@24Hz (HDMI), |
||||||
| CPU-Z single thread | 231 | 482 | ||||||
| CPU-Z multi thread | 1. 597 597 |
2.483 | ||||||
| Cinebench R15 single thread | 100 | 156 | ||||||
| Cinebench R15 multi-thread | 669 | 791 | ||||||
| Cinebench R23 single thread | 484 | 934 | ||||||
| Cinebench R23 multi-thread | 3.355 | 4.757 | ||||||
| PassMark single thread | 1.573 | 2.144 | ||||||
| PassMark CPU Mark | 5.944 | 7.081 | ||||||
| (Windows) Geekbench 4 single core |
2.738 | 4.589 | ||||||
| (Windows) Geekbench 4 multi-core |
10. 978 978 |
15.120 | ||||||
| (SGEMM) GFLOPS performance |
99,6 GFLOPS | 261,9 GFLOPS | ||||||
| (Multi-core / watt performance) Performance / watt ratio |
88 pts / W | 180 pts / W | ||||||
| Amazon | ||||||||
| eBay |
Note: Commissions may be earned from the links above.
Suggested PSU: We assume that we have An ATX computer case, a high end graphics card, 16GB RAM, a 512GB SSD, a 1TB HDD hard drive, a Blu-Ray drive. We will have to rely on a more powerful power supply if we want to have several graphics cards, several monitors, more memory, etc.
Price: For technical reasons, we cannot currently display a price less than 24 hours, or a real-time price. This is why we prefer for the moment not to show a price. You should refer to the respective online stores for the latest price, as well as availability.
The processor AMD FX-8350 has more cores, the maximum frequency of AMD FX-8350 is greater, that the thermal dissipation power of Intel Core i7-4770K is less. The Intel Core i7-4770K was started more recently.
Performance comparison with the benchmarks:
Performance comparison between the two processors, for this we consider the results generated on benchmark software such as Geekbench.
| CPU-Z — Multi-thread & single thread score | |
|---|---|
| Intel Core i7-4770K |
482 2.483 |
| AMD FX-8350 |
231 1.597 |
In single core, the difference is 109%. In multi-core, the difference in terms of gap is 55%.
Note: Commissions may be earned from the links above. These scores are only an
average of the performances got with these processors, you may get different results.
| Cinebench R15 — Multi-thread & single thread score | |
|---|---|
| Intel Core i7-4770K |
156 791 |
| AMD FX-8350 |
100 669 |
In single core, the difference is 56%. In multi-core, the difference in terms of gap is 18%.
Note: Commissions may be earned from the links above. These scores are only an
average of the performances got with these processors, you may get different results.
| Cinebench R23 — Multi-thread & single thread score | |
|---|---|
| Intel Core i7-4770K |
934 4.757 |
| AMD FX-8350 |
484 3.355 |
In single core, the difference is 93%. In multi-core, the difference in terms of gap is 42%.
Note: Commissions may be earned from the links above. These scores are only an
average of the performances got with these processors, you may get different results.
| PassMark — CPU Mark & single thread | |
|---|---|
| Intel Core i7-4770K |
2.144 7.081 |
| AMD FX-8350 |
1.573 5.944 |
In single core, the difference is 36%. In multi-core, the difference in terms of gap is 19%.
Note: Commissions may be earned from the links above. These scores are only an
average of the performances got with these processors, you may get different results.
On Windows:
| Geekbench 4 — Multi-core & single core score — Windows | |
|---|---|
| Intel Core i7-4770K |
4.589 15.120 |
| AMD FX-8350 |
2.738 10.978 |
In single core, the difference is 68%. In multi-core, the difference in terms of gap is 38%.
On Linux:
| Geekbench 4 — Multi-core & single core score — Linux | |
|---|---|
| Intel Core i7-4770K |
4.  393 39314.891 |
| AMD FX-8350 |
2.755 10.794 |
In single core, the difference is 59%. In multi-core, the difference in terms of gap is 38%.
On Android:
| Geekbench 4 — Multi-core & single core score — Android | |
|---|---|
| Intel Core i7-4770K |
4.985 17.196 |
| AMD FX-8350 |
2.233 5.530 |
In single core, the difference is 123%. In multi-core, the difference in terms of gap is 211%.
On Mac OS X:
| Geekbench 4 — Multi-core & single core score — Mac OS X | |
|---|---|
| Intel Core i7-4770K |
4.738 15.083 |
| AMD FX-8350 |
2.  688 68811.071 |
In single core, the difference is 76%. In multi-core, the difference in terms of gap is 36%.
Note: Commissions may be earned from the links above. These scores are only an
average of the performances got with these processors, you may get different results.
Equivalence:
AMD FX-8350 Intel equivalentIntel Core i7-4770K AMD equivalent
See also:
Intel Core i7-4770Intel Core i7-4770HQIntel Core i7-4770S
Intel Core i7-4770K vs AMD FX-8350
Comparative analysis of Intel Core i7-4770K and AMD FX-8350 processors for all known characteristics in the following categories: Essentials, Performance, Memory, Graphics, Graphics interfaces, Graphics image quality, Graphics API support, Compatibility, Peripherals, Security & Reliability, Advanced Technologies, Virtualization.
Benchmark processor performance analysis: PassMark — Single thread mark, PassMark — CPU mark, Geekbench 4 — Single Core, Geekbench 4 — Multi-Core, 3DMark Fire Strike — Physics Score, CompuBench 1.5 Desktop — Face Detection (mPixels/s), CompuBench 1.5 Desktop — Ocean Surface Simulation (Frames/s), CompuBench 1.5 Desktop — T-Rex (Frames/s), CompuBench 1.5 Desktop — Video Composition (Frames/s), CompuBench 1.5 Desktop — Bitcoin Mining (mHash/s), GFXBench 4.0 — Car Chase Offscreen (Frames), GFXBench 4.0 — Manhattan (Frames), GFXBench 4.0 — T-Rex (Frames), GFXBench 4.0 — Car Chase Offscreen (Fps), GFXBench 4.0 — Manhattan (Fps), GFXBench 4.0 — T-Rex (Fps).
Intel Core i7-4770K
Buy on Amazon
vs
AMD FX-8350
Buy on Amazon
Differences
Reasons to consider the Intel Core i7-4770K
- CPU is newer: launch date 7 month(s) later
- Around 19% higher maximum core temperature: 72.
 72°C vs 61°C
 - A newer manufacturing process allows for a more powerful, yet cooler running processor: 22 nm vs 32 nm SOI
- Around 49% lower typical power consumption: 84 Watt vs 125 Watt
- Around 37% better performance in PassMark — Single thread mark: 2165 vs 1580
- Around 18% better performance in PassMark — CPU mark: 7125 vs 6033
- Around 73% better performance in Geekbench 4 — Single Core: 982 vs 566
- Around 34% better performance in Geekbench 4 — Multi-Core: 3688 vs 2751
- Around 93% better performance in 3DMark Fire Strike — Physics Score: 2575 vs 1337
- 4.1x better performance in CompuBench 1.5 Desktop — Ocean Surface Simulation (Frames/s): 89.554 vs 21.912
- Around 47% better performance in CompuBench 1.5 Desktop — T-Rex (Frames/s): 0.625 vs 0.424
- 2.1x better performance in CompuBench 1.5 Desktop — Video Composition (Frames/s): 2.525 vs 1.199
| Launch date | 1 June 2013 vs 23 October 2012 |
| Maximum core temperature | 72. 72°C vs 61°C 72°C vs 61°C |
| Manufacturing process technology | 22 nm vs 32 nm SOI |
| Thermal Design Power (TDP) | 84 Watt vs 125 Watt |
| PassMark — Single thread mark | 2165 vs 1580 |
| PassMark — CPU mark | 7125 vs 6033 |
| Geekbench 4 — Single Core | 982 vs 566 |
| Geekbench 4 — Multi-Core | 3688 vs 2751 |
| 3DMark Fire Strike — Physics Score | 2575 vs 1337 |
| CompuBench 1.5 Desktop — Ocean Surface Simulation (Frames/s) | 89. 554 vs 21.912 554 vs 21.912 |
| CompuBench 1.5 Desktop — T-Rex (Frames/s) | 0.625 vs 0.424 |
| CompuBench 1.5 Desktop — Video Composition (Frames/s) | 2.525 vs 1.199 |
Reasons to consider the AMD FX-8350
- 4 more cores, run more applications at once: 8 vs 4
- Around 8% higher clock speed: 4.2 GHz vs 3.90 GHz
- Around 50% more L1 cache; more data can be stored in the L1 cache for quick access later
- 8x more L2 cache, more data can be stored in the L2 cache for quick access later
- Around 89% better performance in CompuBench 1.5 Desktop — Face Detection (mPixels/s): 9.886 vs 5.223
- Around 13% better performance in CompuBench 1.5 Desktop — Bitcoin Mining (mHash/s): 7.137 vs 6.308
| Number of cores | 8 vs 4 |
| Maximum frequency | 4. 2 GHz vs 3.90 GHz 2 GHz vs 3.90 GHz |
| L1 cache | 384 KB vs 256 KB |
| L2 cache | 8 MB vs 1 MB |
| CompuBench 1.5 Desktop — Face Detection (mPixels/s) | 9.886 vs 5.223 |
| CompuBench 1.5 Desktop — Bitcoin Mining (mHash/s) | 7.137 vs 6.308 |
Compare benchmarks
CPU 1: Intel Core i7-4770K
CPU 2: AMD FX-8350
| PassMark — Single thread mark |
|
|
||||
| PassMark — CPU mark |
|
|
||||
| Geekbench 4 — Single Core |
|
|
||||
| Geekbench 4 — Multi-Core |
|
|
||||
| 3DMark Fire Strike — Physics Score |
|
|
||||
CompuBench 1. 5 Desktop — Face Detection (mPixels/s) 5 Desktop — Face Detection (mPixels/s) |
|
|
||||
| CompuBench 1.5 Desktop — Ocean Surface Simulation (Frames/s) |
|
|
||||
| CompuBench 1.5 Desktop — T-Rex (Frames/s) |
|
|
||||
CompuBench 1. 5 Desktop — Video Composition (Frames/s) 5 Desktop — Video Composition (Frames/s) |
|
|
||||
| CompuBench 1.5 Desktop — Bitcoin Mining (mHash/s) |
|
|
| Name | Intel Core i7-4770K | AMD FX-8350 |
|---|---|---|
| PassMark — Single thread mark | 2165 | 1580 |
| PassMark — CPU mark | 7125 | 6033 |
| Geekbench 4 — Single Core | 982 | 566 |
| Geekbench 4 — Multi-Core | 3688 | 2751 |
| 3DMark Fire Strike — Physics Score | 2575 | 1337 |
CompuBench 1. 5 Desktop — Face Detection (mPixels/s) 5 Desktop — Face Detection (mPixels/s) |
5.223 | 9.886 |
| CompuBench 1.5 Desktop — Ocean Surface Simulation (Frames/s) | 89.554 | 21.912 |
| CompuBench 1.5 Desktop — T-Rex (Frames/s) | 0.625 | 0.424 |
| CompuBench 1.5 Desktop — Video Composition (Frames/s) | 2.525 | 1.199 |
| CompuBench 1.5 Desktop — Bitcoin Mining (mHash/s) | 6.308 | 7.137 |
| GFXBench 4.0 — Car Chase Offscreen (Frames) | 1347 | |
GFXBench 4. 0 — Manhattan (Frames) 0 — Manhattan (Frames) |
2349 | |
| GFXBench 4.0 — T-Rex (Frames) | 3778 | |
| GFXBench 4.0 — Car Chase Offscreen (Fps) | 1347 | |
| GFXBench 4.0 — Manhattan (Fps) | 2349 | |
| GFXBench 4.0 — T-Rex (Fps) | 3778 |
Compare specifications (specs)
| Intel Core i7-4770K | AMD FX-8350 | |
|---|---|---|
| Architecture codename | Haswell | Vishera |
| Launch date | 1 June 2013 | 23 October 2012 |
| Launch price (MSRP) | $399 | |
| Place in performance rating | 1393 | 2242 |
| Price now | $284. 99 99 |
$79.99 |
| Processor Number | i7-4770K | |
| Series | 4th Generation Intel® Core™ i7 Processors | AMD FX 8-Core Black Edition Processors |
| Status | Discontinued | |
| Value for money (0-100) | 10.43 | 32.95 |
| Vertical segment | Desktop | Desktop |
| Family | AMD FX-Series Processors | |
| OPN PIB | FD8350FRHKBOX | |
| OPN Tray | FD8350FRW8KHK | |
| 64 bit support | ||
| Base frequency | 3. 50 GHz 50 GHz |
4 GHz |
| Bus Speed | 5 GT/s DMI2 | |
| Die size | 177 mm | 315 mm |
| L1 cache | 256 KB | 384 KB |
| L2 cache | 1 MB | 8 MB |
| L3 cache | 8 MB | 8 MB |
| Manufacturing process technology | 22 nm | 32 nm SOI |
| Maximum case temperature (TCase) | 72 °C | |
| Maximum core temperature | 72. 72°C 72°C |
61°C |
| Maximum frequency | 3.90 GHz | 4.2 GHz |
| Number of cores | 4 | 8 |
| Number of threads | 8 | 8 |
| Transistor count | 1400 Million | 1200 Million |
| Unlocked | ||
| P0 Vcore voltage | Min: 1.2 V — Max: 1.4 V | |
| Max memory channels | 2 | |
| Maximum memory bandwidth | 25. 6 GB/s 6 GB/s |
|
| Maximum memory size | 32 GB | |
| Supported memory types | DDR3-1333/1600, DDR3L-1333/1600 @ 1.5V | DDR3 |
| Supported memory frequency | 1866 MHz | |
| Device ID | 0x412 | |
| Graphics base frequency | 350 MHz | |
| Graphics max dynamic frequency | 1.25 GHz | |
| Graphics max frequency | 1. 25 GHz 25 GHz |
|
| Intel® Clear Video HD technology | ||
| Intel® Flexible Display Interface (Intel® FDI) | ||
| Intel® InTru™ 3D technology | ||
| Intel® Quick Sync Video | ||
| Max video memory | 2 GB | |
| Processor graphics | Intel® HD Graphics 4600 | |
| DisplayPort | ||
| DVI | ||
| eDP | ||
| HDMI | ||
| Number of displays supported | 3 | |
| VGA | ||
| Wireless Display (WiDi) support | ||
| Max resolution over DisplayPort | [email protected] | |
| Max resolution over eDP | [email protected] | |
| Max resolution over HDMI 1. |
[email protected] | |
| Max resolution over VGA | [email protected] | |
| DirectX | 11.2/12 | |
| OpenGL | 4.3 | |
| Low Halogen Options Available | ||
| Max number of CPUs in a configuration | 1 | 1 |
| Package Size | 37.5mm x 37.5mm | |
| Sockets supported | FCLGA1150 | AM3+ |
| Thermal Design Power (TDP) | 84 Watt | 125 Watt |
| Thermal Solution | PCG 2013D | |
| Max number of PCIe lanes | 16 | |
| PCI Express revision | Up to 3. 0 0 |
n / a |
| PCIe configurations | Up to 1×16, 2×8, 1×8+2×4 | |
| Scalability | 1S Only | |
| Anti-Theft technology | ||
| Execute Disable Bit (EDB) | ||
| Intel® Identity Protection technology | ||
| Intel® OS Guard | ||
| Intel® Secure Key technology | ||
| Intel® Trusted Execution technology (TXT) | ||
| Enhanced Intel SpeedStep® technology | ||
| Flexible Display interface (FDI) | ||
| Idle States | ||
| Instruction set extensions | Intel® SSE4.
|