Intel Core i5-650 vs AMD A10-7850K
|
|
|
|
|
Intel Core i5-650 vs AMD A10-7850K
Comparison of the technical characteristics between the processors, with the Intel Core i5-650 on one side and the AMD A10-7850K on the other side. The first is dedicated to the desktop sector, It has 2 cores, 4 threads, a maximum frequency of 3,5GHz. The second is used on the desktop segment, it has a total of 4 cores, 4 threads, its turbo frequency is set to 4,0 GHz. The following table also compares the lithography, the number of transistors (if indicated), the amount of cache memory, the maximum RAM memory capacity, the type of memory accepted, the release date, the maximum number of PCIe lanes, the values obtained in Geekbench 4 and Cinebench R15.
Note: Commissions may be earned from the links above.
This page contains references to products from one or more of our advertisers. We may receive compensation when you click on links to those products. For an explanation of our advertising policy, please visit this page.
Specifications:
| Processor | Intel Core i5-650 | AMD A10-7850K | ||||||
| Market (main) | Desktop | Desktop | ||||||
| ISA | x86-64 (64 bit) | x86-64 (64 bit) | ||||||
| Microarchitecture | Westmere | Steamroller | ||||||
| Core name | Clarkdale | Kaveri | ||||||
| Family | Core i5-600 | A10-7000 | ||||||
| Part number(s), S-Spec | BX80616I5650, BXC80616I5650, CM80616003174AH, Q3GN, Q4DC, SLBLK, SLBTJ |
AD785KXBJABOX, AD785KXBI44JA |
||||||
| Release date | Q1 2010 | Q1 2014 | ||||||
| Lithography | 32 nm | 28 nm | ||||||
| Transistors | 382. 000.000 000.000 |
2.410.000.000 | ||||||
| Cores | 2 | 4 | ||||||
| Threads | 4 | 4 | ||||||
| Base frequency | 3,2 GHz | 3,7 GHz | ||||||
| Turbo frequency | 3,5 GHz | 4,0 GHz | ||||||
| Cache memory | 4 MB | 4 MB | ||||||
| Max memory capacity | 16,38 GB | 8 GB | ||||||
| Memory types | DDR3 1066/1333 | DDR3-2133 | ||||||
| Max # of memory channels | 2 | 2 | ||||||
| Max memory bandwidth | 21 GB/s | 34,1 GB/s | ||||||
| Max PCIe lanes | 16 | 16 | ||||||
| TDP | 73 W | 95 W | ||||||
| Suggested PSU | 600W ATX Power Supply | 600W ATX Power Supply | ||||||
| GPU integrated graphics | Intel HD Graphics (Westmere) | AMD Radeon R7 Graphics 512 Cores (Kaveri) | ||||||
| GPU cores | — | 8 | ||||||
| GPU execution units | 12 | — | ||||||
| GPU shading units | 96 | 512 | ||||||
| GPU clock | 733 MHz | 720 MHz | ||||||
| GPU FP32 floating point | 102,3 GFLOPS | 737,3 GFLOPS | ||||||
| Socket | LGA1156 | FM2+ | ||||||
| Compatible motherboard | Socket LGA 1156 Motherboard | Socket FM2+ Motherboard | ||||||
| Maximum temperature | 72. 6°C 6°C |
72.4°C | ||||||
| Crypto engine | AES New Instructions | — | ||||||
| Security | Trusted Execution Technology, Execute Disable Bit |
— | ||||||
| CPU-Z single thread | 255 | 256 | ||||||
| CPU-Z multi thread | 718 | 878 | ||||||
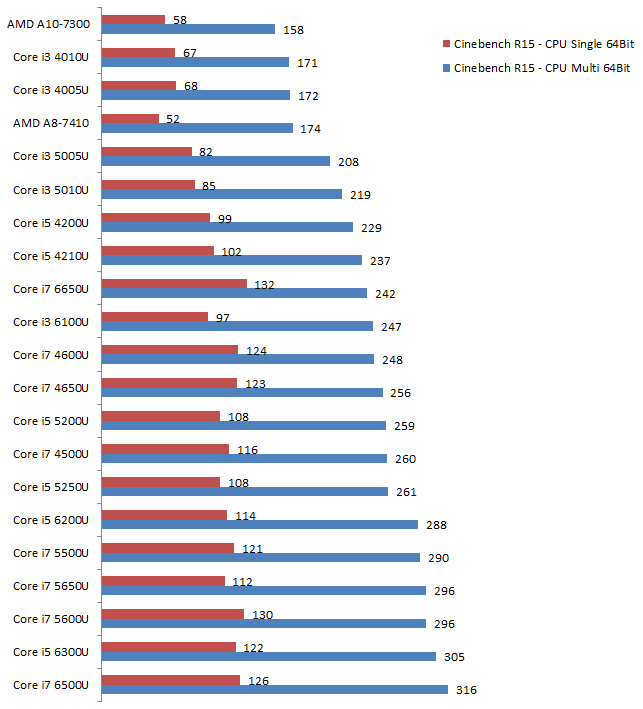
| Cinebench R15 single thread | 102 | 91 | ||||||
| Cinebench R15 multi-thread | 239 | 325 | ||||||
| Cinebench R20 single thread | 231 | 294 | ||||||
| Cinebench R20 multi-thread | 548 | 670 | ||||||
| PassMark single thread | 1. 371 371 |
1.511 | ||||||
| PassMark CPU Mark | 2.174 | 3.424 | ||||||
| (Windows 64-bit) Geekbench 4 single core |
2.433 | 2.495 | ||||||
| (Windows 64-bit) Geekbench 4 multi-core |
4.805 | 6.488 | ||||||
| (Windows) Geekbench 5 single core |
528 | 542 | ||||||
| (Windows) Geekbench 5 multi-core |
1.170 | 1.687 | ||||||
| (SGEMM) GFLOPS performance |
34 GFLOPS | 56,52 GFLOPS | ||||||
| (Multi-core / watt performance) Performance / watt ratio |
66 pts / W | 68 pts / W | ||||||
| Amazon | ||||||||
| eBay |
Note: Commissions may be earned from the links above.
We can better compare what are the technical differences between the two processors.
Suggested PSU: We assume that we have An ATX computer case, a high end graphics card, 16GB RAM, a 512GB SSD, a 1TB HDD hard drive, a Blu-Ray drive. We will have to rely on a more powerful power supply if we want to have several graphics cards, several monitors, more memory, etc.
Price: For technical reasons, we cannot currently display a price less than 24 hours, or a real-time price. This is why we prefer for the moment not to show a price. You should refer to the respective online stores for the latest price, as well as availability.
The processor AMD A10-7850K has a larger number of cores, the turbo frequency of AMD A10-7850K is bigger, that the PDT of Intel Core i5-650 is lower. The AMD A10-7850K was started more recently.
Performances :
Performance comparison between the two processors, for this we consider the results generated on benchmark software such as Geekbench 4.
| CPU-Z — Multi-thread & single thread score | |
|---|---|
| AMD A10-7850K |
256 878 |
| Intel Core i5-650 |
255 718 |
In single core, the difference is 0%. In multi-core, the difference in terms of gap is 22%.
Note: Commissions may be earned from the links above. These scores are only an
average of the performances got with these processors, you may get different results.
CPU-Z is a system information software that provides the name of the processor, its model number, the codename, the cache levels, the package, the process. It can also gives data about the mainboard, the memory. It makes real time measurement, with finally a benchmark for the single thread, as well as for the multi thread.
| Cinebench R15 — Multi-thread & single thread score | |
|---|---|
| AMD A10-7850K |
91 325 |
| Intel Core i5-650 |
102 239 |
In single core, the difference is 12%. In multi-core, the difference in terms of gap is 36%.
Note: Commissions may be earned from the links above. These scores are only an
average of the performances got with these processors, you may get different results.
Cinebench R15 evaluates the performance of CPU calculations by restoring a photorealistic 3D scene. The scene has 2,000 objects, 300,000 polygons, uses sharp and fuzzy reflections, bright areas, shadows, procedural shaders, antialiasing, and so on. The faster the rendering of the scene is created, the more powerful the PC is, with a high number of points.
| Cinebench R20 — Multi-thread & single thread score | |
|---|---|
| AMD A10-7850K |
294 670 |
| Intel Core i5-650 |
231 548 |
In single core, the difference is 27%. In multi-core, the difference in terms of gap is 22%.
Note: Commissions may be earned from the links above. These scores are only an
average of the performances got with these processors, you may get different results.
Cinebench R20 is a multi-platform test software which allows to evaluate the hardware capacities of a device such as a computer, a tablet, a server. This version of Cinebench takes into account recent developments in processors with multiple cores and the latest improvements in rendering techniques. The evaluation is ultimately even more relevant.
| PassMark — CPU Mark & single thread | |
|---|---|
| AMD A10-7850K |
1.511 3.424 |
| Intel Core i5-650 |
1.371 2.174 |
In single core, the difference is 10%.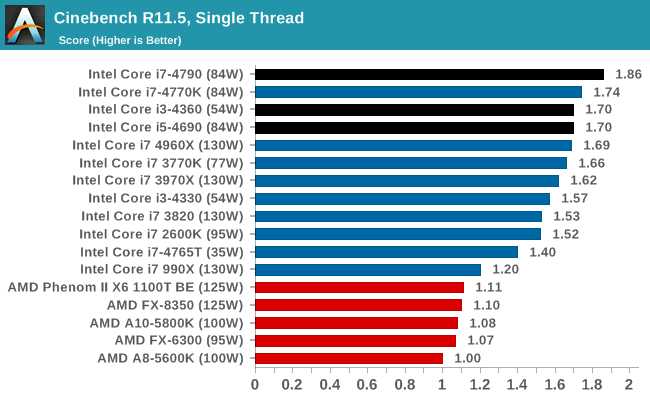 In multi-core, the difference in terms of gap is 57%.
Note: Commissions may be earned from the links above. These scores are only an
average of the performances got with these processors, you may get different results.
PassMark is a benchmarking software that performs several performance tests including prime numbers, integers, floating point, compression, physics, extended instructions, encoding, sorting. The higher the score is, the higher is the device capacity.
On Windows 64-bit:
| Geekbench 4 — Multi-core & single core score — Windows 64-bit | |
|---|---|
| AMD A10-7850K |
2.495 6.488 |
| Intel Core i5-650 |
2.433 4.805 |
In single core, the difference is 3%. In multi-core, the difference in terms of gap is 35%.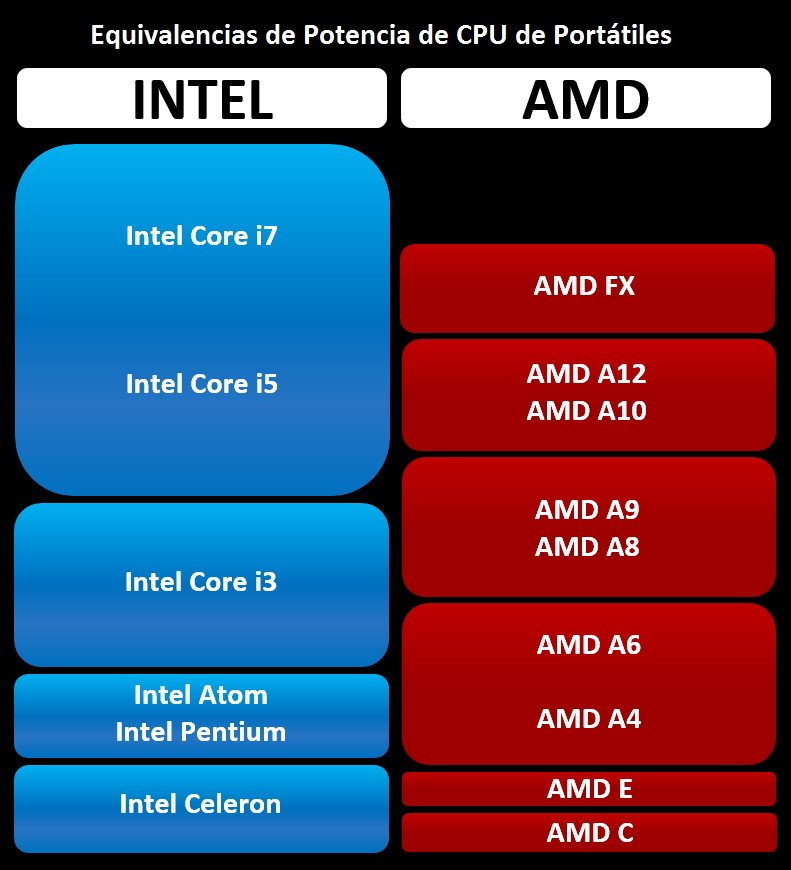
On Linux 64-bit:
| Geekbench 4 — Multi-core & single core score — Linux 64-bit | |
|---|---|
| Intel Core i5-650 |
2.560 4.761 |
| AMD A10-7850K |
2.406 4.738 |
In single core, the difference is 6%. In multi-core, the differential gap is 0%.
On Mac OS X 64-bit:
| Geekbench 4 — Multi-core & single core score — Mac OS X 64-bit | |
|---|---|
| AMD A10-7850K |
2.336 6.075 |
| Intel Core i5-650 |
2.096 4.170 |
In single core, the difference is 11%. In multi-core, the difference in terms of gap is 46%.
Note: Commissions may be earned from the links above. These scores are only an
average of the performances got with these processors, you may get different results.
Geekbench 4 is a complete benchmark platform with several types of tests, including data compression, images, AES encryption, SQL encoding, HTML, PDF file rendering, matrix computation, Fast Fourier Transform, 3D object simulation, photo editing, memory testing. This allows us to better visualize the respective power of these devices. For each result, we took an average of 250 values on the famous benchmark software.
On Windows:
| Geekbench 5 — Multi-core & single core score — Windows | |
|---|---|
| AMD A10-7850K |
542 1.687 |
| Intel Core i5-650 |
528 1.170 |
In single core, the difference is 3%. In multi-core, the difference in terms of gap is 44%.
On Linux:
| Geekbench 5 — Multi-core & single core score — Linux | |
|---|---|
| AMD A10-7850K |
667 1.739 |
| Intel Core i5-650 |
530 1.180 |
In single core, the difference is 26%. In multi-core, the difference in terms of gap is 47%.
On macOS:
| Geekbench 5 — Multi-core & single core score — macOS | |
|---|---|
| AMD A10-7850K |
564 1.472 |
| Intel Core i5-650 |
570 1.214 |
In single core, the difference is 1%. In multi-core, the difference in terms of gap is 21%.
Note: Commissions may be earned from the links above. These scores are only an
average of the performances got with these processors, you may get different results.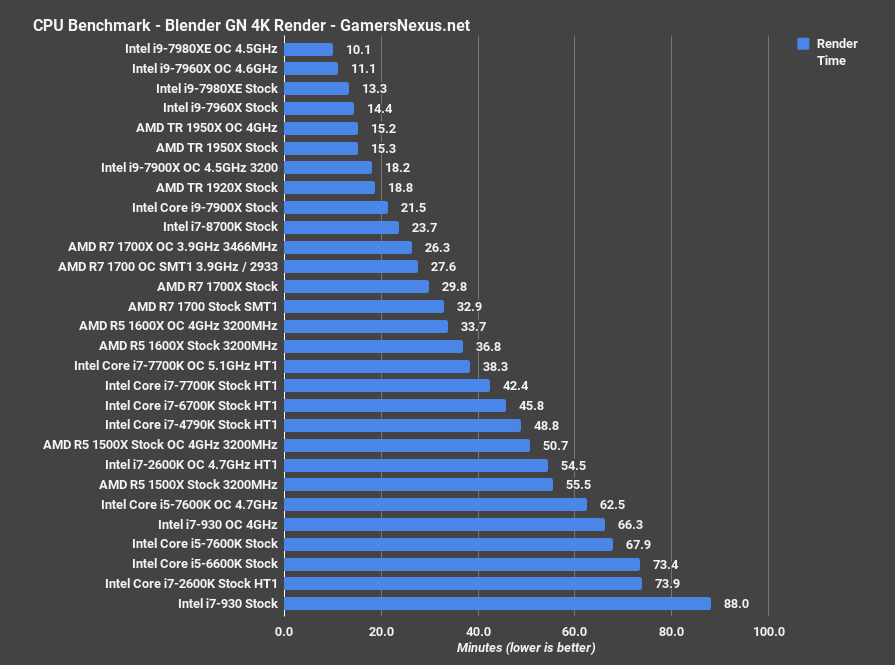
Geekbench 5 is a software for measuring the performance of a computer system, for fixed devices, mobile devices, servers. This platform makes it possible to better compare the power of the CPU, the computing power and to compare it with similar or totally different systems. Geekbench 5 includes new workloads that represent work tasks and applications that we can find in reality.
Equivalence:
Intel Core i5-650 AMD equivalentAMD A10-7850K Intel equivalent
See also:
Intel Core i5-6500Intel Core i5-6500T
Intel Core i5-6500 vs AMD A10-9700
|
|
|
|
|
Intel Core i5-6500 vs AMD A10-9700
Comparison of the technical characteristics between the processors, with the Intel Core i5-6500 on one side and the AMD A10-9700 on the other side. The first is dedicated to the desktop sector, It has 4 cores, 4 threads, a maximum frequency of 3,6GHz. The second is used on the desktop segment, it has a total of 4 cores, 4 threads, its turbo frequency is set to 3,8 GHz. The following table also compares the lithography, the number of transistors (if indicated), the amount of cache memory, the maximum RAM memory capacity, the type of memory accepted, the release date, the maximum number of PCIe lanes, the values obtained in Geekbench 4 and Cinebench R15.
Note: Commissions may be earned from the links above.
This page contains references to products from one or more of our advertisers. We may receive compensation when you click on links to those products. For an explanation of our advertising policy, please visit this page.
Specifications:
| Processor | Intel Core i5-6500 | AMD A10-9700 | ||||||
| Market (main) | Desktop | Desktop | ||||||
| ISA | x86-64 (64 bit) | x86-64 (64 bit) | ||||||
| Microarchitecture | Skylake | Excavator | ||||||
| Core name | Skylake-S | Bristol Ridge | ||||||
| Family | Core i5-6000 | A10-9000 | ||||||
| Part number(s), S-Spec | CM8066201920404, BX80662I56500, BXC80662I56500, SR2L6 |
AD9700AGABBOX, AD9700AGM44AB |
||||||
| Release date | Q3 2015 | Q3 2017 | ||||||
| Lithography | 14 nm | 28 nm | ||||||
| Transistors | — | 3. 100.000.000 100.000.000 |
||||||
| Cores | 4 | 4 | ||||||
| Threads | 4 | 4 | ||||||
| Base frequency | 3,2 GHz | 3,5 GHz | ||||||
| Turbo frequency | 3,6 GHz | 3,8 GHz | ||||||
| Cache memory | 6 MB | 2 MB | ||||||
| Max memory capacity | 64 GB | 32 GB | ||||||
| Memory types | DDR4-1866/2133, DDR3L-1333/1600 |
DDR4-2400 | ||||||
| Max # of memory channels | 2 | 2 | ||||||
| Max memory bandwidth | 34,1 GB/s | 38,4 GB/s | ||||||
| Max PCIe lanes | 16 | 8 | ||||||
| TDP | 65 W | 65 W | ||||||
| Suggested PSU | 600W ATX Power Supply | 600W ATX Power Supply | ||||||
| GPU integrated graphics | Intel HD Graphics 530 | AMD Radeon R7 Graphics 384 Cores (Kaveri) | ||||||
| GPU cores | — | 6 | ||||||
| GPU execution units | 24 | — | ||||||
| GPU shading units | 192 | 384 | ||||||
| GPU base clock | 350 MHz | 351 MHz | ||||||
| GPU boost clock | 1050 MHz | 1029 MHz | ||||||
| GPU FP32 floating point | 403,2 GFLOPS | 553 GFLOPS | ||||||
| Socket | LGA1151 | AM4 | ||||||
| Compatible motherboard | Socket LGA 1151 Motherboard | Socket AM4 Motherboard | ||||||
| Maximum temperature | 71°C | 90°C | ||||||
| Cinebench R15 single thread | 137 | 90 | ||||||
| Cinebench R15 multi-thread | 540 | 301 | ||||||
| PassMark single thread | 2. 114 114 |
1.633 | ||||||
| PassMark CPU Mark | 5.631 | 3.585 | ||||||
| (Windows 64-bit) Geekbench 4 single core |
4.089 | 2.355 | ||||||
| (Windows 64-bit) Geekbench 4 multi-core |
11.376 | 5.789 | ||||||
| (SGEMM) GFLOPS performance |
220,1 GFLOPS | 59,82 GFLOPS | ||||||
| (Multi-core / watt performance) Performance / watt ratio |
175 pts / W | 89 pts / W | ||||||
| Amazon | ||||||||
| eBay |
Note: Commissions may be earned from the links above.
We can better compare what are the technical differences between the two processors.
Suggested PSU: We assume that we have An ATX computer case, a high end graphics card, 16GB RAM, a 512GB SSD, a 1TB HDD hard drive, a Blu-Ray drive. We will have to rely on a more powerful power supply if we want to have several graphics cards, several monitors, more memory, etc.
Price: For technical reasons, we cannot currently display a price less than 24 hours, or a real-time price. This is why we prefer for the moment not to show a price. You should refer to the respective online stores for the latest price, as well as availability.
We see that the two processors have an equivalent number of cores, the turbo frequency of AMD A10-9700 is bigger, that their respective TDP are of the same order. The AMD A10-9700 was started more recently.
Performances :
Performance comparison between the two processors, for this we consider the results generated on benchmark software such as Geekbench 4.
| Cinebench R15 — Multi-thread & single thread score | |
|---|---|
| Intel Core i5-6500 |
137 540 |
| AMD A10-9700 |
90 301 |
In single core, the difference is 52%. In multi-core, the differential gap is 79%.
Note: Commissions may be earned from the links above. These scores are only an
average of the performances got with these processors, you may get different results.
Cinebench R15 evaluates the performance of CPU calculations by restoring a photorealistic 3D scene. The scene has 2,000 objects, 300,000 polygons, uses sharp and fuzzy reflections, bright areas, shadows, procedural shaders, antialiasing, and so on. The faster the rendering of the scene is created, the more powerful the PC is, with a high number of points.
| PassMark — CPU Mark & single thread | |
|---|---|
| Intel Core i5-6500 |
2.114 5.631 |
| AMD A10-9700 |
1.633 3.585 |
In single core, the difference is 29%. In multi-core, the differential gap is 57%.
Note: Commissions may be earned from the links above. These scores are only an
average of the performances got with these processors, you may get different results.
PassMark is a benchmarking software that performs several performance tests including prime numbers, integers, floating point, compression, physics, extended instructions, encoding, sorting. The higher the score is, the higher is the device capacity.
On Windows 64-bit:
| Geekbench 4 — Multi-core & single core score — Windows 64-bit | |
|---|---|
| Intel Core i5-6500 |
4.  089 08911.376 |
| AMD A10-9700 |
2.355 5.789 |
In single core, the difference is 74%. In multi-core, the differential gap is 97%.
On Linux 64-bit:
| Geekbench 4 — Multi-core & single core score — Linux 64-bit | |
|---|---|
| Intel Core i5-6500 |
4.803 13.500 |
| AMD A10-9700 |
2.281 5.039 |
In single core, the difference is 111%. In multi-core, the differential gap is 168%.
On Android 64-bit:
| Geekbench 4 — Multi-core & single core score — Android 64-bit | |
|---|---|
| Intel Core i5-6500 |
3.034 6.144 |
| AMD A10-9700 |
2.  304 3045.880 |
In single core, the difference is 32%. In multi-core, the differential gap is 4%.
Note: Commissions may be earned from the links above. These scores are only an
average of the performances got with these processors, you may get different results.
Geekbench 4 is a complete benchmark platform with several types of tests, including data compression, images, AES encryption, SQL encoding, HTML, PDF file rendering, matrix computation, Fast Fourier Transform, 3D object simulation, photo editing, memory testing. This allows us to better visualize the respective power of these devices. For each result, we took an average of 250 values on the famous benchmark software.
Equivalence:
Intel Core i5-6500 AMD equivalentAMD A10-9700 Intel equivalent
See also:
Intel Core i5-650Intel Core i5-6500T
Intel Core i5-4200M vs.
 AMD A10-5750M
Intel Core i5-4200M
The Intel Core i5-4200M operates with 2 cores and 4 CPU threads. It run at 3.10 GHz base 3.10 GHz all cores while the TDP is set at 37 W.The processor is attached to the PGA 946 CPU socket. This version includes 3.00 MB of L3 cache on one chip, supports 2 memory channels to support DDR3L-1333 SO-DIMM, DDR3L-1600 SO-DIMM RAM and features 3.0 PCIe Gen 16 lanes. Tjunction keeps below 100 °C degrees C. In particular, Haswell H Architecture is enhanced with 22 nm technology and supports VT-x, VT-x EPT, VT-d. The product was launched on Q4/2013
AMD A10-5750M
The AMD A10-5750M operates with 4 cores and 4 CPU threads. It run at 3.50 GHz base 3.50 GHz all cores while the TDP is set at 35 W.The processor is attached to the FS1r2 CPU socket. This version includes 4.00 MB of L3 cache on one chip, supports 2 memory channels to support DDR3-1866 RAM and features PCIe Gen lanes. Tjunction keeps below — degrees C. In particular, Richland (Piledriver) Architecture is enhanced with 32 nm technology and supports AMD-V. The product was launched on Q2/2013
Intel Core i5-4200M
AMD A10-5750M
Compare Detail
| 2.50 GHz | Frequency | 2.50 GHz |
| 2 | Cores | 4 |
| 3.10 GHz | Turbo (1 Core) | 3.50 GHz |
| 3.10 GHz | Turbo (All Cores) | 3.50 GHz |
| Yes | Hyperthreading | No |
| No | Overclocking | No |
| normal | Core Architecture | normal |
|
Intel HD Graphics 4600 |
GPU |
AMD Radeon HD 8650G |
| 1.15 GHz | GPU (Turbo) | 0.72 GHz |
| 22 nm | Technology | 32 nm |
| 1.15 GHz | GPU (Turbo) | 0.72 GHz |
| 11.1 | DirectX Version | 11 |
| 3 | Max. displays | 2 |
| DDR3L-1333 SO-DIMM DDR3L-1600 SO-DIMM |
Memory | DDR3-1866 |
| 2 | Memory channels | 2 |
| Max memory | ||
| No | ECC | No |
| — | L2 Cache | — |
3. 00 MB 00 MB |
L3 Cache | 4.00 MB |
| 3.0 | PCIe version | |
| 16 | PCIe lanes | |
| 22 nm | Technology | 32 nm |
| PGA 946 | Socket | FS1r2 |
| 37 W | TDP | 35 W |
| VT-x, VT-x EPT, VT-d | Virtualization | AMD-V |
| Q4/2013 | Release date | Q2/2013 |
|
Show more data |
Show more data |
Cinebench R15 (Single-Core)
Cinebench R15 is the successor of Cinebench 11.5 and is also based on the Cinema 4 Suite. Cinema 4 is a worldwide used software to create 3D forms. The single-core test only uses one CPU core, the amount of cores or hyperthreading ability doesn’t count.
Cinebench R15 (Multi-Core)
Cinebench R15 is the successor of Cinebench 11.5 and is also based on the Cinema 4 Suite. Cinema 4 is a worldwide used software to create 3D forms. The multi-core test involves all CPU cores and taks a big advantage of hyperthreading.
Geekbench 5, 64bit (Single-Core)
Geekbench 5 is a cross plattform benchmark that heavily uses the systems memory. A fast memory will push the result a lot. The single-core test only uses one CPU core, the amount of cores or hyperthreading ability doesn’t count.
Geekbench 5, 64bit (Multi-Core)
Geekbench 5 is a cross plattform benchmark that heavily uses the systems memory. A fast memory will push the result a lot. The multi-core test involves all CPU cores and taks a big advantage of hyperthreading.
iGPU — FP32 Performance (Single-precision GFLOPS)
The theoretical computing performance of the internal graphics unit of the processor with simple accuracy (32 bit) in GFLOPS. GFLOPS indicates how many billion floating point operations the iGPU can perform per second.
Geekbench 3, 64bit (Single-Core)
Geekbench 3 is a cross plattform benchmark that heavily uses the systems memory. A fast memory will push the result a lot. The single-core test only uses one CPU core, the amount of cores or hyperthreading ability doesn’t count.
Geekbench 3, 64bit (Multi-Core)
Geekbench 3 is a cross plattform benchmark that heavily uses the systems memory. A fast memory will push the result a lot. The multi-core test involves all CPU cores and taks a big advantage of hyperthreading.
Cinebench R11.5, 64bit (Single-Core)
Cinebench 11.5 is based on the Cinema 4D Suite, a software that is popular to generate forms and other stuff in 3D. The single-core test only uses one CPU core, the amount of cores or hyperthreading ability doesn’t count.
Cinebench R11.5, 64bit (Multi-Core)
Cinebench 11.5 is based on the Cinema 4D Suite, a software that is popular to generate forms and other stuff in 3D. The multi-core test involves all CPU cores and taks a big advantage of hyperthreading.
Cinebench R11.5, 64bit (iGPU, OpenGL)
Cinebench 11.5 is based on the Cinema 4D Suite, a software that is popular to generate forms and other stuff in 3D. The iGPU test uses the CPU internal graphic unit to execute OpenGL commands.
Estimated results for PassMark CPU Mark
Some of the CPUs listed below have been benchmarked by CPU-Comparison. However the majority of CPUs have not been tested and the results have been estimated by a CPU-Comparison’s secret proprietary formula. As such they do not accurately reflect the actual Passmark CPU mark values and are not endorsed by PassMark Software Pty Ltd.
Electric Usage Estimate
Average hours of use per day
Average CPU Utilization (0-100%)
Power cost, dollar per kWh
Electric Usage Estimate
Average hours of use per day
Average CPU Utilization (0-100%)
Power cost, dollar per kWh
| Intel Core i5-4200M | AMD A10-5750M | |
| 37 W | Max TDP | 35 W |
| NA | Power consumption per day (kWh) | NA |
| NA | Running cost per day | NA |
| NA | Power consumption per year (kWh) | NA |
| NA | Running cost per year | NA |
Popular Comparision
Comments
Comparison Intel Core i5-5250U vs AMD A10-9620P which is better?
Home / Intel Core i5-5250U VS A10-9620p
Intel Core i5250u 9000u
45%
Devicelist
VS
AMD A10-9620p
We compared the specifications of Intel Core i5-5250U and AMD A10-9620P and compiled a list of advantages and a comparison table for you. Find out which one to choose in 2022.
Benefits Intel Core i5-5250U
Comparison winner
|
Process |
|
14 nm -14 nm (-50%) better than vs 28 nm |
|
Cinebench 10 32-bit single-core |
|
4104 1827 (80.2%) better than vs 2277 |
|
Cinebench 10 32-bit multi-core |
|
8721 1301 (17.5%) better than vs 7420 |
|
Cinebench 11.5 64-bit single-core |
|
107 35 (48.6%) better than vs 72 |
|
Cinebench 15 64-bit multi-core |
|
260 30 (13%) better than vs 230 |
|
WinRAR 4. |
|
2423 1094 (82.3%) better than vs 1329 |
|
x264 encoding pass 1 |
|
88 11 (14.3%) better than vs 77 |
 0
0 Advantage AMD A10-9620P
|
Core |
|
4 2 (100%) better than vs 2 |
|
Maximum frequency |
|
3.4 GHz 0.7 GHz (25.9%) better than vs 2.7 GHz |
|
Number of transistors |
|
3100 million 1200 million (63.2%) better than vs 1900 million |
|
Maximum core temperature |
|
90°C -15°C (-14. vs 105 °C |
| Passmark |
|
2670 169 (6.8%) better than vs 2501 |
 3%) better than
 | General information | |
|
Type |
|
| For laptops | For laptops |
|
Architecture code name |
|
| Broadwell-U | Bristol Ridge |
|
Cores A large number of cores improves performance in multi-threaded applications. |
|
| 2 | 4
2 (100%) better than |
|
Threads More threads help the cores process information more efficiently. Real performance will be noticeable in very specific tasks (video editing, databases). |
|
| 4 | 4 |
|
Base frequency |
|
| 1.6 GHz | n/a |
|
Process |
|
| 14 nm
-14 nm (-50%) better than |
28 nm |
|
Chip size |
|
| 133 mm2 | 250 mm2 |
|
Number of transistors |
|
| 1900 million | 3100 million
1200 million (63.2%) better than |
|
Maximum frequency Faster clocked processors perform more calculations per second and thus provide better performance. |
|
| 2.7GHz | 3.4 GHz
Better at 0.7 GHz (25.9%) than |
|
Support 64 bit |
|
|
Max. number of processors in the configuration |
|
| 1 | n/a |
|
Socket |
|
| FCBGA1168 | FP4 |
|
AMD-V |
|
|
Series |
|
| Intel Core i5 | Bristol Ridge |
|
Release price |
|
| 315 $ | n/a |
|
Value for money The sum of all the advantages of the device divided by its price. |
|
| 74.1% | n/a |
|
Maximum core temperature |
|
| 105 °C | 90°C
-15 °C (-14.3%) better than |
|
vPro |
|
|
TXT Intel Trusted Execution Technology for hardware-based malware protection. For each protected program, the processor allocates its own isolated section of RAM. |
|
|
PCI Express revision |
|
| 2.0 | n/a |
|
Number of PCI-Express lanes |
|
| 12 | n/a |
|
Secure Key |
|
|
Identity Protection |
|
| + | n/a |
|
OS Guard |
|
| + | n/a |
|
Flex Memory Access |
|
| + | n/a |
|
Quick Sync |
|
| + | n/a |
|
eDP |
|
| + | n/a |
|
HDMI |
|
| + | n/a |
|
FDI |
|
| + | n/a |
|
Fast Memory Access |
|
| + | n/a |
|
Level 1 Cache The fastest level of cache that works directly with the core. |
|
| 64K (per core) | n/a |
|
L2 cache |
|
| 256K (per core) | 2 Mb |
|
L3 cache |
|
| 3 MB (total) | n/a |
|
Maximum case temperature (TCase) |
|
| 105 °C | n/a |
|
Power Demand (TDP) Calculated thermal power shows the average heat dissipation in load operation, |
|
| 15W | 15W |
|
EDB |
|
| + | n/a |
|
Video memory size |
|
| 16 GB | n/a |
|
Clear Video |
|
| + | n/a |
|
InTru 3D |
|
| + | n/a |
|
DisplayPort |
|
| + | n/a |
|
Smart Response |
|
| + | n/a |
 The more%, the better the quality per unit price in comparison with all analogues.
  The larger the cache, the better the performance.
 | Benchmarks | |
|
Passmark |
|
| 2501 | 2670
169 (6. |
|
Cinebench 10 32-bit single-core |
|
| 4104
1827 (80.2%) better than |
2277 |
|
Cinebench 10 32-bit multi-core |
|
| 8721
1301 (17.5%) better than |
7420 |
|
Cinebench 11.5 64-bit single-core |
|
| 107
35 (48.6%) better than |
72 |
|
Cinebench 15 64-bit multi-core |
|
| 260
30 (13%) better than |
230 |
|
WinRAR 4.0 |
|
| 2423
1094 (82.3%) better than |
1329 |
|
x264 encoding pass 1 |
|
| 88
11 (14.3%) better than |
77 |
|
x264 encoding pass 2 |
|
| 16 | 16 |
|
TrueCrypt AES |
|
| 2 | n/a |
|
3DMark06 CPU |
|
| 3393 | n/a |
|
Geekbench 2 |
|
| 6769 | n/a |
|
Geekbench 3 32-bit single-core |
|
| 2638 | n/a |
|
Geekbench 3 32-bit multi-core |
|
| 5216 | n/a |
 8%) better than
 | Technologies and Advanced Instructions | |
|
Advanced Instructions |
|
Intel® SSE4. 1, Intel® SSE4.2, Intel® 0 0X02 1, Intel® SSE4.2, Intel® 0 0X02
| no data |
|
Turbo Boost |
|
| 2.0 | n/a |
|
Idle States |
|
|
Enhanced SpeedStep (EIST) Technology from Intel that allows you to reduce the frequency of the processor to a minimum value to save power when the processor is idle. |
|
|
Thermal Monitoring |
|
|
Hyper-Threading Intel hardware technology that allows multiple threads to be processed on each processor core. For server applications, the performance improvement is up to 30%. |
|
|
AES-NI Technology from Intel that speeds up the AES encryption process. |
|
| + | n/a |
|
AVX The presence of AVX instructions improves performance in floating point and processor-intensive operations |
|
| RAM parameters | |
|
Types of RAM |
|
| DDR3L-1333, DDR3L-1600, LPDR3-1600, LPDDR3-1866 | n/a |
|
Allowable memory The maximum amount of RAM that can be used with this processor. |
|
| 16 GB | n/a |
|
Number of memory channels |
|
| 2 | n/a |
| Virtualization technologies | ||
|
EPT |
||
|
VT-d Intel virtualization technology allows you to forward devices on the PCI bus to the guest operating system so that it can work with them using its standard tools. |
||
| Integrated graphics | |
|
Max GPU clock |
|
| 950 MHz | n/a |
|
Maximum number of monitors |
|
| 3 | n/a |
|
Clear Video HD |
|
|
Video core The presence of the video core allows you to use your computer without using a video card. |
|
| + | AMD Radeon R5 (Bristol Ridge) (- 758 MHz) |
|
Maximum resolution via HDMI 1.4 |
|
| 2560X1600@60Hz | n/a |
|
Maximum resolution via DisplayPort |
|
| 3840×2160@60Hz | n/a |
|
DirectX |
|
| 11.2/12 | n/a |
|
OpenGL |
|
| 4.3 | n/a |
AMD A10-5750M vs Intel Core i5-4300U — comparative characteristics and benchmarks of processors
VS
AMD A10-5750M
Intel Core i5-4300U
Which to choose?
It’s time to choose the winner. What is the difference and which is better in AMD A10-5750M vs Intel Core i5-4300U comparison? Which processor is more powerful and faster? It is quite simple to determine — look at the comparative table of all characteristics. A processor with more cores/threads, as well as a higher frequency and large L2-L3 is the absolute winner!
Cores, base and turbo frequency of the processor
Who will win in the comparison of AMD A10-5750M and Intel Core i5-4300U. The overall performance of a processor can be easily determined based on the number of cores, threads, base and turbo clock speed + L2-L3 volume. The more cores, L3, and clock speed, the more efficient the processor. Please note that high specifications require the use of a powerful cooling system.
2.50 GHZ
Cabbit Frequency
1.90 GHZ
4,0003
Nuclei
2
3.50 GHZ
turbo
2.90 GHZ
4
The number of flows
9000 4000 4000
TURBO (2 Cores)
2.90 GHZ
No
Hypertureuding
YES
NO
Acceleration
NO
3.50 GHZ
Turbo (4 Cores)
No Data
Processor family and generation
Internal graphics
It’s hard to compare AMD A10-5750M vs. Intel Core i5-4300U when graphics card function and specs matter only in laptops. In workstations, this is not an advantage, due to the installation of an additional graphics accelerator.
AMD Radeon HD 8650G
GPU name
Intel HD Graphics 4400
0.53 GHz
GPU frequency
0.20 GHZ
0.72 GHZ
GPU (TURBO)
1.10 GHZ
5
Generation
7.5
11
version DirectX
.1 9000
6
9000 9000 9000 9000 9000 9000 9000 9000 9000 9000 9000 9000 9000 9000 9000
Number of Shaders
160
2 GB
Maximum Memory
2 GB
2
Number of Monitors
3
3
0003
Technology
22 nm
Q2/2013
Release date
Q2/2013
Hardware codec support
Here we are dealing with specifications that are used by some processor manufacturers. These figures are mostly technical and can be disregarded for comparative purposes.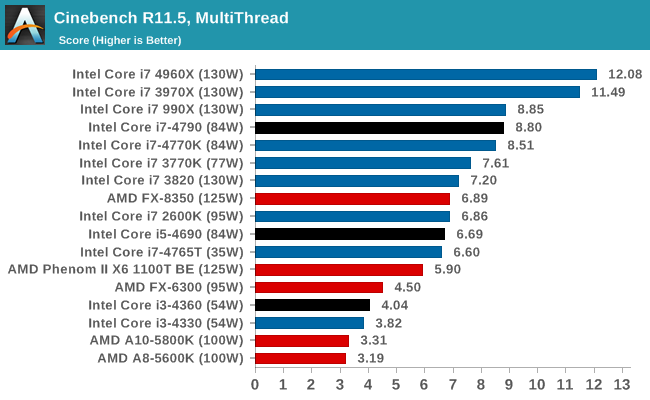
Decode
h364
Decode / Encode
Decode / Encode
JPEG
Decode
NO
H365 8BIT
NO
NO
H365 10BIT
No
NO
VP8
NO
VP9
NO
Decode 9000 VC-1
Decode 9000 000 000 ducode 9000 000 000 ducode
Decode
AVC
Decode / Encode
RAM and PCIe
These are the memory standards supported by processors. The processor can support multi-channel RAM with a high clock speed, this directly affects its speed and performance.
DDR3-1866
Memorial type
DDR3L-1600 SO-Dimm
2
Memory channels
2
NO
ECC
NO
2.0
PCIE 9000 PCIE Linius 9000 PCIE 2 12
Encryption
Support for data encryption
Yes
AES-NI
Yes PCIe
Thermal management and TDP
Today’s systems are loaded with demanding games and workloads that unleash the full potential of the processor. When choosing between AMD A10-5750M and Intel Core i5-4300U, it is better to choose the option with less heat dissipation (TDP).
35 W
TDP
15 W
—
Maximum temperature
—
—
Maximum TDP
—
TDP Download
—
9000
Technical details
4.00 MB
L3-CACHE
3.00 MB
32 32 NM
Technology
22 NM
Richland
Architecture
Haswell
AMD-V
9000 9000 9000
002 Virtualization
VT-X, VT-X EPT, VT-D
FS1R2
SOCK (connector)
BGA 1168
q2/2013
Exit date
Q3/2013
Price
CA. 245 $
Devices compatible with this processor
You probably already know which devices use processors. It can be a desktop computer or a laptop.
Unknown
Used in
Unknown
Cinebench R11.5, 64bit (Single-Core)
This synthetic benchmark will help you determine the actual processing power of a single CPU core. Cinebench R11.5 is based on MAXON CINEMA 4D and uses various test scenarios
AMD A10-5750M
4x 2.50 GHz (3.50 GHz)
88 (77%)
Intel Core i5-4300U
2x 1.90 GHz (2.90 GHz) HT
114 (100%)
Cinebench R11.5, 64bit (Multi-Core)
Cinebench R11.5 performs simultaneous cross-platform tests on all processor cores. Running realistic 3D scenes, this benchmark will unleash the full potential of your single-core Intel or AMD 9 processor0003
AMD A10-5750M
4x 2.50 GHz (3.50 GHz)
219 (83%)
Intel Core i5-4300U
2x 1. 90 GHz (2.90 GHz) HT
262 (100%)
Cinebench R11.5, 64bit (iGPU, OpenGL)
Cinebench 11.5 is based on Cinema 4D Suite, a popular software for creating shapes and other things in 3D. The iGPU test uses the processor’s internal graphics unit to execute OpenGL commands.
AMD A10-5750M
4x 2.50 GHz (3.50 GHz)
Intel Core i5-4300U
2x 1.90 GHz (2.90 GHz) HT
153 (100%)
Cinebench R15 (Single Core)
The latter is used to create 3D models and shapes. Cinebench R15 is used to benchmark the performance of single core processors. Hyperthreading capability is not taken into account. It is an updated version of Cinebench 11.5. Like all new versions, the updated benchmark is based on Cinema 4 Suite software
AMD A10-5750M
4x 2.50 GHz (3.50 GHz)
73 (64%)
Intel Core i5-4300U
2x 1.90 GHz (2.90 GHz) HT
114 (100%)
Cinebench R15 (Multi-Core)
Cinebench R15 can be used to test the performance of multi-core processors. The test produces accurate and reliable results. This benchmark is an updated version of Cinebench 11.5, which is based on Cinema 4 Suite soft.
AMD A10-5750M
4x 2. 50 GHz (3.50 GHz)
210 (80%)
Intel Core i5-4300U
2x 1.90 GHz (2.90 GHz) HT
260 (100%)
Cinebench R20 (Single Core)
Cinebench R20 is based on Cinema 4 Suite. This is software used to create 3D shapes. The benchmark runs in single-core mode without considering the possibility of hyper-threading.
AMD A10-5750M
4x 2.50 GHz (3.50 GHz)
Intel Core i5-4300U
2x 1.90 GHz (2.90 GHz) HT
184 (100%)
Cinebench R20 (Multi-Core)
This is a new version of the benchmark based on Cinebench R15 (both versions are based on Cinema 4, the most popular 3D modeling software). Cinebench R20 is used for benchmark tests of multi-core processor performance and hyper-threading capabilities.
AMD A10-5750M
4x 2.50 GHz (3.50 GHz)
Intel Core i5-4300U
2x 1.90 GHz (2.90 GHz) HT
499 (100%)
Geekbench 3, 64bit (Single-Core)
Geekbench 3 is a benchmark for 64-bit Intel and AMD processors. It uses a new power rating system for a single processor core. This software simulates real scenarios for accurate results
AMD A10-5750M
4x 2.50 GHz (3.50 GHz)
1732 (62%)
Intel Core i5-4300U
2x 1. 90 GHz (2.90 GHz) HT
2760 (100%)
Geekbench 3, 64bit (Multi-Core)
Geekbench 3 supports multi-core AMD and Intel processors. Being based on MAXON CINEMA 4D, it allows you to get the real comparative potential of the processor
AMD A10-5750M
4x 2.50 GHz (3.50 GHz)
4525 (83%)
Intel Core i5-4300U
2x 1.90 GHz (2.90 GHz) HT
5415 (100%)
Geekbench 5, 64bit (Single-Core)
Geekbench 5 is the latest software. Completely new algorithms provide fairly accurate test results for single-core processors.
AMD A10-5750M
4x 2.50 GHz (3.50 GHz)
407 (67%)
Intel Core i5-4300U
2x 1.90 GHz (2.90 GHz) HT
607 (100%)
Geekbench 5, 64bit (Multi-Core)
Geekbench 5 software package shows benchmark results for memory performance and multi-core processor speed. This takes into account the ability to hyperthreading.
AMD A10-5750M
4x 2.50 GHz (3.50 GHz)
1081 (86%)
Intel Core i5-4300U
2x 1.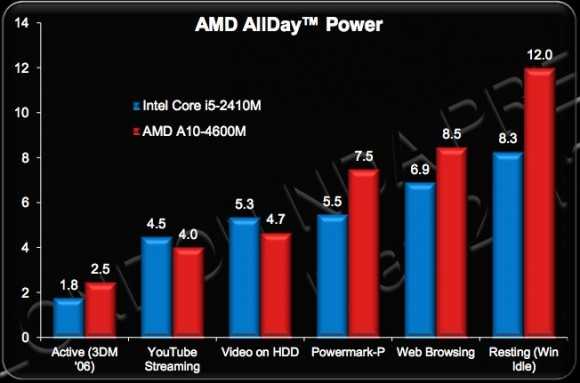 90 GHz (2.90 GHz) HT
1253 (100%)
Estimated results for PassMark CPU Mark
It tests all and general CPU performance (math calculations, compression and decompression speed, 2D&3D graphics tests). Please note that data may differ from actual situations.
AMD A10-5750M
4x 2.50 GHz (3.50 GHz)
3278 (85%)
Intel Core i5-4300U
2x 1.90 GHz (2.90 GHz) HT
3850 (100%)
iGPU — FP32 Performance (Single-precision GFLOPS)
This test measures the performance of integrated graphics on Intel and AMD processors. The result is the calculated processing power in Single-Precision mode FP32
AMD A10-5750M
4x 2.50 GHz (3.50 GHz)
553 (100%)
Intel Core i5-4300U
2x 1.90 GHz (2.90 GHz) HT
352 (63%)
Popular processor comparisons
| one. |
AMD A10-5750M vs. Intel Core i5-5200U |
||||||||||||||||||||||||||||||||||||||||||||||||||||||||||||||||||||||||||||||||||||||||||||||||||||||||||||||||||||||
2.
|
AMD A10-5750M vs. Intel Core i5-4300M |
||||||||||||||||||||||||||||||||||||||||||||||||||||||||||||||||||||||||||||||||||||||||||||||||||||||||||||||||||||||
| 3. |
AMD A10-5750M vs. Intel Celeron J4115 |
||||||||||||||||||||||||||||||||||||||||||||||||||||||||||||||||||||||||||||||||||||||||||||||||||||||||||||||||||||||
| four. |
AMD A10-5750M vs. Intel Core i5-8250U |
||||||||||||||||||||||||||||||||||||||||||||||||||||||||||||||||||||||||||||||||||||||||||||||||||||||||||||||||||||||
| 5. |
AMD A10-5750M vs. Intel Core i5-5250U |
||||||||||||||||||||||||||||||||||||||||||||||||||||||||||||||||||||||||||||||||||||||||||||||||||||||||||||||||||||||
| 6. |
AMD A10-5750M vs. AMD A8-7650K |
||||||||||||||||||||||||||||||||||||||||||||||||||||||||||||||||||||||||||||||||||||||||||||||||||||||||||||||||||||||
7.
|
AMD A10-5750M vs. Intel Core i5-9400F |
||||||||||||||||||||||||||||||||||||||||||||||||||||||||||||||||||||||||||||||||||||||||||||||||||||||||||||||||||||||
| eight. |
AMD A10-5750M vs. Intel Core i3-2100T |
||||||||||||||||||||||||||||||||||||||||||||||||||||||||||||||||||||||||||||||||||||||||||||||||||||||||||||||||||||||
| 9. |
AMD A10-5750M vs. Intel Core i5-2320 |
||||||||||||||||||||||||||||||||||||||||||||||||||||||||||||||||||||||||||||||||||||||||||||||||||||||||||||||||||||||
| ten. |
AMD A10-5750M vs. Intel Core i3-3240 |
||||||||||||||||||||||||||||||||||||||||||||||||||||||||||||||||||||||||||||||||||||||||||||||||||||||||||||||||||||||
| eleven. |
AMD A10-5750M vs. Intel Core i5-4310M |
||||||||||||||||||||||||||||||||||||||||||||||||||||||||||||||||||||||||||||||||||||||||||||||||||||||||||||||||||||||
12.
|
AMD A10-5750M vs. AMD FX-8320E |
||||||||||||||||||||||||||||||||||||||||||||||||||||||||||||||||||||||||||||||||||||||||||||||||||||||||||||||||||||||
| 13. |
AMD A10-5750M vs. Intel Core i3-8145U |
||||||||||||||||||||||||||||||||||||||||||||||||||||||||||||||||||||||||||||||||||||||||||||||||||||||||||||||||||||||
| fourteen. |
AMD A10-5750M vs. Intel Core i3-4010U |
||||||||||||||||||||||||||||||||||||||||||||||||||||||||||||||||||||||||||||||||||||||||||||||||||||||||||||||||||||||
| fifteen. |
AMD A10-5750M vs. Intel Celeron 1017U |
 Thus, you see the average values corresponding to the processor.
Simple household tasks |
|
Core i5 M 460 37.3 (+4.6%) A10-4600M APU 35.6 |
Demanding games and tasks |
|
Core i5 M 460 12.9 A10-4600M APU 13 (+0.8%) |
Extreme |
|
Core i5 M 460 2.5 A10-4600M APU 2.5 |
Different tasks require different CPU strengths. A system with few fast cores and low memory latency will be fine for the vast majority of games, but will be inferior to a system with a lot of slow cores in a rendering scenario.
We believe that a minimum of 4/4 (4 physical cores and 4 threads) processor is suitable for a budget gaming PC. At the same time, some games can load it at 100%, slow down and freeze, and performing any tasks in the background will lead to a drop in FPS.
Ideally, the budget shopper should aim for a minimum of 4/8 and 6/6. A gamer with a big budget can choose between 6/12, 8/8 and 8/16. Processors with 10 and 12 cores can perform well in games with high frequency and fast memory, but are overkill for such tasks. Also, buying for the future is a dubious undertaking, since in a few years many slow cores may not provide sufficient gaming performance.
When choosing a processor for your work, consider how many cores your programs use. For example, photo and video editors can use 1-2 cores when working with filtering, and rendering or converting in the same editors already uses all threads.
Data obtained from tests by users who tested their systems both with overclocking (maximum value in the table) and without (minimum). A typical result is shown in the middle, the more filled in the color bar, the better the average result among all tested systems.
Characteristics
The data is not yet complete, so the tables may be missing information or existing functions may be omitted.
Basic
| Manufacturer | Intel | |
| DescriptionInformation about the processor, taken from the official website of the manufacturer. | Intel® Core™ i5-460M Processor (3M Cache, 2.53 GHz) | |
| ArchitectureCode name for the microarchitecture generation. | Arrandale | |
Process The manufacturing process, measured in nanometers. The smaller the technical process, the more perfect the technology, the lower the heat dissipation and power consumption. |
32 | No data |
| Release dateMonth and year of the processor’s availability. | 10-2016 | 10-2016 |
| Model Official name. | i5-460M | |
| Cores The number of physical cores. | 2 | 4 |
| ThreadsNumber of threads. The number of logical processor cores that the operating system sees. | 4 | 4 |
Multi-Threading Technology With Intel’s Hyper-threading and AMD’s SMT technology, one physical core is recognized by the operating system as two logical cores, thereby increasing processor performance in multi-threaded applications. |
Hyper-threading (note that some games may not work well with Hyper-threading, you can disable the technology in the BIOS of the motherboard for maximum FPS). | Missing |
| Base frequencyGuaranteed frequency of all processor cores at maximum load. Performance in single-threaded and multi-threaded applications and games depends on it. It is important to remember that speed and frequency are not directly related. For example, a new processor at a lower frequency may be faster than an old one at a higher one. | 2.53 GHz | 2.3 GHz |
Turbo frequency The maximum frequency of one processor core in turbo mode. Manufacturers allow modern processors to independently increase the frequency of one or more cores under heavy load, due to which performance is noticeably increased. It may depend on the nature of the load, the number of loaded cores, temperature and the specified limits. Significantly affects the speed in games and applications that are demanding on the frequency of the CPU. Significantly affects the speed in games and applications that are demanding on the frequency of the CPU. |
2.8 GHz | 2.7 GHz |
| L3 cache size The third level cache acts as a buffer between the computer’s RAM and the processor’s level 2 cache. Used by all cores, the speed of information processing depends on the volume. | 3 | No data |
| Instructions | 64-bit | |
| Extended instruction set Allow to speed up calculations, processing and execution of certain operations. Also, some games require instruction support. | SSE4.1/4.2 | |
Embedded Options Available Two enclosure versions. Standard and designed for mobile devices. In the second version, the processor can be soldered on the motherboard. In the second version, the processor can be soldered on the motherboard. |
No | No |
| Bus frequency The speed of communication with the system. | 2.5 GT/s DMI | |
| Number of QPI links | ||
| TDPThermal Design Power is an indicator that determines the heat dissipation in standard operation. The cooler or water cooling system must be rated for a larger value. Remember that with a factory bus or manual overclocking, TDP increases significantly. | 35 | No data |
| Cooling system specifications |
Video core
Integrated graphics core Allows you to use your computer without a discrete graphics card. The monitor is connected to the video output on the motherboard. If earlier integrated graphics made it possible to simply work at a computer, today it can replace budget video accelerators and makes it possible to play most games at low settings. The monitor is connected to the video output on the motherboard. If earlier integrated graphics made it possible to simply work at a computer, today it can replace budget video accelerators and makes it possible to play most games at low settings. |
Intel® HD Graphics | |
| GPU base clockFrequency of 2D and idle operation. | 500 | No data |
| Maximum GPU frequencyMaximum 3D frequency. | 766 | No data |
| Intel® Wireless Display (Intel® WiDi) Supports Wireless Display technology using the Wi-Fi 802.11n standard. Thanks to it, a monitor or TV equipped with the same technology does not require a cable to connect. | ||
Supported monitorsThe maximum number of monitors that can be connected to the integrated video core at the same time.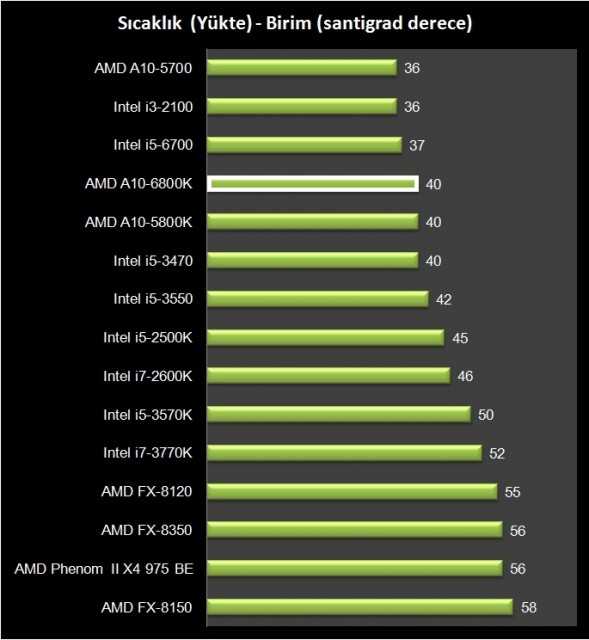 |
2 |
RAM
| Maximum amount of RAMThe amount of RAM that can be installed on the motherboard with this processor. | 8 | No data |
| Supported type of RAM The type of RAM depends on its frequency and timings (speed), availability, price. | DDR3 800/1066 | |
| RAM Channels The multi-channel memory architecture increases data transfer speed. On desktop platforms, two-channel, three-channel and four-channel modes are available. | 2 | |
| RAM bandwidth | 17.1 GB/s | |
ECC memory Support for error-correcting memory that is used in servers. Usually more expensive than usual and requires more expensive server components. However, second-hand server processors, Chinese motherboards and ECC memory sticks, which are sold relatively cheaply in China, have become widespread. Usually more expensive than usual and requires more expensive server components. However, second-hand server processors, Chinese motherboards and ECC memory sticks, which are sold relatively cheaply in China, have become widespread. |
No data | No data |
PCI
| PCI-E Computer bus version of PCI Express. The bandwidth and power limit depend on the version. There is backward compatibility. | 2 | No data |
| PCI | 1×16 | 1×16 |
| Number of PCI lanes | 16 | 1×16 |
Data protection
AES-NI The AES command set extension speeds up applications that use appropriate encryption.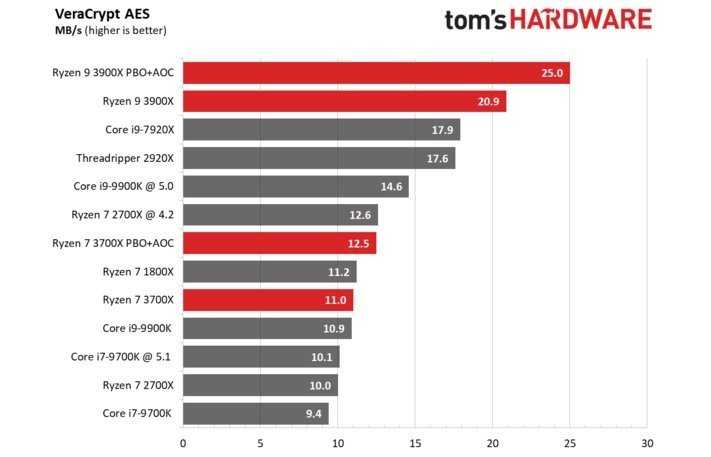 |
No data | No data |
| Intel® Secure Key An RDRAND instruction that allows you to create a high performance random number generator. | No data | No data |
Decoration
| Dimensions | No data | No data |
| Supported sockets | No data | No data |
| Maximum processors per motherboard | No data | No data |
Which is better
Intel Core i5 M 460
- The base frequency is higher by 0.23 GHz.
AMD A10-4600M APU
- On average, gaming performance is 5% better.
