Benchmark guide | Aida64
Benchmark guide
Benchmark pages of AIDA64 Extreme Edition provide several methods to measure system performance. These benchmarks are synthetic, ie. the results show only the theoretical (maximum) performance of the system. In contrast to application tests, synthetic benchmarks do not tend to reflect the “real world” performance of the computer. These benchmarks provide quick and easy comparison between computer states, e.g. when certain parameters (CPU clock speed, memory timings, etc) change in system configuration.
CPU and FPU benchmarks of AIDA64 Extreme Edition are built on the multi-threaded AIDA64 benchmark engine that supports up to 32 simultaneous processing threads. The attained results are scalable either in multi-processor (SMP), multi-core (CMP) and HyperThreading enabled systems. In other words, AIDA64 can utilize the full potential of the current and also the next generation of CPU technologies, such as the hexa-core AMD Phenom II X6, AMD Opteron and Intel Core i7, Intel Xeon processors.
Intel HyperThreading support
Intel’s HyperThreading feature shows moderated performance improvement in AIDA64 benchmarks, because in HyperThreading enabled processors most internal resources (buffers, registers, caches) are shared between the two logical processor units. More specifically the Nortwood, Gallatin and Prestonia core based Intel NetBurst architecture processors do not contain sufficient internal resources for the extremely optimized benchmark routines AIDA64 uses, so on these processors the default HyperThreading setting is disabled, in order to avoid “bottleneck” situations and attain better benchmark results. The Prescott, Nocona, Irwindale, and Potomac based Intel processors have way more internal resources than their predecessors, so on these cores HyperThreading is enabled by default.
Enhanced Halt State and Enhanced SpeedStep support
In order to provide appropriate benchmark results, AIDA64 disables the Enhanced Halt State (C1E) and Enhanced SpeedStep (EIST) feature of capable AMD and Intel desktop processors during all benchmark measurement processes.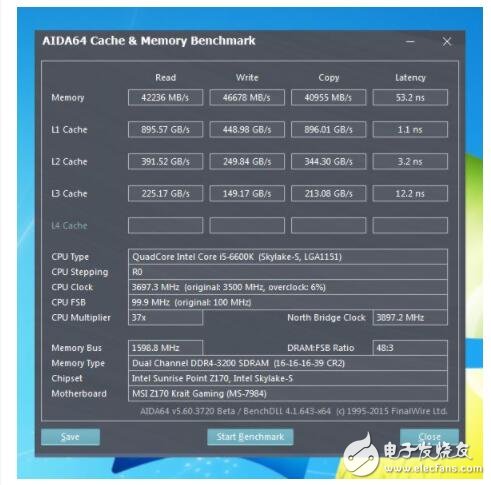 Such features are available in most modern Intel and AMD processors. They are implemented to lower power consumption and heat production by lowering CPU clock frequency and CPU core voltage when the CPU is idle.
System requirements
AIDA64 Extreme Edition benchmarks have considerably higher system requirements than the main AIDA64 application does. To get meaningful and comparable benchmark scores, at least an Intel Pentium class processor (implementing the Time Stamp Counter feature) and 128 MB system memory is required.
64-bit Windows systems are fully supported by AIDA64. All AIDA64 benchmark tests implement both 32-bit and 64-bit variations, and so they are fully capable of utilizing the 64-bit processing capabilities of modern AMD, Intel and VIA processors.
Before starting the benchmarks
In order to attain the highest possible benchmark scores make sure to close all background applications, including ICQ, Windows Live Messenger, Skype, Winamp, web browsers, email clients, hardware monitoring tools, etc. The least number of applications running in the background, the higher benchmark scores can be reached. For comparative benchmarks (ie. when comparing systems based on benchmark scores), make sure to perform benchmarking in a clean Windows installation.
Starting the benchmarks
Benchmarks are not started automatically, because it’s possible to configure them before starting the actual performance measurement process. On CPU and FPU benchmark pages a new button appears on the tool bar named Parameters.
By clicking on the Parameters button, a dropdown menu appears to configure the number of processors to be utilizied by the benchmark method.
And it’s also possible to configure whether the benchmark should use Intel HyperThreading technology. For more details please refer to the Intel HyperThreading support topic above on this page.
Comparing results
FinalWire constantly improve the benchmarks of AIDA64, hence comparing benchmark results of different AIDA64 versions is absolutely not recommended. For example, attaining a result of 200 scores in AIDA64 Version 2.50 cannot be directly compared to a result of 200 scores measured using AIDA64 Version 2.00.
Understanding the results
Except for the Memory Latency test, the higher score means the better performance.
Measurement unit of the results is MB (megabytes) per sec for Memory Read, Memory Write, Memory Copy, and CPU Hash tests; ns (nanosecond) for Memory Latency test; and KB (kilobytes) per sec for CPU ZLib test.
AIDAWeb-benchmarks | Aida/Web Framework
Benchmarking on Aida 5.6 with Swazoo 2.2beta1
This is an update of previous benchmark on Swazoo 1. See below for details of actual benchmark.
Throughput which Aida can sustain is now up to 30 generated and 170 cached requests/s for a 4KB dynamically generated test page.
| Smalltalk | generated req/s |
cached req/s
|
VisualWorks 7. 6 6 |
30 | 170 |
| Squeak 3.9 | 20 | |
| Gemstone64 2.2.5 (Hyper!), commits | 12 | |
| Gemstone64 2.2.5 (Hyper!), no commits | 18 |
- generated
- httperf —server localhost —port 8888 —uri «/admin.html?view=login&id=123456» —rate 30 —num-conn 400
- Connection time ms: min 15.9 avg 30.2 max 86.7 median 26.5 stddev 12.4
- Request rate: 30.0 req/s (33.3 ms/req)
- Reply rate replies/s: min 29.8 avg 29.8 max 29.8 stddev 0.0
- Net I/O: 125.7 KB/s
- cached
- httperf —server localhost —port 8888 —uri «/admin.html?view=login&id=123456» —rate 170 —num-conn 1700
- Connection time ms: min 0.
 3 avg 29.0 max 466.3 median 3.5 stddev 72.2
 - Request rate: 170.0 req/s (5.9 ms/req)
- Reply rate replies/s: min 169.7 avg 169.9 max 170.0 stddev 0.2
- Net I/O: 702.9 KB/s
Benchmarking on Aida 5.2 with Swazoo 1.0
Conclusions
I measured memory consumption and throughput on an Aida/Web dynamically generated login web page (http://demo.aidaweb.si/admin.html?view=login), which has 4KB of HTML.
Tool named httperf was used for generating web requests. First I generated 10.000 requests, which generated 10.000 new sessions and then measured memory consumption:
- 220MB, that is 23KB per session
After optimizing memory consumption (gradually deleting more and more session state, which is normally done every night) I achieved:
- 17KB per session, when last requests were removed from every session
- 400B per session when all WebApplication instances were removed.

Above page create 3 WebAplication instances, which hold session state for representing domain objects and each such instance consumes 1KB and above. WebAdminApp which generates that web page consumes 14KB, but with some simple optimization it can be decreased to 1KB too.
Throughput which Aida can sustain is up to 30 requests/s for above test page.
Benchmarking was done on P4 3.20GHz with 2GB memory running SuSE Linux 10.0 64bit, on VisualWorks 7.4.1.
Procedure
- load AIDAWeb parcel into virgin VW7.4.1 image (from Application Server in Parcel mgr)
- SwazooServer demoStart, test http://localhost:8888 in browser
- page to benchmark: login page http://localhost:8888/admin.html?view=login
- FireBug 2.0 Net statistics:
- 18 requests, 108KB total, 700ms (on same machine!)
- admin.html?view=login 4KB 33ms
- CSS 2 requests 21KB
- JavaScript 1 request 76KB
- Images 14 requests 5KB
- admin.html?view=login 4KB 33ms
- cached: 5 requests 103KB, 500ms
- checking — 1 request only
- Connection time ms: 45.
 0
0 - Request size B: 81.0
- Reply size B: header 268.0 content 3724.0 (total 3992.0)
- Connection time ms: 45.
- memory consumption
- optimizing memory consumption
- removing lastRequest in sessions
- WebSession allInstances do: [:each | each initRequests; nilLastRequest]]
- collect garbage, after: 196.64 Mbytes total; 180.75 Mbytes (-61M) used, 15.89 Mbytes free.
- memory per session: 17KB ! (180.750KB-16.420KB)/9763)
- removing WebApplication instances
- apps per session: 3 (WebAdminApp, WebDemoApp, WebDiscussionsApp)
- WebSession allInstances do: [:each | each initAppsForObjects; nilLastApp]
- collect garbage, after: 186.64 Mbytes total; 159.92 Mbytes (-22M) used, 26.71 Mbytes free.

- memory per session: 15KB ! (159.920KB-16.420KB)/9763)
- memory per app instance: 1KB ! (180.750KB-159.920KB)/(9763×2) only WebDemoApp and WebDiscussionsApp
- WebSession allInstances do: [:each | each nilLastApp] (this will finally remove WebAdminApp)
- collect garbage, after: 36.6 Mbytes total; 20.22 Mbytes (-140M !!!) used, 16.37 Mbytes free.
- memory per session: 400B ! (20.220KB-16.420KB)/9763)
- memory per admin app: 14KB !!! (159.920KB-20.220KB)/9763
- full web page object tree stays in memory?
- removing lastRequest in sessions
- throughput
Aida64 stress test — what is it and how to do it
It is important for every user to learn about the stability of their personal computer. This need is especially acute at the first problems in the operation of the machine. However, it is undoubtedly better to find out if there are any significant problems in the equipment before the first problems. For this, there is the Aida64 application, in particular its function of stress testing a computer and its individual components — a processor (CPU), a video card, a motherboard, and so on. How to do it using this program?
Table of contents:
- Stress tests in Aida 64
- Stress test function
- Run stress test
As already described above, we will talk about checking the stability of the PC by stress testing.
The procedure itself is not as complicated as it looks. In fact, in most cases, overclockers who overclock equipment undergo this kind of PC testing. A novice user simply does not know about it or does not see the need to test his equipment. Before you start using the tests in the Aida64 program, you need to study the manual.
Stress test function
How to enable this procedure? The Aida program will help us, in which we need to follow the following sequence of actions:
- Run Aida64 and select the item Service — System stability test.
- Let’s see the temperature charts of PC components. Removing and setting marks in front of each element, respectively, does the same with the temperature graph of the desired equipment. Here, there is a switch between tabs with other information about the operation of the component. In the most important one, we will see all the temperature regimes online.
- In the lower graph we will see the CPU load and Cpu Throttling. The latter is a technology that, when overheated, activates skipping cycles, reducing performance. This saves from an emergency shutdown of the PC. However, if the user sees that this mode has started, this means that the temperature is critical, and, therefore, you need to turn off the computer until the cause is clarified.
At the top, the types of tests are indicated depending on the device that is subjected to it — Stress CPU, Stress FPU, and so on, what it is and how to run it in Aida64, you can figure it out yourself in the support on the official website, but we will try to analyze it completely here. The word stress implies an additional load during work on this element, including the occurrence of critical situations that lead to an accident.
Starting a stress test
To enable the procedure, you need to:
- Check the required items and press the Start button
- Choose the test time yourself — the optimal interval is 30 minutes.
- If CPU Throttling appears during testing, or any component overheats, stop testing ahead of time and start solving the problem in the computer hardware in order to avoid critical situations during further load.
The Aida64 application is a useful tool for dealing with the problem of overheating and component failure. The stability of the computer provides its working life.
4.1 8 votes
Article rating
| Recommended! InstallPack | Standard Installer |
|
|---|---|---|
| Aida Official Distribution 64 | ||
 This is necessary in order to find out if the processor is operating in the optimal mode at the moment and what load it can withstand. A novice user does not see the need for testing a computer. However, those who overclock their processor often use stress tests to determine the maximum possible load on the chip. From this article you will learn how to stress test your PC.
 In this case, the user receives a red message like “Warning! CPU failure detected! Test stopped». The test immediately indicates where the overheating occurred. This will allow the user to quickly determine which part of the motherboard is lagging behind. Further actions already depend on the user himself — a professional will be able to fix the problem on his own. Someone will have to carry the system unit to a service center to re-diagnose the motherboard. At the same time, service centers also use Aida64 as a test tool.