Ryzen 9 3900X vs. Core i9-9900K: 36 Game Benchmark
A battle that needs no further introduction, we’re pitting the new Ryzen 9 3900X head to head against the Core i9-9900K in 36 games. There’s loads of results to go over and this article is solely focused on PC gaming performance. For more context on the capabilities of the latest Ryzen series, check out our day-one reviews of the 3900X, 3700X and the mainstream Ryzen 5 3600. We’ve also ran an IPC clock-for-clock test comparing against Intel CPUs and a cooling comparison, using the stock Wraith Prism cooler vs. a liquid cooler on the Ryzen 9.
Before we jump to the benchmarks, a few obligatory test notes: the 3900X has been tested on the Gigabyte X570 Aorus Xtreme using the latest BIOS revision and there are two test configurations. The first which we’re calling «stock» is the 3900X with the Wraith Spire RGB box cooler and nothing more than the XMP profile loaded in the BIOS using DDR4-3200 CL14 memory. Then we have an overclocked configuration using DDR4-3600 CL16 memory, the Corsair Hydro h215i all-in-one liquid cooler with PBO+AutoOC enabled.
There’s also stock and overclocked configurations for the Core i9-9900K, though they are both technically overclocked as we aren’t power limiting the Intel CPU. This is better explained as out of the box and then manual overclocked. The stock or out of the box configuration uses DDR4-3200 CL14 memory with the Corsair h215i on the Gigabyte Z390 Ultra. Then for the overclocked configuration the memory has been upgraded to DDR4-3600 CL16 with an all-core clock of 5 GHz.
All testing took place at 1080p using an MSI RTX 2080 Ti graphics card to remove GPU bottlenecks. We’ll look at the margins for all 36 games towards the end of the review, but first we’ll go over and briefly discuss the findings for about a dozen of the titles tested.
Benchmarks
We tested the latest version of World War Z which brings about a number of fixes and performance improvements. Both stock and overclocked the 9900K was ~2% faster than the 3900X which is a negligible difference. Needless to say, the gaming experience was indistinguishable between the two CPUs and both allowed the RTX 2080 Ti to render over 160 fps at all times.
Next up we have Forza Horizon 4. Here the 3900X trailed by a 4% margin when comparing out of the box performance. That margin was halved with both CPUs overclocked and at this point we think it’s fair to say the 9900K is maximizing the RTX 2080 Ti’s performance. This is largely a GPU-bound game, but it’s still worth testing given its quality and popularity. It’s a gorgeous and fun game, no doubt.
StarCraft II was heavily requested for this comparison and we have to admit this is the first time we’ve benchmarked a worst case scenario in this title. Previous benchmarks have been based on 2v2 gameplay, but it seems where Ryzen really struggles is with the bigger 4v4 matches when all teams are maxed out. So what we have here is a worst-case scenario and unfortunately for AMD, the Core i9 is up to 19% faster out of the box when comparing the average frame rate.
With both CPUs overclocked the 9900K was 12% faster, which is still a reasonable performance advantage. 1% low performance was closer but the gap was still there between the two.
Another title where Ryzen seems to struggle is Shadow of the Tomb Raider and do note we’re not using the built-in benchmark which we believe would help out Ryzen’s case. This is in-game performance and here the 9900K was 17% faster which is a large margin.
Where the 3900X did surprise was in Monster Hunter World. Both processors delivered similar average frame rates, yet the 1% low figure was 13% higher with the Ryzen processor. Once overclocked the 3900X was the clear winner offering not just greater 1% low performance but a slight improvement in average frame rate performance as well.
The Core i9-9900K got back to its winning ways in Apex Legends, though here the 3900X was only ~7% slower, dropping 10 fps on average when comparing stock performance. The margin did grow slightly once both CPUs were overclocked, now the 3900X is seen to be 10% slower.
The second battle royale title we tested is Fortnite and while the 3900X was plenty fast, it still lagged behind. Although we see a minor 5% deficit for the average frame rate, the Ryzen processor was up to 13% slower when looking at the 1% low performance. If you don’t need over 160 fps then the 3900X will do just fine, but if you seek maximum performance you’ll want the 9900K.
The Resident Evil 2 results are interesting: stock the 3900X was 6% slower on average, but provided stronger 1% low performance, beating the 9900K by 4%. Then when overclocked the average frame rates were much the same while the Ryzen processor still provided better minimum frame rate performance. Overall the experience was much the same using either CPU.
Next up we have Assassin’s Creed Odyssey and this is another title where Intel is a little faster on average but you’ll never notice the ~4% reduction in average frame rates when using the 3900X. That’s particularly true given the strong 1% low performance of the Ryzen processor.
At launch we saw AMD claiming – using their own benchmarks – that the 3900X was faster than the 9900K in Counter-Strike: Global Offensive and we have to admit we didn’t believe them. But lo and behold the 3900X was a smidgen faster, performance was basically the same overall, but we didn’t expect the 3900X to push average frame rates higher than the 9900K.
Despite offering silky smooth frame rates in Battlefield V, the 3900X was still quite a bit down on the 9900K, trailing by an 8% margin for the average frame rate and 11% for the 1% low. We saw similar margins for the stock and overclocked results.
Moving on to F1 2019, the 3900X was 7% slower out of the box, but once overclocked that margin was reduced to 3% as both processors enabled a similar level of performance. This is one of those instances where if you don’t need to keep frame rates well above 144 fps, it really doesn’t matter which CPU you use.
Far Cry New Dawn isn’t a great title for AMD CPUs, though it’s not that bad either. Here the 3900X was 9% slower out of the box and 10% once both CPUs were overclocked. Performance was perfectly acceptable but for maximum performance the 9900K does deliver the best results.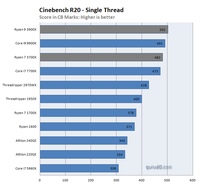
The third and final battle royale game we tested is PlayerUnknown’s Battlegrounds. We’re not using the replay feature to measure performance, rather we’re dropping into the same map at the same spot and measuring performance that way. The 9900K was faster overall but the 3900X was only 4% slower on average, so not a bad result for AMD.
In World of Tanks we see the 3900X performing 8% slower when looking at the average frame rate. Both CPUs pushed frame rates up over 200fps nonetheless.
Putting It All Together
Overall the Core i9-9900K is the faster gaming CPU as we had come to expect, though the margins are close in many titles. Ryzen does offer other advantages, but before we discuss that let’s look at the performance breakdown across all 36 games tested.
On average the 3900X was 6% slower than the 9900K when gaming. Results where the margin was less than 5%, you can deem those a draw considering the margin of error and that 1% lows are within the same distance.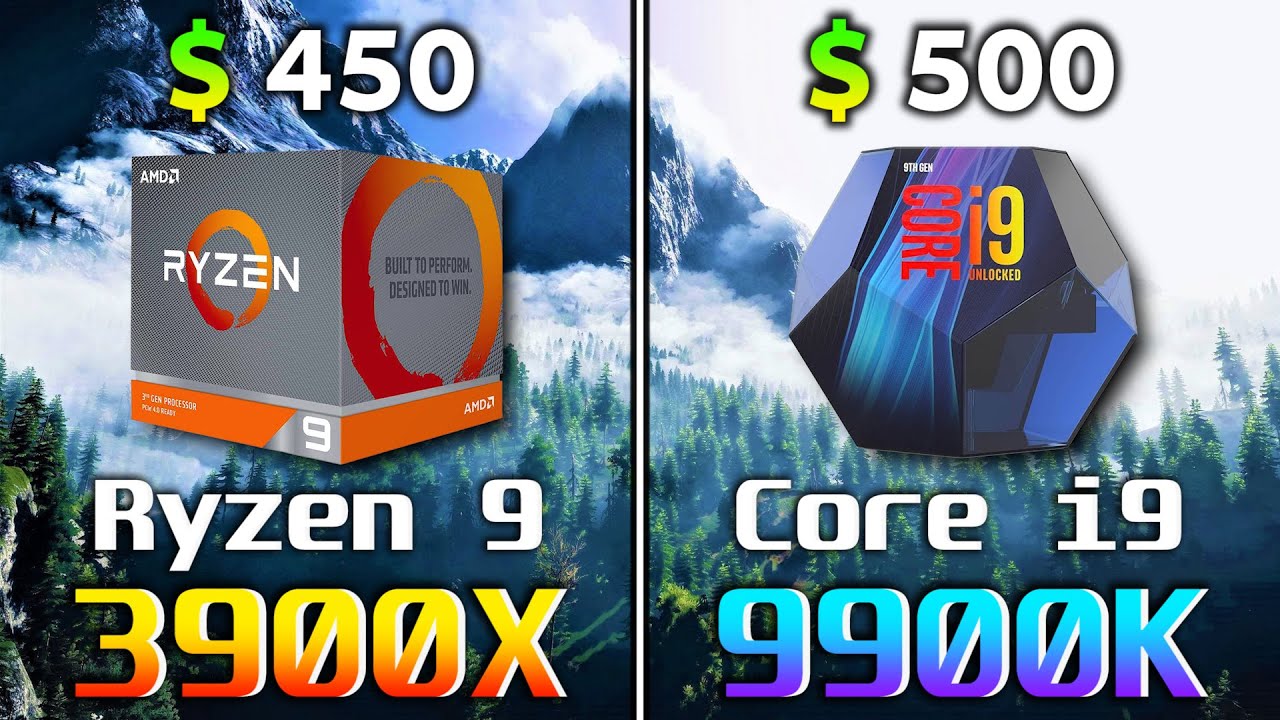 In terms of frame rates, for very low FPS (certainly not the case at 1080p with a 2080 Ti), 30 to 32 fps is a 7% increase, for example. Then at extreme high frame rates, a 5% increase is going from 200 to 210 fps, which is not a margin worth getting too excited over.
There were a few titles where the 3900X nudged ahead by insignificant margins and there were quite a few where it lost by an insignificant margin as well. Then there were games where the 3900X was slower by a 10% margin or greater, seven titles in total where Ryzen was up to 16% slower.
Now with both CPUs overclocked we see very little change. Here the 3900X was just 5% slower on average, so pushing the 9900K up to 5 GHz doesn’t give it an advantage.
What to Buy?
In our day-one review we found the Ryzen 9 3900X to be 8% slower on average across the 9 games we tested. By adding another 27 games to the mix, things haven’t changed much and surprisingly this played in AMD’s favor to an extent.
When it comes to value, these new results don’t change much either. If you ignore the bundled box cooler, the 3900X is a little more costly per frame than the 9900K. However, if you plan to use the Wraith Prism out of the box then the 3900X is a little cheaper than the Intel processor. At the end of the day, they’re both ~$500 CPUs and depending on what you use your PC for, one might be better than the other.
If you plan to use your PC for a multitude of tasks and not only to play games, but also create videos, 3D models or do anything that can take advantage of a 12-core processor, the Ryzen 9 3900X is going to be a significantly better investment. For productivity tasks in general, Ryzen is considerably faster than the Core i9 as shown in our full review.
The only reason we’d invest in the 9900K right now would be if we played games such as StarCraft II full time. There’s a few titles that do play noticeably better with the Intel CPU, in StarCraft’s case in complex late game 4v4 battles. Likewise, you’d go Intel if you needed every last frame possible, but short of that the 3900X is the better choice.
It’s worth remembering that we’re seeing little difference at 1080p with an RTX 2080 Ti. This means using an RTX 2080 will more than halve the margins seen here and we know because we’ve looked into it. Then with an RTX 2070 or RX 5700, performance will be identical. Alternatively, if you play at higher more GPU-bound resolutions, you’ll find the same thing, marginal difference in terms of gaming performance.
Shopping Shortcuts:
- AMD Ryzen 9 3900X on Amazon, Google Express
- Intel Core i9-9900K on Amazon, Google Express
- AMD Ryzen 7 3700X on Amazon, Google Express
- AMD Ryzen 5 3600X on Amazon, Google Express
- AMD Ryzen 5 3600 on Amazon, Google Express
- Intel Core i5-9600K on Amazon, Google Express
- Intel Core i5-9400F on Amazon, Google Express
- AMD Ryzen 5 2600X on Amazon, Google Express
- GeForce RTX 2070 Super on Amazon, Google Express
- GeForce RTX 2060 Super on Amazon, Google Express
- GeForce GTX 1660 Ti on Amazon, Google Express
IPC Battle — AMD Ryzen 9 3900X Vs Intel Core i9-9900K
By Nathan Kirsch •
AMD’s new 3rd Gen Ryzen processors that are built on the 7nm manufacturing process helped close the performance gap with Intel when they launched last month. Our testing showed that AMD led many of the heavily threaded tests since they had more cores, but Intel was still the single-threaded performance leader. AMD claimed its new 3rd Gen Ryzen CPUs had a 25% increase in IPC (Instructions Per Cycle) and that got us thinking. It has been a long time since we’ve taken two processors with the same number of cores and clock speeds for some proper IPC testing here on the site. The AMD Ryzen 9 3900X and Intel Core i9-9900K are still on the test bench, so we figured why not?
Setting up our IPC test was slightly complicated as we needed both processors to run at the same clock speed with the same number of cores and threads. To accomplish this we headed into the UEFI of both motherboards and set the multiplier to 40. We then disabled four cores on the AMD Ryzen 9 3900X to bring the core count down from 12 to 8. Intel Hyper-Threading and AMD Simultaneous MultiThreading (SMT) was disabled, so we ended up to 8-core, 8-thread processors running locked at 4. 0 GHz. Memory was set to 3400MHz with CL16 timings on both systems. We used our standard Z390 and X570 test platforms that you can read more about here with the only difference being both used a Patriot Scorch 256GB NVMe M.2 PCIe Solid State Drive.
This felt like it put both AMD and Intel on an even playing field as these are the flagship mainstream parts from both companies. One could argue that we could have used the AMD Ryzen 7 3700X to avoid disabling cores, but it only has 32MB of L3 cache whereas the AMD Ryzen 9 3900X has 64 MB of L3 cache. Since we are comparing the flagship models we wanted both AMD and Intel to have their best foot forward. Not to mention the AMD Ryzen 3900X ($499.00) and Intel Core i9-9900K ($479.00) are both price comparable.
Rather than running our normal benchmark test suite we gave an application-based benchmark called SYSmark 2018 by BAPCo a shot. This benchmark uses unmodified versions of real-world applications for measurement in areas of Productivity, Creativity and Responsiveness. The applications included are Microsoft Office 2016, Google Chrome version 65, Adobe Acrobat Pro DC, Adobe Photoshop CC (2018), Cyberlink PowerDirector 15, Adobe Lightroom Classic CC, AutoIT 3.3.14.2. You can download the SYSmark 2018 white paper here if you’d like to know what exactly it tests and how scoring is handled. We ran the optional conditioning run followed by three iterations of the benchmark to come up with the results below.
The results from our BAPCo SYSmark 2018 run showed that the Intel Core i9-9900K led all three usage areas. The Intel Core i9-9900K finished with a score of 1,758 while the AMD Ryzen 9 3900X finished with a score of 1,501. This shows that Intel has a 17.1% performance lead over AMD when both of these processors are running at 4GHz on 8-cores.
One of the really neat features in BAPCo SYSmark 2018 is that it includes a energy consumption result if you have a supported data logging power meter. We happen to have the proper model, so we were able to measure energy usage in watt-hours during the workloads. The results here show that the Intel Core i9-9900K used 77.84 Wh and the AMD Ryzen 9 3900X used 106.13 Wh while running the workloads. The Intel Core i9-9900K used 28.29 Wh or 26.7% lower system power during a run of SYSmark 2018. This was a bit shocking and paints a very different picture than looking at the maximum power draw of a CPU in a short-term PL2 power state.
So, after tens of hours of setup and testing we discovered that the Intel Core i9-9900K is able to deliver 17.1% more performance than the AMD Ryzen 9 3900X while using 26.7% less system power. That said, this is one benchmark utility and it paints a picture slightly different than some of the other results out there.
Hopefully you enjoyed our little Instructions-Per-Cycle (IPC) experiment. We plan on taking a closer look at SYSmark 2018 shortly. If you’d like to see more experiments like this in the future please leave a comment below!
Update 1: 8/22/2019 2pm – A good number of people ask why BAPCo SYSmark 2018 was used and question if it is a fair benchmark test suite to use. BAPCo claims they do not optimize any applications and have a public statement to that fact: https://bapco.com/faq/
Update 2: 8/22/2019 3pm – It was also crystal clear that the community would have liked to have seen the AMD Ryzen 7 3700X processor used instead of the Ryzen 9 3900X to avoid disabling cores and having a negative impact on performance. This was something that was avoided when we started benchmarking since the 3700X couldn’t run 4.0 GHz on auto Voltage settings. It needed to be manually set at 1.30V (up from 1.20V on auto) on our AMD X570 motherboard. BAPCo SYSmark 2018 was run on the 3700X with the conditioning pass and one iteration enabled in settings with SMT mode both enabled and disabled on the processor. Overall IPC performance did go up by about 3.2% by switching processor models. Enabling SMT gave the Ryzen 3700X another 2.5% performance boost in the overall score and almost an 11% boost in the creativity test suite.
Processor Intel Core i9 9900k vs AMD Ryzen 9 3900x. Comparison + tests in games!
Author Evgeny Vasilyev Reading 8 min Views 66 Published
Updated by
Good day everyone! Today we
Let’s compare two top processors — Intel Core i9 9900k and AMD Ryzen 9
3900x, as well as testing their performance in modern games. Difference
the price of these processors is small — you will have to pay for a model from Intel
about 10% more. However, prices may vary depending on
specific supplier of goods.