Cinebench Ranking Benchmark Results R15 Scores Database
* values marked with * are not real measurements but a rough average estimate to compare CB 15 with CB 11.5 values
What is CINEBENCH R15?
CINEBENCH R15 is a systems monitoring service that uses specifically generated CG images and scenes to test the efficiency of CPUs and GPUs, whether on your own machine or render farm, or on cloud-based remote machines.
The images and scenes that CINEBENCH R15 works with are created using Maxon Cinema 4D, but, as Dr. Bernd Lutz of Maxon explained to me, “depending on how other programs handle details, e.g. scaling with more cores, task switching, memory handling, etc., the results could differ when you do similar tests with another program. Nevertheless, the test results you get from CINEBENCH R15 will be a good indicator which CPUs/GPUs are better or worse than others.”
So there will be differences in the scores (see below) if you are using Maya or Houdini or whatever, but essentially you will beable to identify the processors that best suit your ambitions.
How it works
Main Processor Performance (CPU)
The test scenario is designed to use all of your system’s processing power to render a photorealistic 3D scene (the test scene is an extract from «No Keyframes», a lovely piece of animation by Aix Sponza – you can watch the whole fine work here).
The test puts up a number of render requirements calculated to drive any processor close to insane, with sharp and blurry reflections, area lights, shadows, procedural shaders, anti-aliasing, and so on.
CINEBENCH R15 use this scene because it makes use of algorithms that are sure to put stress on all the available processor cores.
Maxon tells us that “CINEBENCH R15 can measure systems with up to 256 processor threads.” Without making any attempt to count them myself, it looks accurate to say, as they do, that “the test scene contains approximately 2,000 objects, which in turn contain more than 300,000 polygons in total.” Of course, in high end production scenes there can be millions of polygons, but this is enough to test your system without wasting time.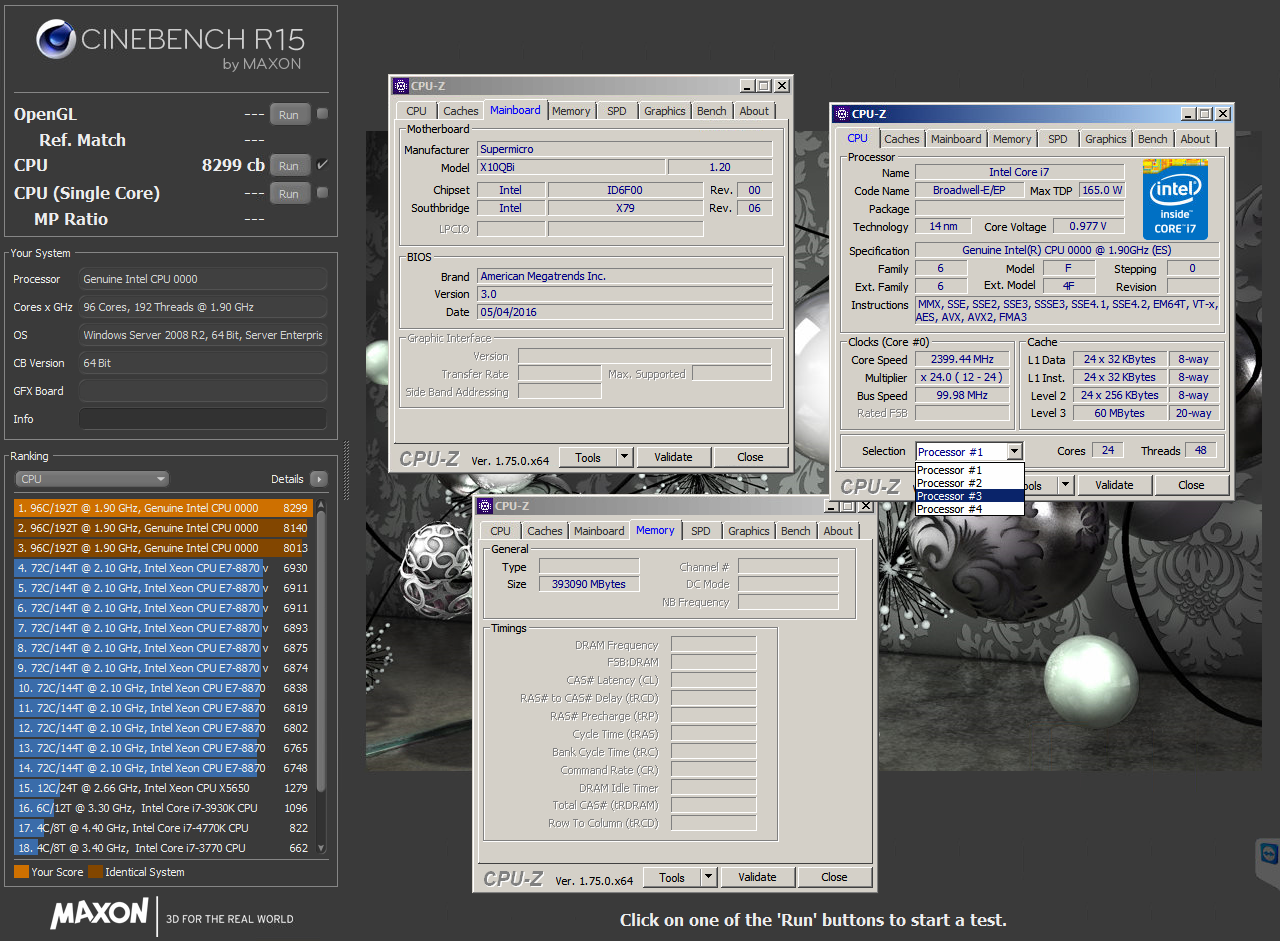
The score results of this test are displayed on the CINEBENCH R15 UI as points (pts). Simply enough, more points means better performance.
Graphics Card Performance (OpenGL)
To test the GPU performance in OpenGL mode CINEBENCH R15 uses a car chase scene (created by renderbaron). This is a dense scene that pulls out all the stops. The graphics card has to display a huge amount of geometry (nearly 1 million polygons) and textures, as well as a variety of effects, such as motion blur, bump maps, transparency, refraction, environments, lighting and others.
Performance depends on the GPU processor you are testing, and it also depends on the drivers used. The intention is to evaluate the performance across different disciplines and give a good average overview of the capabilities of your graphics hardware. The result is measured in frames per second refresh speed of the GPU (fps). As with the CPU test, the higher the number, the faster your graphics card.
Maxon provides specific technical information regarding both these test processes on the tech-page of CINEBENCH R15.
Why do we ask you to use it?
If you are testing your own machine, or if you are looking to upgrade your processors, CINEBENCH R15 offers an invaluable service. This applies to RebusFarm’s processors as much as anyone’s. That is why we ask you to send us your CINEBENCH R15 results. It helps us to maintain the high standards of service we have set for ourselves over the past years. Knowing the results experienced by our clients is all part of how we can make sure RebusFarm remains the outstanding cloud render service that its many clients know it to be.
Also, it would be a kindness to us as these results will help to raise our online presence and thus recruit more clients. As, we hope, our satisfied clients, we are sure you would want to help us find a wider audience for our service.
Thank you, vielen Dank
Cinebench R15 CPU Scores | Live 2020 Results
Updated: Oct 20, 2022 3:44 pm
Share this article…
Cinebench R15 Explained
What Is A Good Cinebench Score?
Gaming
Work
Office
Cinebench R15 Scores List
Multi-Core Vs. Single-Core Cinebench Results
What Is A Good Cinebench Score For Gaming?
AMD Vs. Intel
Final Thoughts
Cinebench is a cross-platform testing suite that is specifically used to test the efficiency and performance of both your CPU and GPU. Even though heavily criticized by tech giants Intel, thousands of people still decide to use Cinebench as their primary testing suite. But what exactly does your Cinebench score mean?
In the following article, we’ll be explaining everything you need to know about Cinebench and how you can use it to put your own system to the test.
So, without further ado, let’s take a closer look at how Cinebench R15 works.
Cinebench R15 Explained
Cinebench is one of the main testing software suites for enthusiasts looking to benchmark their CPUs and GPUs. The test scenario is purpose-designed to make use of all your system’s processing power when rendering a generated CG 3D scene.
The suite can be used to test your CPU and GPU – with users having options to benchmark their CPUs in single and multi-core scenarios. The test itself runs a number of different rendering requirements, which have been carefully chosen to push your components to the very limit. Sharp edges, blurry reflections, shadows, procedural shaders, and anti-aliasing have all been used within the test scenario to ensure all graphical areas are pushed.
At the end of the test, Cinebench will generate a score based on how well your hardware has handled the test. In the suite itself, Cinebench will show you (roughly) where you rank amongst other CPUs/GPUs. This will give you an initial idea of how well your system ranks.
See Pic Below:
As you can see from the test picture above, our 3900X ranked pretty high in the multi-core benchmark. It’s placed us at the top of the list and shows a clear indication of how powerful it is over alternative CPUs.
What Is A Good Cinebench Score?
So, what exactly is a good Cinebench score? It’s all good knowing whether or not your CPU can beat another, but how do I know whether I’ve got a good score for gaming or not? What if I want to do CPU intensive tasks like 3D animation and rendering?
Well, don’t worry, we’re going to explore exactly what score you should be looking to get for a variety of different scenarios. So, let’s get into it.
Gaming
Let’s start with gaming. Gaming can be a fairly demanding task and one that, most of the time, requires high single-core performance from your CPU. For less intensive gaming, I would recommend looking for a CPU with a single-core score of around 160. For more demanding AAA game titles, anything over 200 would be our go-to. The i7 9700K (a superb CPU for gaming) gets a score of 212. Having said that, remember, gaming performance doesn’t just come down to the single-core performance. Your GPU plays the strongest role in driving frame rates, so keep that in mind when purchasing your next processor.
Work
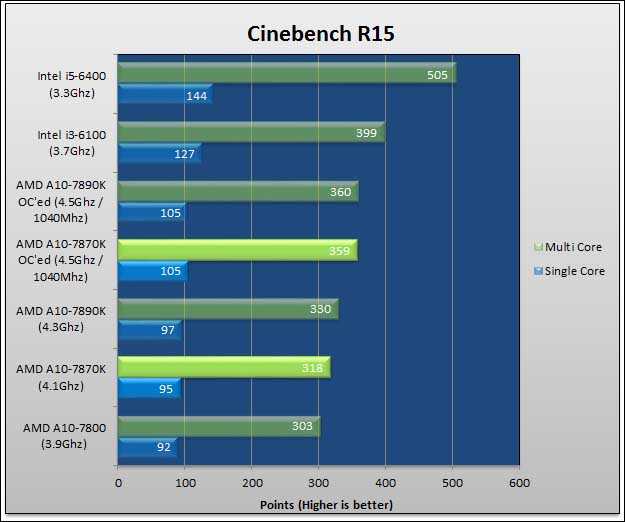
As for work tasks, we always recommend looking for a CPU with an excellent multi-core score. Over the past couple of years, AMD’s Ryzen lineup has been the go-to processor for high demanding workflows. This is thanks to their impressive multi-core performance levels. As you’ll soon see from the table below, AMD processors are fairly dominant in the multi-core scoring.
Office
Finally, if you’re looking to do office work and general email browsing, a score of 200+ is going to be more than enough for your needs. If you want to do more demanding tasks like video editing, we would recommend something in the region of 2000-3000. For anything more demanding, 4000 and above is where you should be looking.
Cinebench R15 Scores List
With that in mind, let’s take a quick look at the most up-to-date benchmarking results for today’s CPUs.
| CPU | Cores | GHz | Single Core | Multi-core |
|---|---|---|---|---|
| AMD Threadripper 3990X | 64 | 2.9 | 199 | 11000 |
| AMD Threadripper 3970X | 32 | 3.7 | 207 | 7395 |
| AMD Threadripper 3960X | 24 | 3.8 | 209 | 5935 |
| Intel Xeon W-3175X | 28 | 3.1 | 185 | 5514 |
| AMD Threadripper 2990WX | 32 | 3 | 178 | 5226 |
| Intel Xeon Platinum 8180 | 28 | 2. 5 5 |
166 | 4355 |
| AMD Threadripper 2970X | 24 | 3 | 175 | 4325 |
| AMD Ryzen 9 3950X | 16 | 3.5 | 215 | 4077 |
| AMD Epyc 7601 | 32 | 2.2 | 140 | 4068 |
| Intel Xeon Platinum 8168 | 24 | 2.7 | 161 | 3999 |
| AMD Epyc 7501 | 32 | 2 | 132 | 3912 |
| Intel Xeon Platinum 8176 | 28 | 2.1 | 165 | 3873 |
| AMD Epyc 7551P | 32 | 2 | 132 | 3838 |
| Intel i9 10980XE | 18 | 3 | 211 | 3799 |
| Intel i9 9980XE | 18 | 3 | 198 | 3740 |
| Intel i9 9990XE | 14 | 4 | 221 | 3732 |
| Intel Xeon Platinum 8164 | 26 | 2 | 161 | 3720 |
| Intel Xeon Platinum 8170 | 26 | 2. 1 1 |
161 | 3596 |
| Intel i9 7980XE | 18 | 2.6 | 184 | 3455 |
| Intel Xeon Platinum 8160 | 24 | 2.1 | 161 | 3444 |
| Intel Xeon Gold 6148 | 20 | 2.4 | 161 | 3310 |
| AMD Epyc 7451 | 24 | 2.3 | 141 | 3277 |
| Intel i9 9960X | 16 | 3.1 | 184 | 3211 |
| AMD Threadripper 2950X | 16 | 3.5 | 179 | 3210 |
| Intel Xeon Gold 6154 | 18 | 3 | 162 | 3210 |
| Intel Xeon Gold 6150 | 18 | 2.7 | 161 | 3188 |
| Intel i9 9940X | 14 | 3.3 | 190 | 3173 |
| AMD Ryzen 9 3900X | 12 | 3.8 | 213 | 3168 |
| Intel i9 7960X | 16 | 2.8 | 184 | 3161 |
| Intel Xeon Gold 6152 | 22 | 2. 1 1 |
161 | 3157 |
| AMD Epyc 7401P | 24 | 2 | 132 | 3156 |
| AMD Epyc 7401 | 24 | 2 | 132 | 3156 |
| Intel Xeon Gold 6138 | 20 | 2 | 161 | 3069 |
| AMD Threadripper 1950X | 16 | 3.4 | 166 | 3062 |
| Intel XEON W-2195 | 18 | 2.3 | 187 | 2949 |
| Intel Core i9-10900K | 10 | 3.7 | 232 | 2852 |
| Intel i9 7940X | 14 | 3.1 | 188 | 2849 |
| Intel Xeon Gold 6140 | 18 | 2.3 | 161 | 2785 |
| Intel Core i9-10900 | 10 | 2.8 | 225 | 2655 |
| AMD Threadripper 2920X | 12 | 3.5 | 176 | 2604 |
| Intel XEON E5-2699 v4 | 22 | 2.2 | 120 | 2460 |
| Intel i9 7920X | 12 | 2. 9 9 |
188 | 2438 |
| Intel i9 9920X | 12 | 3.5 | 188 | 2438 |
| AMD Threadripper 1920X | 12 | 3.5 | 168 | 2431 |
| Intel Core i7-10700K | 8 | 3.8 | 228 | 2345 |
| Intel i9 9900X | 10 | 3.5 | 197 | 2274 |
| Intel i9 9900KS | 8 | 4 | 220 | 2205 |
| AMD Epyc 7351P | 16 | 2.4 | 128 | 2184 |
| AMD Epyc 7351 | 16 | 2.4 | 128 | 2184 |
| Intel i9 9820X | 10 | 3.3 | 177 | 2170 |
| Intel i9 7900X | 10 | 3.3 | 193 | 2169 |
| AMD Ryzen 7 3800X | 8 | 3.9 | 209 | 2166 |
| AMD Ryzen 7 3700X | 8 | 3.6 | 205 | 2116 |
| Intel i9 9900KF | 8 | 3.6 | 218 | 2081 |
| Intel i9 9900K | 8 | 3. 6 6 |
218 | 2081 |
| AMD Epyc 7281 | 16 | 2.2 | 119 | 2033 |
| AMD Epyc 7301 | 16 | 2.2 | 119 | 2033 |
| Intel XEON W-2155 | 10 | 3.3 | 191 | 2021 |
| Intel i9 9980HK | 8 | 2.4 | 205 | 1930 |
| Intel XEON E5-2687W v4 | 12 | 3 | 138 | 1860 |
| Intel i9 9800X | 8 | 3.8 | 194 | 1826 |
| AMD Ryzen 5 3600X | 6 | 3.8 | 202 | 1795 |
| Intel i7 6950X | 10 | 3 | 147 | 1788 |
| AMD Ryzen 7 2700X | 8 | 3.7 | 180 | 1783 |
| Intel i7 7820X | 8 | 3.6 | 176 | 1734 |
| Intel Xeon Silver 4116 | 12 | 2.1 | 131 | 1722 |
| Intel i9 9880H | 8 | 2.3 | 197 | 1721 |
| AMD Threadripper 1900X | 8 | 3. 8 8 |
168 | 1711 |
| AMD Ryzen 7 1800X | 8 | 3.6 | 161 | 1613 |
| Intel XEON E5-2650 v4 | 12 | 2.2 | 128 | 1589 |
| AMD Ryzen 5 3600 | 6 | 3.6 | 197 | 1581 |
| Intel i7 6900K | 8 | 3.2 | 154 | 1562 |
| Intel i7 9700K | 8 | 3.6 | 212 | 1542 |
| Intel i7 9700KF | 8 | 3.6 | 212 | 1542 |
| AMD Ryzen 7 1700X | 8 | 3.4 | 145 | 1540 |
| AMD Ryzen 7 2700 | 8 | 3.2 | 165 | 1526 |
| Intel Xeon Silver 4114 | 10 | 2.2 | 131 | 1439 |
| Intel i7 8700K | 6 | 3.7 | 205 | 1428 |
| AMD Ryzen 7 1700 | 8 | 3 | 137 | 1426 |
| Intel i7 8700 | 6 | 3.2 | 195 | 1420 |
| Intel i7 8086K | 6 | 3. 7 7 |
215 | 1386 |
| AMD Ryzen 5 2600X | 6 | 3.6 | 176 | 1373 |
| Intel i7 7800X | 6 | 3.5 | 184 | 1333 |
| Intel i7 5960X | 8 | 3 | 177 | 1324 |
| AMD Ryzen 5 2600 | 6 | 3.4 | 163 | 1307 |
| Intel i9 8950HK | 6 | 2.9 | 206 | 1269 |
| AMD Ryzen 5 1600X | 6 | 3.3 | 161 | 1250 |
| Intel i7 6850K | 6 | 3.6 | 156 | 1235 |
| Intel i7 9750H | 6 | 2.6 | 192 | 1233 |
| Intel Xeon Silver 4110 | 8 | 2.1 | 131 | 1148 |
| AMD Ryzen 5 1600 | 6 | 3.2 | 145 | 1147 |
| Intel Xeon Silver 4109T | 8 | 2 | 131 | 1103 |
| Intel XEON E5-2620 v4 | 8 | 2.1 | 125 | 1096 |
| Intel i7 6800K | 6 | 3. 4 4 |
146 | 1096 |
| AMD Epyc 7251 | 8 | 2.1 | 128 | 1093 |
| Intel Xeon 2176M | 6 | 2.7 | 183 | 1070 |
| Intel i5 9600K | 6 | 3.7 | 200 | 1068 |
| Intel i5 9600KF | 6 | 3.7 | 200 | 1068 |
| Intel i7 8750H | 6 | 2.2 | 180 | 1063 |
| Intel i5 9600 | 6 | 3.1 | 186 | 1042 |
| Intel i5 8600K | 6 | 3.6 | 183 | 1040 |
| Intel i7 8850H | 6 | 2.6 | 182 | 1023 |
| Intel i5 9500F | 6 | 3 | 182 | 1016 |
| Intel i5 9500 | 6 | 3 | 182 | 1016 |
| Intel Xeon Silver 4108 | 8 | 1.8 | 130 | 1014 |
| Intel i7 7700K | 4 | 4.2 | 191 | 996 |
| Intel i5 9400 | 6 | 2. 9 9 |
177 | 987 |
| Intel i5 9400F | 6 | 2.9 | 177 | 987 |
| Intel i7 7740X | 4 | 4.3 | 196 | 986 |
| Intel i5 8400 | 6 | 2.8 | 161 | 966 |
| Intel i5 8600 | 6 | 3.1 | 178 | 959 |
| Intel i5 8500 | 6 | 3 | 174 | 934 |
| Intel i5 9600T | 6 | 2.3 | 159 | 908 |
| AMD Ryzen 5 2400G | 4 | 3.6 | 156 | 826 |
| Intel i5 8400H | 4 | 2.5 | 178 | 819 |
| Intel i5 9500T | 6 | 2.2 | 155 | 811 |
| Intel XEON W-2123 | 4 | 3.6 | 167 | 806 |
| AMD Ryzen 5 1500X | 4 | 3.5 | 152 | 803 |
| AMD Ryzen 3750H | 4 | 2.3 | 161 | 802 |
| Intel i5 8300H | 4 | 2. 3 3 |
169 | 795 |
| AMD Ryzen 5 1400 | 4 | 3.2 | 134 | 787 |
| AMD Ryzen 5 3550H | 4 | 2.1 | 142 | 733 |
| Intel i5 9400T | 6 | 1.8 | 150 | 710 |
| Intel i5 7600K | 4 | 3.8 | 176 | 701 |
| AMD Ryzen 7 3700U | 4 | 2.3 | 146 | 701 |
| Intel Xeon Silver 4112 | 4 | 2.6 | 131 | 665 |
| AMD Ryzen 7 2700U | 4 | 2.2 | 138 | 662 |
| AMD Ryzen 5 3500U | 4 | 2.1 | 138 | 620 |
| Intel i7 8650U | 4 | 1.9 | 175 | 614 |
| AMD Ryzen 5 2500U | 4 | 2 | 130 | 584 |
| AMD Ryzen 3 2200G | 4 | 3.5 | 142 | 576 |
| Intel i7 8565U | 4 | 1.8 | 178 | 564 |
| Intel i7 8550U | 4 | 1. 8 8 |
167 | 564 |
| Intel i5 8265U | 4 | 1.6 | 171 | 549 |
| Intel i5 8250U | 4 | 1.6 | 157 | 549 |
| Intel XEON W-2104 | 4 | 3.2 | 137 | 531 |
| AMD Ryzen 3 3300U | 4 | 2.1 | 139 | 510 |
| Intel XEON W-2102 | 4 | 2.9 | 124 | 485 |
| AMD Ryzen 3 2300U | 4 | 2 | 134 | 480 |
| AMD Ryzen 3 1200 | 4 | 3.45 | 139 | 478 |
| AMD Athlon 200GE | 2 | 3.2 | 125 | 357 |
| AMD Athlon 300U | 2 | 2.6 | 138 | 344 |
| AMD Ryzen 3 3200U | 2 | 2.6 | 138 | 344 |
| AMD Ryzen 3 2200U | 2 | 2.5 | 129 | 318 |
Taking what we explained in the last section, you should be able to use this table to make a more informed decision on your next CPU purchase. Furthermore, you’ll be able to use this as a benchmark for your own CPU tests – making sure your CPU isn’t underperforming.
We touched on this earlier (briefly), but for those that aren’t familiar with the difference between single-core and multi-core performance, let’s discuss it a little further.
Whether you’re looking to do some light gaming or heavy rendering, understanding what is required from your CPU is an extremely important step towards your next upgrade. There is a very clear difference between great gaming CPUs and great “work task” CPUs.
Ultimately, the answer is quite simple. If you’re looking for a new gaming CPU, get one with high single-core performance. Alternatively, if you want a CPU for heavy workflow scenarios, opt for a newer CPU with high multi-core performance.
Single-core performance refers to how one of the cores (that make up your CPU) performs on its own. Cinebench will push this core to its limit to see how it handles the scenario. A decent score for single-core performance is around 170+.
What Is A Good Cinebench Score For Gaming?
When we think of a gaming CPU, we usually think of one that provides high single-core performance. That’s because a lot of games haven’t been optimized to make use of numerous cores. The single-core performance of your CPU should be one of the most important areas of consideration when thinking of building a gaming rig. Having said that, the GPU is still the number one component in driving frame rates.
As we move forward to the 21st century, games are now being designed to make use of more cores. Games such as Witcher 3 can now make use of numerous cores, meaning multi-core CPUs are becoming much more desirable.
Ensuring your CPU and GPU work in harmony is the next thing to consider. What I mean by that is, you can’t pair a low scoring CPU and the best scoring GPU because your GPU will simply be bottlenecked by the processor. Making sure your CPU and GPU are evenly matched will ensure the best overall gaming performance.
AMD Vs. Intel
One of the big questions surrounding the CPU industry at the moment is whether we should go AMD or Intel – a question that was much easier to answer just 12 months ago. Thanks to AMD, though, the gap between the two giants has now become much, much closer.
As you can see from the chart above, Intel still pretty much dominates the single-core performance benchmarks and have done for the past 10+ years. AMD has been edging closer over the last few years, especially with their impressive range of Ryzen CPUs, but still fall slightly short of Intel in this department. Where AMD excels, however, is in the multi-core performance benchmarking.
AMD has always been renowned for its high multi-core performance – something that doesn’t look likely to slow down any time soon. Their latest arrivals which include Ryzen 9 3900X and 3950X, currently showcase some of the best consumer-grade performance levels of any CPU available today.
Final Thoughts
So, there you have it, our full rundown of Cinebench R15, and how the scores can affect your next purchase. Hopefully, this article has made understanding the software a little bit easier.
Ultimately, Cinebench scores are something that should be considered but not relied on. Depending on what you’re doing with your PC, you might find the Cinebench score to be a little irrelevant. Make sure to understand your needs first, then do proper research on what your system needs before purchasing your upgrade.
Anyway, leave us a comment if you have any further questions on the matter. We also have our Community Hub where you can discuss similar topics with like-minded people!
WePC is reader-supported. When you buy through links on our site, we may earn an affiliate commission. Learn more
ADAC 2022: Summer tire test in size 185/65 R15
Source: ADAC
A group of experts from the German automobile club ADAC conducted a large comparison test of summer tires, while covering the 2022 models relevant for the local market. A total of 34 kits were tested, 16 of which were designed for small cars (tyres size 185/65 R15 88H), and the remaining 18 for medium-sized passenger vehicles and subcompact crossovers (215/60 R16 99V).
In this article we will look at the results of 185/65 R15 tires suitable for a number of small cars like the Audi A1 and the Vokswagen Polo used as a carrier. In general, the results of the participants pleased the testers, but it would not be superfluous to get acquainted with the shortcomings found in them. nine0003
Tires with an H speed rating are designed for decent speeds (up to 210 km/h), so they must have the most reliable grip on dry and wet road surfaces. Well, which of the 185/65 R15 summer tires will provide high driving safety, ADAC testers give their answer in the 2022 test.
List of tested summer tires:
- Vredestein Ultrac
- Semperit Speed-Life 3
- Pirelli Cinturato P1 Verde
- Michelin Primacy 4
- Matador MP47 Hectorra 3
- Laufenn G Fit EQ+
- Goodyear Efficient Grip Performance 2
- Giti GitiSynergy h3
- Fulda EcoControl HP 2
- Firestone Roadhawk
- Falken Sincera SN110 Ecorun
- Dunlop Sport BlueResponse
- Cooper CS7
- Continental EcoContact 6
- Bridgestone Turanza T005
- BF Goodrich Advantage
ADAC 2022 test results
Good overall result: none of the 16 test candidates showed any serious shortcomings in the main criteria for safety on dry and wet pavement, as well as in tests for noise level, energy efficiency and wear resistance. Six models were classified as highly recommended («Good» verdict) and another ten as recommended («Satisfactory» verdict).
However, it is worth looking at the details, because even among the six «good» models there are significant differences in terms of behavior under certain conditions. And the differentiation becomes even clearer when comparing their scores to detailed ratings of “fair” tyres, which generally score lower overall due to identified shortcomings. But if you can put up with the individual weaknesses of the models that best suit your driving style, then the 2022 ADAC test results will help you find relatively inexpensive options to operate. nine0003 Summary table of results. Summer tire test 185/65 R15, ADAC, 2022 (click to enlarge)
Leader group: Excellent balance of performance the highest mileage in the test. They took first place with a minimum margin from the closest pursuers.
The Pirelli Cinturato P1 Verde (2.3 points) and Bridgestone Turanza T005 (2. 1 points) tires were developed with a focus on dry and wet performance, the German experts noted, while their wear resistance was also satisfactory. high level, like the test-winning model. nine0003 Pirelli Cinturato P1 Verde
The Michelin Primacy 4 tires (2.1 points) were noted for their performance balance. They did not receive the highest scores for any of the main safety criteria in the test, but they showed quite good properties on both dry and wet pavement. They also performed well in the wear resistance test. At the same time, in 2022, the French tire manufacturers released an updated version of the model — Michelin Primacy 4+, which surpasses the basic modification in grip properties on wet surfaces, especially at the wear limit. Perhaps in future comparative tests, she will be able to improve the performance of tires without a plus in the name. nine0003
Dunlop Sport BluResponse and Giti GitiSynergy h3 performed well in wet and dry conditions and in terms of wear. They shared fifth place with 2.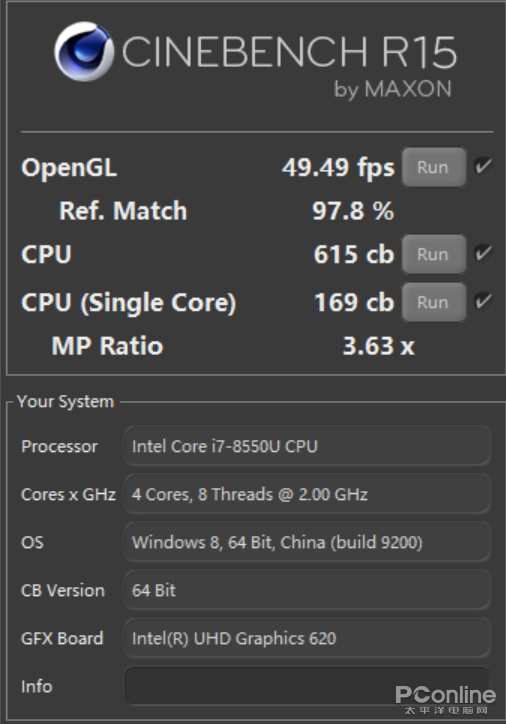 5 points each.
Giti GitiSynergy h3
Devaluation of the overall score due to dry grip
Four out of ten «satisfactory» models — Laufenn G Fit EQ + (2.6 points), Continental EcoContact 6 (2.8 points), Firestone Roadhawk ( 2.8 points) and Semperit Speed-Life 3 (3.0 points) — the testers found some similarities. The designated tires have impressive performance on dry roads, but on wet pavement they have minor flaws, which have led to a devaluation of their overall ratings. nine0003
Some of these tires are cheaper second-line products from premium manufacturers: Hankook owns Laufenn, Bridgestone owns Firestone, and Continental owns Semperit.
Laufenn G Fit EQ+
But the Continental EcoContact 6 is the “premium” model in this laggard group, says a Shina Guide technician. Its shortcomings were obvious even at the launch stage, and the manufacturer tried in every possible way to raise sales through marketing. At the same time, the EC6 is the only summer tire in the ADAC 2022 test that was able to get very good marks for environmental friendliness and economy. Despite the smallest tread depth in new condition, they impress with their mileage. In terms of fuel consumption, the Continental EcoContact 6 is also ahead of many rivals, but it obviously lives up to its name more in terms of «Eco» than in terms of «Contact». nine0003
Individually flawed tires
BFGoodrich Advantage tires (a subsidiary of Michelin), with a total score of 3.0, showed weaknesses in both dry and wet tests, resulting in a devaluation of the overall score. The
BFGoodrich Advantage
Falken Sincera SN110 Ecorun and Vredestein Ultrac (Apollo Tires tires) also scored only 3.0 in the overall rating and received a «Fair» verdict from the ADAC testers due to their poor wear resistance. But the Ultrac, in particular, performs well in dry and wet road conditions, so it could be a good option to equip a second family car, for example. nine0003
The three remaining models showed deficiencies in both dry and wet conditions. But at the same time, the Fulda EcoControl HP2 tires (3. 1 points, products of one of the Goodyear subbrands) were able to show positively due to high mileage, while the Cooper CS7 (3.2 points) in terms of wear resistance showed only satisfactory result.
Falken Sincera SN110 Ecorun
Slovak tires Matador MP47 Hectorra 3 (3.3 points), developed by Continental, have the greatest weakness on dry surfaces. nine0003
Conclusion
This is another test that shows how much you have to read between the lines when choosing tires, and also how important it is to know your own driving style and individual tire requirements. Because only then can you find the tires that best suit you in terms of features and asking price.
Similar news:
Summer tire test 185/65 R15 (ADAC 2022)
The German automobile club ADAC has been reviewing summer tires for several years. This time the testers used tires in the popular passenger car size 185/65 R15. With the summer season getting closer, drivers should know the capabilities of individual models in different conditions and rely on proven solutions. nine0003
ADAC is an organization of over 17 million car fans. Their independent rating is highly valued by drivers, and tire manufacturers work hard to ensure that their model wins the test. A high position in the ranking confirms great potential, so the companies are pleased to note that their rubber has been tested by ADAC.
Conditions of assessments in the test of summer tires 185 65 15
For testing summer tires this year in size 185/65 R15 16 models from different price categories were selected. The rating includes both premium-class tires and models of the middle price category, as well as budget products. This size is installed in cars with a compact body, such as the Audi A1 or the Volkswagen Polo. Models with speed index H were tested — up to 210 km / h. nine0003
The tires have been tested and assigned weights that determine their share in the final score: dry performance (20% of the score) and wet performance (40%), comfort and noise (10%), fuel economy (10%), and resistance to consumption (20%). The tests took place at the famous Kontidrom training ground. After testing and calculating the weighted average, the final marks were given in accordance with the following key:
- 0.6-1.5 — very good
- 2.6-3.5 — satisfactory
- 3.6-4.5 — enough
- Above 4.6 — insufficient
nine0013 1.6-2.5 — good
| Goodyear Efficient Grip Performance 2 |
98 |
C/A/69 | 2.3 | 2.0 | 3.2 | 2.2 | 1.0 | 2.0 |
| Bridgestone Turanza T005 |
94 |
B/A/70 | 1.8 | 1.7 | 3.3 | 1.9 | 2.5 | 2.1 |
| Michelin Primacy 4 |
107 |
C/A/68 |
1. 8 8 |
2.0 | 2.9 | 2.1 | 2.0 | 2.1 |
| Pirelli Cinturato P1 Verde |
90 |
C/B/69 |
1.6 | 2.3 | 3.2 | 2.1 | 2.3 | |
| Dunlop Sport BluResponse |
97 |
B/A/67 |
2.0 | 2.5 | 3.0 | 2.3 | 2.5 | 2.5 |
| Giti GitiSynergy h3 |
92 |
C/A/70 |
2.4 | 2.3 | 3.2 | 2.4 | 2.5 | 2.5 |
| Laufenn G Fit EQ |
64 |
D/B/70 |
2.4 | 2.6 | 3.0 | 1.8 | 2. 5 5 |
2.6 |
| Continental EcoContact 6 |
99 |
A/A/70 |
2.5 | 2.8 | 2.9 | 1.2 | 1.5 | 2.8 |
| Firestone Roadhawk |
74 |
C/A/70 | 2.2 | 2.8 |
3.7 |
2.4 | 2.0 | 2.8 |
| BF Goodrich Advantage |
84 |
nine0002 C/B/69 | 2.9 | 3.0 | 3.2 | 2.1 | 2.5 | 3.0 |
| Falken Sincera SN110 |
77 |
C/A/69 |
1.9 | 2.6 | 2.7 | 1.7 | 3.0 | |
| Semperit Speed-Life 3 |
80 |
C/B/70 |
2. 4 4 |
3.0 | 2.9 | 1.9 | 2.0 | 3.0 |
| Vredestein Ultrac | nine0002 78 | C/A/69 | 1.8 | 2.1 | 3.0 | 2.5 | 3.0 | 3.0 |
| Fulda EcoControl HP 2 |
76 |
E/C/69 | 2.7 | 3.1 | 3.2 | 2.2 | 3.1 | |
| Cooper CS7 |
76 |
C/B/68 |
3.2 | 3.2 | 3.0 | 1.9 | 3.0 | 3.2 |
| Matador MP47 Hectorra 3 | nine0002 76 | C/B/70 | 3.3 | 2.7 | 2.8 | 2.0 | 2.5 | 3.3 |
The Goodyear EfficientGrip Performance 2 (2. 0) is the winner of the 185/65 R15 summer tire rating. This model is designed for drivers who, in addition to performance in all conditions, also expect high tread strength. In terms of fuel economy, he is the undisputed leader — in this category, he scored 1.0 points. The tire performs well in both dry and wet conditions. A good result was also achieved in terms of fuel economy. The model is one of the most expensive in the ranking, but tires of comparable cost can be found even in the middle of the ranking. nine0003
Perfect safety in summer weather
For drivers looking for durability, traction and short braking distances on wet and dry roads, one of the runner-up models is the best choice. These are Bridgestone Turanza T005 and Michelin Primacy 4. Both tires completed the tests with a final score of 2.1. On dry pavement, both scored 1.8 points, which was the second result in this competition.
On the other hand, in wet handling the Bridgestone tire is unquestionably the leader. Her rating of 1.7 was unbeatable. Bridgestone’s tread wear was worse than Michelin’s (from 2.5 to 2.0). However, it offers better fuel efficiency (from 1.9up to 2.1). It is also worth noting that the Michelin Primacy 4 is the most expensive model that took part in the test.
High grip and low fuel consumption
The Pirelli Cinturato P1 Verde finished fourth in the test. The rubber is the leader in dry handling and finished the competition with a score of 1.6. Her overall score is reduced due to her wet behavior, but the 2.3 still gives her a «good» rating. Pirelli wears at the same rate as Bridgestone, with a score of 2.5 in this competition. nine0003
Fifth place went to Dunlop Sport BluResponse and Giti GitiSynergy h3 with a combined score of 2.5. Both models performed well in both dry and wet conditions. They are also the last two models to receive a «good» rating in both categories. The Giti tires were the worst in the entire ranking in terms of fuel efficiency. However, her final score of 2.4 is in the «good» range.
Profitable budget and «sturdy» premium class
Models with an overall rating of «satisfactory» are already in seventh position. These are models that, compared to tires from higher places, lost mainly on wet surfaces. Laufenn G Fit EQ LK41+ from seventh place is a proposal that certainly deserves attention. The tires grip well on dry roads, have low rolling resistance and are affordable. nine0003
Eighth place belongs to the Continental EcoContact 6 and Firestone Roadhawk. These are models that perform well on dry pavement, but have a lower score due to their performance on wet pavement. Continental pulled up a bit in terms of abrasion resistance — 1.5 — one of the best results. With fuel consumption, things were even better — 1.2 — an unsurpassed result. The Firestone performed well in these parameters, but its driving comfort score of 3.7 was the weakest result among the tested models. nine0003
Four models finished in tenth position with a score of 3. 0: BFGoodrich Advantage, Falken SN110, Semperit Speed-Life 3 and Vredestein Ultrac. The BFGoodrich is the first tire to be rated «satisfactory» on a dry road. The remaining three models were able to receive a «good» rating. Vredestein managed to achieve good results on wet pavement as well. Vredestein and Falken did not perform well in terms of durability.
Fourteenth place was taken by Fulda EcoControl HP 2 tire. Both this model and the two behind it performed poorly on either wet or dry pavement. Their behavior on the road was rated as satisfactory. The undeniable advantage of Fulda is its high abrasion resistance. nine0003
Cooper CS7 came in fifteenth place. Admittedly, although its results are only sufficient, they are still very balanced — 3.2 in the wet and dry. Tires lost points due to rapid wear — 3.0.
The Matador MP47 Hectorra 3 closes the list. The model performed better on wet roads than on dry ones (from 2.7 to 3.3). However, so far these are only satisfactory results.