CPU performance
This table shows peak CPU speed
(based on Whetstone benchmarks)
of computers participating in this project.
| CPU model | Number of computers | Avg. cores/computer | GFLOPS/core | GFLOPs/computer |
|---|---|---|---|---|
| Intel(R) Core(TM) i5-9600K CPU @ 3.70GHz [x86 Family 6 Model 158 Stepping 12] | 12 | 6.00 | 6.29 | 37.73 |
| Intel(R) Core(TM) i9-9900K CPU @ 3.60GHz [x86 Family 6 Model 158 Stepping 12] | 15 | 16.00 | 6.18 | 98.88 |
| Intel(R) Core(TM) i9-9900K CPU @ 3.60GHz [x86 Family 6 Model 158 Stepping 13] | 10 | 16.00 | 6.09 | 97.45 |
| Intel(R) Core(TM) i7-7700K CPU @ 4.20GHz [x86 Family 6 Model 158 Stepping 9] | 70 | 8.00 | 5.99 | 47.88 |
| Intel(R) Core(TM) i5-5575R CPU @ 2.80GHz [x86 Family 6 Model 71 Stepping 1] | 20 | 4. |
5.92 | 23.70 |
| Intel(R) Core(TM) i5-7600K CPU @ 3.80GHz [x86 Family 6 Model 158 Stepping 9] | 38 | 4.00 | 5.83 | 23.33 |
| Intel(R) Core(TM) i5-8500 CPU @ 3.00GHz [x86 Family 6 Model 158 Stepping 10] | 35 | 6.00 | 5.73 | 34.39 |
| Intel(R) Core(TM) i5-7600 CPU @ 3.50GHz [x86 Family 6 Model 158 Stepping 9] | 18 | 4.00 | 5.71 | 22.83 |
| Intel(R) Core(TM) i7-7700 CPU @ 3.60GHz [x86 Family 6 Model 158 Stepping 9] | 12 | 8.00 | 5.58 | 44.62 |
| Intel(R) Core(TM) i7-9700K CPU @ 3.60GHz [Family 6 Model 158 Stepping 12] | 70 | 8.00 | 5.53 | 44.24 |
| Intel(R) Core(TM) i5-9500 CPU @ 3.00GHz [Family 6 Model 158 Stepping 10] | 34 | 6.00 | 5.51 | 33.05 |
| Intel(R) Core(TM) i7-6700K CPU @ 4.00GHz [x86 Family 6 Model 94 Stepping 3] | 43 | 8. 00 00 |
5.47 | 43.77 |
| AMD Ryzen 7 3800X 8-Core Processor [Family 23 Model 113 Stepping 0] | 53 | 16.00 | 5.46 | 87.35 |
| AMD Ryzen 9 3950X 16-Core Processor [Family 23 Model 113 Stepping 0] | 58 | 31.45 | 5.42 | 170.56 |
| Intel(R) Core(TM) i7-9700 CPU @ 3.00GHz [Family 6 Model 158 Stepping 13] | 73 | 8.00 | 5.42 | 43.34 |
| Intel(R) Core(TM) i7-9700K CPU @ 3.60GHz [Family 6 Model 158 Stepping 13] | 45 | 8.00 | 5.40 | 43.23 |
| Intel(R) Core(TM) i5-8500B CPU @ 3.00GHz [x86 Family 6 Model 158 Stepping 10] | 10 | 6.00 | 5.40 | 32.41 |
| Intel(R) Core(TM) i7-4790K CPU @ 4.00GHz [x86 Family 6 Model 60 Stepping 3] | 27 | 8.00 | 5.40 | 43.21 |
| Intel(R) Core(TM) i7-8700B CPU @ 3.20GHz [x86 Family 6 Model 158 Stepping 10] | 25 | 12. 00 00 |
5.38 | 64.55 |
| Intel(R) Core(TM) i5-9600K CPU @ 3.70GHz [Family 6 Model 158 Stepping 12] | 38 | 6.00 | 5.35 | 32.12 |
| Intel(R) Xeon(R) W-2140B CPU @ 3.20GHz [x86 Family 6 Model 85 Stepping 4] | 19 | 16.00 | 5.35 | 85.63 |
| Intel(R) Core(TM) i9-9900K CPU @ 3.60GHz [Family 6 Model 158 Stepping 12] | 142 | 15.65 | 5.34 | 83.59 |
| AMD Ryzen 9 3900X 12-Core Processor [Family 23 Model 113 Stepping 0] | 132 | 23.42 | 5.32 | 124.49 |
| Intel(R) Core(TM) i5-6600 CPU @ 3.30GHz [x86 Family 6 Model 94 Stepping 3] | 19 | 4.00 | 5.29 | 21.16 |
| Intel(R) Core(TM) i5-4690 CPU @ 3.50GHz [x86 Family 6 Model 60 Stepping 3] | 18 | 4.00 | 5.28 | 21.12 |
| Intel(R) Core(TM) i5-7500 CPU @ 3.40GHz [x86 Family 6 Model 158 Stepping 9] | 55 | 4. 00 00 |
5.28 | 21.12 |
| Intel(R) Core(TM) i5-9600K CPU @ 3.70GHz [Family 6 Model 158 Stepping 13] | 24 | 6.00 | 5.27 | 31.61 |
| AMD Ryzen Threadripper 2920X 12-Core Processor [Family 23 Model 8 Stepping 2] | 12 | 23.00 | 5.26 | 121.06 |
| Intel(R) Core(TM) i7-9700F CPU @ 3.00GHz [Family 6 Model 158 Stepping 13] | 11 | 8.00 | 5.26 | 42.07 |
| Intel(R) Core(TM) i9-9900K CPU @ 3.60GHz [Family 6 Model 158 Stepping 13] | 77 | 15.66 | 5.26 | 82.34 |
| AMD Ryzen 7 3700X 8-Core Processor [Family 23 Model 113 Stepping 0] | 130 | 17.17 | 5.22 | 89.57 |
| Intel(R) Core(TM) i9-9900KF CPU @ 3.60GHz [Family 6 Model 158 Stepping 12] | 14 | 16.00 | 5.20 | 83.25 |
| AMD Ryzen 5 3600X 6-Core Processor [Family 23 Model 113 Stepping 0] | 35 | 12. 00 00 |
5.18 | 62.22 |
| AMD Ryzen 5 3600 6-Core Processor [Family 23 Model 113 Stepping 0] | 95 | 11.87 | 5.15 | 61.17 |
| Intel(R) Core(TM) i9-9900 CPU @ 3.10GHz [Family 6 Model 158 Stepping 13] | 22 | 16.00 | 5.11 | 81.74 |
| Intel(R) Core(TM) i9-9980HK CPU @ 2.40GHz [x86 Family 6 Model 158 Stepping 13] | 13 | 16.00 | 5.09 | 81.39 |
| Intel(R) Core(TM) i9-9880H CPU @ 2.30GHz [x86 Family 6 Model 158 Stepping 13] | 11 | 16.00 | 5.07 | 81.15 |
| Intel(R) Core(TM) i5-7600K CPU @ 3.80GHz [Family 6 Model 158 Stepping 9] | 41 | 4.00 | 5.05 | 20.20 |
| Intel(R) Core(TM) i5-8600K CPU @ 3.60GHz [Family 6 Model 158 Stepping 10] | 40 | 6.00 | 5.01 | 30.04 |
| Intel(R) Core(TM) i7-7700K CPU @ 4.20GHz [Family 6 Model 158 Stepping 9] | 241 | 7. 98 98 |
5.00 | 39.91 |
| AMD Ryzen Threadripper 2950X 16-Core Processor [Family 23 Model 8 Stepping 2] | 21 | 32.00 | 4.99 | 159.59 |
| Intel(R) Core(TM) i7-6850K CPU @ 3.60GHz [Family 6 Model 79 Stepping 1] | 34 | 11.82 | 4.98 | 58.86 |
| Intel(R) Xeon(R) CPU E5-1650 v4 @ 3.60GHz [Family 6 Model 79 Stepping 1] | 10 | 12.00 | 4.96 | 59.46 |
| Intel(R) Core(TM) i5-8600 CPU @ 3.10GHz [Family 6 Model 158 Stepping 10] | 10 | 6.00 | 4.95 | 29.68 |
| Intel(R) Xeon(R) Platinum 8168 CPU @ 2.70GHz [Family 6 Model 63 Stepping 0] | 15 | 16.00 | 4.87 | 77.98 |
| Intel(R) Core(TM) i5-8500 CPU @ 3.00GHz [Family 6 Model 158 Stepping 10] | 69 | 6.00 | 4.87 | 29.23 |
| AMD Ryzen 7 2700X Eight-Core Processor [Family 23 Model 8 Stepping 2] | 195 | 15. 93 93 |
4.87 | 77.58 |
| Intel(R) Core(TM) i5-4570 CPU @ 3.20GHz [x86 Family 6 Model 60 Stepping 3] | 28 | 4.00 | 4.87 | 19.46 |
| Intel(R) Core(TM) i5-7360U CPU @ 2.30GHz [x86 Family 6 Model 142 Stepping 9] | 18 | 4.00 | 4.86 | 19.45 |
| Intel(R) Core(TM) i7-8700K CPU @ 3.70GHz [Family 6 Model 158 Stepping 10] | 311 | 11.96 | 4.86 | 58.12 |
| Intel(R) Core(TM) i5-6500 CPU @ 3.20GHz [x86 Family 6 Model 94 Stepping 3] | 55 | 4.00 | 4.85 | 19.41 |
| Intel(R) Core(TM) i7-4771 CPU @ 3.50GHz [x86 Family 6 Model 60 Stepping 3] | 31 | 8.00 | 4.84 | 38.68 |
| Intel(R) Core(TM) i5-7400 CPU @ 3.00GHz [x86 Family 6 Model 158 Stepping 9] | 20 | 4.00 | 4.82 | 19.29 |
| AMD Ryzen 5 2600X Six-Core Processor [Family 23 Model 8 Stepping 2] | 49 | 12. 00 00 |
4.82 | 57.81 |
| Intel(R) Core(TM) i7-8086K CPU @ 4.00GHz [Family 6 Model 158 Stepping 10] | 18 | 12.00 | 4.79 | 57.48 |
| Intel(R) Core(TM) i7-8700 CPU @ 3.20GHz [Family 6 Model 158 Stepping 10] | 345 | 11.95 | 4.79 | 57.21 |
| Intel(R) Core(TM) i5-9400 CPU @ 2.90GHz [Family 6 Model 158 Stepping 13] | 10 | 6.00 | 4.78 | 28.66 |
| Intel(R) Core(TM) i7-7800X CPU @ 3.50GHz [Family 6 Model 85 Stepping 4] | 27 | 12.00 | 4.77 | 57.27 |
| Intel(R) Core(TM) i9-8950HK CPU @ 2.90GHz [x86 Family 6 Model 158 Stepping 10] | 16 | 12.00 | 4.77 | 57.27 |
| Intel(R) Core(TM) i7-7820HQ CPU @ 2.90GHz [x86 Family 6 Model 158 Stepping 9] | 11 | 8.00 | 4.76 | 38.05 |
| Intel(R) Core(TM) i7-6900K CPU @ 3.20GHz [Family 6 Model 79 Stepping 1] | 10 | 16. 00 00 |
4.75 | 76.02 |
| Intel(R) Xeon(R) CPU E5-1620 v2 @ 3.70GHz [x86 Family 6 Model 62 Stepping 4] | 24 | 7.71 | 4.74 | 36.55 |
| Intel(R) Core(TM) i7-4790K CPU @ 4.00GHz [Family 6 Model 60 Stepping 3] | 232 | 7.88 | 4.73 | 37.31 |
| Intel(R) Core(TM) i5-9400F CPU @ 2.90GHz [Family 6 Model 158 Stepping 10] | 51 | 6.00 | 4.73 | 28.35 |
| Intel(R) Core(TM) i9-9900X CPU @ 3.50GHz [Family 6 Model 85 Stepping 4] | 10 | 19.00 | 4.72 | 89.61 |
| Intel(R) Core(TM) i7-3770 CPU @ 3.40GHz [x86 Family 6 Model 58 Stepping 9] | 29 | 8.00 | 4.70 | 37.63 |
| Intel(R) Core(TM) i5-4690 CPU @ 3.50GHz [Family 6 Model 60 Stepping 3] | 58 | 4.00 | 4.70 | 18.81 |
| Intel(R) Core(TM) i7-6950X CPU @ 3.00GHz [Family 6 Model 79 Stepping 1] | 15 | 20. 00 00 |
4.70 | 94.03 |
| Intel(R) Core(TM) i5-4690K CPU @ 3.50GHz [Family 6 Model 60 Stepping 3] | 62 | 4.00 | 4.70 | 18.80 |
| AMD Ryzen Threadripper 1900X 8-Core Processor [Family 23 Model 1 Stepping 1] | 15 | 15.20 | 4.69 | 71.26 |
| Intel(R) Core(TM) i9-7900X CPU @ 3.30GHz [Family 6 Model 85 Stepping 4] | 22 | 19.55 | 4.68 | 91.50 |
| AMD Ryzen 5 1600X Six-Core Processor [Family 23 Model 1 Stepping 1] | 30 | 12.00 | 4.68 | 56.15 |
| Intel(R) Xeon(R) CPU E5-1650 v2 @ 3.50GHz [x86 Family 6 Model 62 Stepping 4] | 39 | 12.00 | 4.67 | 56.08 |
| AMD Ryzen 3 2200G with Radeon Vega Graphics [Family 23 Model 17 Stepping 0] | 31 | 4.00 | 4.66 | 18.62 |
| Intel(R) Core(TM) i7-6920HQ CPU @ 2.90GHz [x86 Family 6 Model 94 Stepping 3] | 12 | 8. 00 00 |
4.66 | 37.24 |
| AMD Ryzen Threadripper 1920X 12-Core Processor [Family 23 Model 1 Stepping 1] | 23 | 23.09 | 4.64 | 107.19 |
| Intel(R) Core(TM) i5-8400 CPU @ 2.80GHz [Family 6 Model 158 Stepping 10] | 140 | 6.00 | 4.63 | 27.77 |
| Intel(R) Core(TM) i7-6800K CPU @ 3.40GHz [Family 6 Model 79 Stepping 1] | 42 | 11.86 | 4.60 | 54.60 |
| Intel(R) Core(TM) i7-7820X CPU @ 3.60GHz [Family 6 Model 85 Stepping 4] | 32 | 15.75 | 4.60 | 72.47 |
| Intel(R) Core(TM) i5-7500 CPU @ 3.40GHz [Family 6 Model 158 Stepping 9] | 84 | 4.05 | 4.58 | 18.53 |
| Intel(R) Core(TM) i7-6700K CPU @ 4.00GHz [Family 6 Model 94 Stepping 3] | 336 | 7.98 | 4.55 | 36.32 |
| AMD Ryzen 5 2600 Six-Core Processor [Family 23 Model 8 Stepping 2] | 113 | 11. 95 95 |
4.54 | 54.27 |
| AMD Ryzen Threadripper 2990WX 32-Core Processor [Family 23 Model 8 Stepping 2] | 16 | 58.00 | 4.53 | 262.73 |
| AMD Ryzen Threadripper 1950X 16-Core Processor [Family 23 Model 1 Stepping 1] | 88 | 31.48 | 4.53 | 142.50 |
| Intel(R) Core(TM) i5-6600K CPU @ 3.50GHz [Family 6 Model 94 Stepping 3] | 84 | 4.00 | 4.52 | 18.10 |
| Intel(R) Core(TM) i7-7700 CPU @ 3.60GHz [Family 6 Model 158 Stepping 9] | 249 | 7.96 | 4.49 | 35.70 |
| AMD Ryzen 7 1800X Eight-Core Processor [Family 23 Model 1 Stepping 1] | 69 | 16.00 | 4.48 | 71.64 |
| AMD Ryzen 5 2400G with Radeon Vega Graphics [Family 23 Model 17 Stepping 0] | 41 | 7.98 | 4.46 | 35.58 |
| Intel(R) Core(TM) i5-3570K CPU @ 3.40GHz [Family 6 Model 58 Stepping 9] | 85 | 4. 00 00 |
4.46 | 17.84 |
| Intel(R) Xeon(R) CPU X5690 @ 3.47GHz [x86 Family 6 Model 44 Stepping 2] | 11 | 18.55 | 4.45 | 82.59 |
| Intel(R) Core(TM) i5-4670K CPU @ 3.40GHz [Family 6 Model 60 Stepping 3] | 28 | 4.00 | 4.44 | 17.76 |
| Intel(R) Xeon(R) CPU E5-1680 v2 @ 3.00GHz [x86 Family 6 Model 62 Stepping 4] | 10 | 16.00 | 4.43 | 70.87 |
| Intel(R) Core(TM) i3-7100 CPU @ 3.90GHz [Family 6 Model 158 Stepping 9] | 22 | 4.00 | 4.42 | 17.70 |
| Intel(R) Xeon(R) CPU E3-1241 v3 @ 3.50GHz [Family 6 Model 60 Stepping 3] | 10 | 7.60 | 4.41 | 33.51 |
| Intel(R) Core(TM) i3-8100 CPU @ 3.60GHz [Family 6 Model 158 Stepping 11] | 36 | 4.00 | 4.39 | 17.55 |
| Intel(R) Core(TM) i5-3570 CPU @ 3.40GHz [Family 6 Model 58 Stepping 9] | 44 | 4. 00 00 |
4.34 | 17.38 |
| AMD Ryzen 7 1700X Eight-Core Processor [Family 23 Model 1 Stepping 1] | 73 | 16.00 | 4.33 | 69.26 |
| Intel(R) Xeon(R) CPU E3-1230 v5 @ 3.40GHz [Family 6 Model 94 Stepping 3] | 13 | 8.00 | 4.31 | 34.49 |
| Intel(R) Core(TM) i5-4670 CPU @ 3.40GHz [Family 6 Model 60 Stepping 3] | 29 | 4.00 | 4.30 | 17.21 |
| Intel(R) Core(TM) i5-4570R CPU @ 2.70GHz [x86 Family 6 Model 70 Stepping 1] | 31 | 4.00 | 4.27 | 17.10 |
| Intel(R) Core(TM) i5-6600 CPU @ 3.30GHz [Family 6 Model 94 Stepping 3] | 48 | 4.00 | 4.27 | 17.08 |
| Intel(R) Xeon(R) CPU W3680 @ 3.33GHz [x86 Family 6 Model 44 Stepping 2] | 11 | 12.00 | 4.27 | 51.21 |
| AMD Ryzen 5 1500X Quad-Core Processor [Family 23 Model 1 Stepping 1] | 10 | 8. 00 00 |
4.27 | 34.13 |
| Intel(R) Core(TM) i5-4590 CPU @ 3.30GHz [Family 6 Model 60 Stepping 3] | 78 | 4.00 | 4.25 | 17.01 |
| Intel(R) Core(TM) i7-5930K CPU @ 3.50GHz [Family 6 Model 63 Stepping 2] | 62 | 11.90 | 4.24 | 50.44 |
| AMD Ryzen 3 1200 Quad-Core Processor [Family 23 Model 1 Stepping 1] | 18 | 4.00 | 4.23 | 16.92 |
| Intel(R) Core(TM) i7-4771 CPU @ 3.50GHz [Family 6 Model 60 Stepping 3] | 13 | 7.54 | 4.22 | 31.79 |
| Intel(R) Core(TM) i7-4770K CPU @ 3.50GHz [Family 6 Model 60 Stepping 3] | 134 | 7.91 | 4.21 | 33.33 |
| Intel(R) Core(TM) i7-2600 CPU @ 3.40GHz [x86 Family 6 Model 42 Stepping 7] | 17 | 8.00 | 4.20 | 33.63 |
| Intel(R) Core(TM) i7-4790 CPU @ 3.60GHz [Family 6 Model 60 Stepping 3] | 269 | 7. 95 95 |
4.20 | 33.38 |
| AMD Ryzen 7 2700 Eight-Core Processor [Family 23 Model 8 Stepping 2] | 89 | 16.00 | 4.20 | 67.16 |
| Intel(R) Xeon(R) CPU E3-1231 v3 @ 3.40GHz [Family 6 Model 60 Stepping 3] | 14 | 8.00 | 4.18 | 33.47 |
| Intel(R) Core(TM) i5-4570 CPU @ 3.20GHz [Family 6 Model 60 Stepping 3] | 86 | 4.00 | 4.18 | 16.71 |
| Intel(R) Core(TM) i7-3770K CPU @ 3.50GHz [Family 6 Model 58 Stepping 9] | 152 | 7.97 | 4.17 | 33.26 |
| Intel(R) Core(TM) i7-6700 CPU @ 3.40GHz [Family 6 Model 94 Stepping 3] | 344 | 8.53 | 4.16 | 35.48 |
| AMD Ryzen 5 1600 Six-Core Processor [Family 23 Model 1 Stepping 1] | 77 | 11.95 | 4.15 | 49.60 |
| Intel(R) Core(TM) i5-8500T CPU @ 2.10GHz [Family 6 Model 158 Stepping 10] | 13 | 6. 00 00 |
4.14 | 24.86 |
| Intel(R) Core(TM) i3-6100 CPU @ 3.70GHz [Family 6 Model 94 Stepping 3] | 26 | 4.00 | 4.13 | 16.51 |
| Intel(R) Core(TM) i3-4170 CPU @ 3.70GHz [Family 6 Model 60 Stepping 3] | 11 | 4.00 | 4.12 | 16.49 |
| Intel(R) Core(TM) i5-2500K CPU @ 3.30GHz [Family 6 Model 42 Stepping 7] | 47 | 4.00 | 4.12 | 16.46 |
| Intel(R) Core(TM) i7-4770 CPU @ 3.40GHz [Family 6 Model 60 Stepping 3] | 206 | 7.96 | 4.11 | 32.73 |
| Intel(R) Xeon(R) W-2123 CPU @ 3.60GHz [Family 6 Model 85 Stepping 4] | 11 | 8.00 | 4.11 | 32.91 |
| Intel(R) Core(TM) i7-9750H CPU @ 2.60GHz [Family 6 Model 158 Stepping 10] | 58 | 12.00 | 4.11 | 49.34 |
| Intel(R) Core(TM) i5-6500 CPU @ 3.20GHz [Family 6 Model 94 Stepping 3] | 155 | 3. 99 99 |
4.11 | 16.38 |
| Intel(R) Core(TM) i5-3470 CPU @ 3.20GHz [Family 6 Model 58 Stepping 9] | 119 | 4.00 | 4.11 | 16.43 |
| Intel(R) Core(TM) i7-3960X CPU @ 3.30GHz [Family 6 Model 45 Stepping 7] | 11 | 11.45 | 4.09 | 46.84 |
| Intel(R) Core(TM) i5-4278U CPU @ 2.60GHz [x86 Family 6 Model 69 Stepping 1] | 16 | 4.00 | 4.07 | 16.28 |
| Intel(R) Core(TM) i5-3550 CPU @ 3.30GHz [Family 6 Model 58 Stepping 9] | 16 | 4.00 | 4.07 | 16.27 |
| Intel(R) Core(TM) i7-4930K CPU @ 3.40GHz [Family 6 Model 62 Stepping 4] | 35 | 11.66 | 4.05 | 47.22 |
| Intel(R) Core(TM) i7-3770 CPU @ 3.40GHz [Family 6 Model 58 Stepping 9] | 267 | 7.87 | 4.05 | 31.84 |
| Intel(R) Core(TM) i7-4820K CPU @ 3.70GHz [Family 6 Model 62 Stepping 4] | 20 | 8. 00 00 |
4.04 | 32.30 |
| Intel(R) Xeon(R) CPU E3-1245 v3 @ 3.40GHz [Family 6 Model 60 Stepping 3] | 13 | 8.00 | 4.03 | 32.27 |
| Intel(R) Core(TM) i5-3570S CPU @ 3.10GHz [Family 6 Model 58 Stepping 9] | 13 | 4.00 | 4.03 | 16.11 |
| Intel(R) Xeon(R) CPU E3-1230 v3 @ 3.30GHz [Family 6 Model 60 Stepping 3] | 13 | 7.69 | 4.02 | 30.94 |
| Intel(R) Pentium(R) CPU G3258 @ 3.20GHz [Family 6 Model 60 Stepping 3] | 11 | 2.00 | 4.02 | 8.04 |
| Intel(R) Core(TM) i5-8300H CPU @ 2.30GHz [Family 6 Model 158 Stepping 10] | 13 | 8.00 | 4.02 | 32.13 |
| Intel(R) Xeon(R) CPU E5-1650 v3 @ 3.50GHz [Family 6 Model 63 Stepping 2] | 21 | 11.71 | 4.01 | 47.01 |
| Intel(R) Core(TM) i7-7700T CPU @ 2.90GHz [Family 6 Model 158 Stepping 9] | 10 | 8. 00 00 |
4.01 | 32.09 |
| Intel(R) Core(TM) i3-4160 CPU @ 3.60GHz [Family 6 Model 60 Stepping 3] | 14 | 4.00 | 4.01 | 16.03 |
| Intel(R) Core(TM) i7-5820K CPU @ 3.30GHz [Family 6 Model 63 Stepping 2] | 127 | 11.95 | 4.00 | 47.86 |
| Intel(R) Xeon(R) CPU E5-1620 v3 @ 3.50GHz [Family 6 Model 63 Stepping 2] | 18 | 8.00 | 4.00 | 32.01 |
| Intel(R) Core(TM) i5-2500S CPU @ 2.70GHz [x86 Family 6 Model 42 Stepping 7] | 22 | 4.00 | 3.99 | 15.95 |
| Intel(R) Core(TM) i5-2500 CPU @ 3.30GHz [Family 6 Model 42 Stepping 7] | 42 | 4.00 | 3.98 | 15.91 |
| Intel(R) Core(TM) i5-7400 CPU @ 3.00GHz [Family 6 Model 158 Stepping 9] | 88 | 4.00 | 3.98 | 15.91 |
| Intel(R) Core(TM) i3-4150 CPU @ 3.50GHz [Family 6 Model 60 Stepping 3] | 10 | 4. 00 00 |
3.97 | 15.90 |
| AMD Ryzen 7 1700 Eight-Core Processor [Family 23 Model 1 Stepping 1] | 123 | 15.94 | 3.97 | 63.35 |
| Intel(R) Core(TM) i7-5960X CPU @ 3.00GHz [Family 6 Model 63 Stepping 2] | 42 | 16.00 | 3.97 | 63.55 |
| Intel(R) Core(TM) i5-3450 CPU @ 3.10GHz [Family 6 Model 58 Stepping 9] | 22 | 4.00 | 3.96 | 15.85 |
| Intel(R) Core(TM) i7-8750H CPU @ 2.20GHz [Family 6 Model 158 Stepping 10] | 108 | 12.00 | 3.96 | 47.50 |
| Intel(R) Core(TM) i9-7980XE CPU @ 2.60GHz [Family 6 Model 85 Stepping 4] | 12 | 35.67 | 3.94 | 140.43 |
| Intel(R) Xeon(R) CPU E5-1650 v2 @ 3.50GHz [Family 6 Model 62 Stepping 4] | 15 | 11.60 | 3.94 | 45.67 |
| Intel(R) Xeon(R) CPU W3565 @ 3.20GHz [x86 Family 6 Model 26 Stepping 5] | 10 | 8. 00 00 |
3.93 | 31.47 |
| Intel(R) Xeon(R) CPU E5-2697 v2 @ 2.70GHz [x86 Family 6 Model 62 Stepping 4] | 13 | 24.00 | 3.92 | 94.13 |
| Intel(R) Core(TM) i7-3615QM CPU @ 2.30GHz [x86 Family 6 Model 58 Stepping 9] | 14 | 8.00 | 3.92 | 31.37 |
| Intel(R) Pentium(R) CPU G4400 @ 3.30GHz [Family 6 Model 94 Stepping 3] | 10 | 2.00 | 3.92 | 7.84 |
| Intel(R) Xeon(R) CPU E5-1620 0 @ 3.60GHz [Family 6 Model 45 Stepping 7] | 24 | 7.83 | 3.92 | 30.68 |
| Intel(R) Core(TM) i5-4570S CPU @ 2.90GHz [Family 6 Model 60 Stepping 3] | 13 | 4.00 | 3.90 | 15.62 |
| Intel(R) Core(TM) i5-4460 CPU @ 3.20GHz [Family 6 Model 60 Stepping 3] | 80 | 6.95 | 3.90 | 27.12 |
| Intel(R) Core(TM) i7-4770S CPU @ 3.10GHz [Family 6 Model 60 Stepping 3] | 13 | 8. 00 00 |
3.89 | 31.12 |
| Intel(R) Core(TM) i7-4770HQ CPU @ 2.20GHz [x86 Family 6 Model 70 Stepping 1] | 11 | 8.00 | 3.89 | 31.10 |
| Intel(R) Core(TM) i7-2600K CPU @ 3.40GHz [Family 6 Model 42 Stepping 7] | 108 | 8.15 | 3.89 | 31.68 |
| AMD Ryzen 5 1400 Quad-Core Processor [Family 23 Model 1 Stepping 1] | 21 | 8.00 | 3.88 | 31.05 |
| Intel(R) Xeon(R) CPU E3-1230 V2 @ 3.30GHz [Family 6 Model 58 Stepping 9] | 17 | 7.53 | 3.87 | 29.13 |
| Intel(R) Core(TM) i7-7820HK CPU @ 2.90GHz [Family 6 Model 158 Stepping 9] | 12 | 8.00 | 3.86 | 30.88 |
| Intel(R) Core(TM) i5-3470S CPU @ 2.90GHz [Family 6 Model 58 Stepping 9] | 23 | 3.91 | 3.86 | 15.09 |
| Intel(R) Xeon(R) CPU E5-2698 v3 @ 2.30GHz [Family 6 Model 63 Stepping 0] | 16 | 16. 00 00 |
3.85 | 61.57 |
| Intel(R) Pentium(R) CPU G4560 @ 3.50GHz [Family 6 Model 158 Stepping 9] | 13 | 4.00 | 3.83 | 15.32 |
| Intel(R) Core(TM) i7-3820 CPU @ 3.60GHz [Family 6 Model 45 Stepping 7] | 43 | 7.81 | 3.83 | 29.91 |
| Intel(R) Xeon(R) CPU E5-1650 0 @ 3.20GHz [Family 6 Model 45 Stepping 7] | 10 | 10.00 | 3.81 | 38.12 |
| Intel(R) Core(TM) i7-2700K CPU @ 3.50GHz [Family 6 Model 42 Stepping 7] | 32 | 7.88 | 3.79 | 29.86 |
| Intel(R) Core(TM) i7-7500U CPU @ 2.70GHz [Family 6 Model 142 Stepping 9] | 21 | 4.00 | 3.79 | 15.16 |
| Intel(R) Xeon(R) CPU E5-1620 v2 @ 3.70GHz [Family 6 Model 62 Stepping 4] | 17 | 8.00 | 3.79 | 30.28 |
| Intel(R) Core(TM) i7-3770S CPU @ 3.10GHz [Family 6 Model 58 Stepping 9] | 18 | 8. 00 00 |
3.78 | 30.24 |
| Intel(R) Core(TM) i7-3930K CPU @ 3.20GHz [Family 6 Model 45 Stepping 7] | 79 | 11.92 | 3.78 | 45.07 |
| Intel(R) Core(TM) i3-4130 CPU @ 3.40GHz [Family 6 Model 60 Stepping 3] | 33 | 4.00 | 3.75 | 15.02 |
| Intel(R) Core(TM) i5-2400 CPU @ 3.10GHz [Family 6 Model 42 Stepping 7] | 107 | 4.00 | 3.74 | 14.96 |
| Intel(R) Core(TM) i5-4430 CPU @ 3.00GHz [Family 6 Model 60 Stepping 3] | 18 | 4.00 | 3.74 | 14.95 |
| Intel(R) Xeon(R) CPU X5690 @ 3.47GHz [Family 6 Model 44 Stepping 2] | 19 | 15.58 | 3.73 | 58.11 |
| Intel(R) Core(TM) i5-4440 CPU @ 3.10GHz [Family 6 Model 60 Stepping 3] | 38 | 4.00 | 3.73 | 14.91 |
| Intel(R) Core(TM) i5-4460S CPU @ 2.90GHz [Family 6 Model 60 Stepping 3] | 12 | 4. 00 00 |
3.71 | 14.86 |
| Intel(R) Core(TM) i5-6400 CPU @ 2.70GHz [Family 6 Model 94 Stepping 3] | 78 | 4.00 | 3.69 | 14.76 |
| Intel(R) Core(TM) i7-2600 CPU @ 3.40GHz [Family 6 Model 42 Stepping 7] | 144 | 7.97 | 3.69 | 29.41 |
| Intel(R) Core(TM) i5-3350P CPU @ 3.10GHz [Family 6 Model 58 Stepping 9] | 20 | 4.00 | 3.68 | 14.71 |
| Intel(R) Core(TM) i5-3330 CPU @ 3.00GHz [Family 6 Model 58 Stepping 9] | 21 | 4.00 | 3.68 | 14.71 |
| Intel(R) Core(TM) i7-6700T CPU @ 2.80GHz [Family 6 Model 94 Stepping 3] | 24 | 8.00 | 3.68 | 29.41 |
| Intel(R) Core(TM) i7-7700HQ CPU @ 2.80GHz [Family 6 Model 158 Stepping 9] | 80 | 8.00 | 3.68 | 29.41 |
| Intel(R) Core(TM) i3-3240 CPU @ 3.40GHz [Family 6 Model 58 Stepping 9] | 18 | 4. 00 00 |
3.67 | 14.70 |
| Intel(R) Core(TM) i5-7300HQ CPU @ 2.50GHz [Family 6 Model 158 Stepping 9] | 14 | 4.00 | 3.67 | 14.68 |
| Intel(R) Xeon(R) CPU X5680 @ 3.33GHz [Family 6 Model 44 Stepping 2] | 13 | 15.69 | 3.65 | 57.35 |
| Intel(R) Core(TM) i7-4720HQ CPU @ 2.60GHz [Family 6 Model 60 Stepping 3] | 12 | 8.00 | 3.64 | 29.09 |
| Intel(R) Xeon(R) CPU E5-2643 0 @ 3.30GHz [Family 6 Model 45 Stepping 7] | 11 | 12.36 | 3.61 | 44.58 |
| Intel(R) Core(TM) i5-2400S CPU @ 2.50GHz [x86 Family 6 Model 42 Stepping 7] | 19 | 4.00 | 3.60 | 14.41 |
| AMD FX(tm)-9590 Eight-Core Processor [Family 21 Model 2 Stepping 0] | 15 | 8.00 | 3.60 | 28.79 |
| Intel(R) Core(TM) i3-3220 CPU @ 3.30GHz [Family 6 Model 58 Stepping 9] | 25 | 4. 00 00 |
3.60 | 14.38 |
| Intel(R) Core(TM) i7 CPU X 980 @ 3.33GHz [Family 6 Model 44 Stepping 2] | 19 | 12.00 | 3.58 | 42.98 |
| Intel(R) Core(TM) i7-4710HQ CPU @ 2.50GHz [Family 6 Model 60 Stepping 3] | 13 | 8.00 | 3.56 | 28.50 |
| Intel(R) Core(TM) i5 CPU 760 @ 2.80GHz [Family 6 Model 30 Stepping 5] | 14 | 4.00 | 3.56 | 14.25 |
| Intel(R) Core(TM) i5-2320 CPU @ 3.00GHz [Family 6 Model 42 Stepping 7] | 22 | 3.91 | 3.55 | 13.89 |
| Intel(R) Core(TM) i7-8850H CPU @ 2.60GHz [Family 6 Model 158 Stepping 10] | 11 | 11.09 | 3.52 | 38.99 |
| Intel(R) Xeon(R) CPU E5-2680 v2 @ 2.80GHz [Family 6 Model 62 Stepping 4] | 25 | 27.60 | 3.50 | 96.74 |
| Intel(R) Core(TM) i7-4800MQ CPU @ 2.70GHz [Family 6 Model 60 Stepping 3] | 13 | 8. 00 00 |
3.50 | 28.04 |
| Intel(R) Core(TM) i7-6820HQ CPU @ 2.70GHz [Family 6 Model 94 Stepping 3] | 17 | 8.00 | 3.50 | 27.97 |
| Intel(R) Core(TM) i5-2300 CPU @ 2.80GHz [Family 6 Model 42 Stepping 7] | 16 | 4.00 | 3.48 | 13.92 |
| Intel(R) Xeon(R) CPU E5462 @ 2.80GHz [x86 Family 6 Model 23 Stepping 6] | 13 | 7.69 | 3.46 | 26.65 |
| Intel(R) Core(TM) i7-5500U CPU @ 2.40GHz [Family 6 Model 61 Stepping 4] | 12 | 4.00 | 3.45 | 13.81 |
| Intel(R) Core(TM) i5 CPU 650 @ 3.20GHz [Family 6 Model 37 Stepping 5] | 12 | 4.00 | 3.45 | 13.81 |
| Intel(R) Core(TM) i7-6600U CPU @ 2.60GHz [Family 6 Model 78 Stepping 3] | 12 | 4.00 | 3.45 | 13.80 |
| Intel(R) Xeon(R) CPU X5675 @ 3.07GHz [Family 6 Model 44 Stepping 2] | 30 | 16. 90 90 |
3.44 | 58.16 |
| Intel(R) Core(TM)2 Duo CPU E8400 @ 3.00GHz [Family 6 Model 23 Stepping 10] | 28 | 1.96 | 3.42 | 6.71 |
| Intel(R) Core(TM) i7-4700HQ CPU @ 2.40GHz [Family 6 Model 60 Stepping 3] | 12 | 8.00 | 3.41 | 27.28 |
| Intel(R) Core(TM) i5-7200U CPU @ 2.50GHz [Family 6 Model 142 Stepping 9] | 31 | 4.00 | 3.40 | 13.61 |
| Intel(R) Core(TM) i3-2120 CPU @ 3.30GHz [Family 6 Model 42 Stepping 7] | 37 | 4.00 | 3.40 | 13.61 |
| Intel(R) Core(TM)2 Quad CPU Q9650 @ 3.00GHz [Family 6 Model 23 Stepping 10] | 15 | 4.00 | 3.40 | 13.61 |
| Intel(R) Core(TM) i7 CPU 960 @ 3.20GHz [Family 6 Model 26 Stepping 5] | 17 | 8.00 | 3.39 | 27.09 |
| Intel(R) Xeon(R) CPU X5570 @ 2.93GHz [Family 6 Model 26 Stepping 5] | 13 | 10. 15 15 |
3.38 | 34.31 |
| Intel(R) Core(TM) i5 CPU 650 @ 3.20GHz [Family 6 Model 37 Stepping 2] | 12 | 4.00 | 3.37 | 13.50 |
| Intel(R) Core(TM) i5 CPU 750 @ 2.67GHz [Family 6 Model 30 Stepping 5] | 19 | 4.00 | 3.37 | 13.49 |
| Intel(R) Core(TM) i5-6300HQ CPU @ 2.30GHz [Family 6 Model 94 Stepping 3] | 10 | 4.00 | 3.37 | 13.49 |
| Intel(R) Core(TM) i7-8650U CPU @ 1.90GHz [Family 6 Model 142 Stepping 10] | 11 | 8.00 | 3.33 | 26.63 |
| Intel(R) Core(TM) i7-3610QM CPU @ 2.30GHz [Family 6 Model 58 Stepping 9] | 16 | 8.00 | 3.33 | 26.60 |
| Intel(R) Xeon(R) CPU E5-2680 0 @ 2.70GHz [Family 6 Model 45 Stepping 7] | 17 | 29.18 | 3.31 | 96.49 |
| Intel(R) Core(TM) i7 CPU 950 @ 3.07GHz [Family 6 Model 26 Stepping 5] | 25 | 8. 00 00 |
3.30 | 26.40 |
| Intel(R) Core(TM) i7-6500U CPU @ 2.50GHz [Family 6 Model 78 Stepping 3] | 20 | 4.00 | 3.30 | 13.19 |
| Intel(R) Core(TM) i7-6700HQ CPU @ 2.60GHz [Family 6 Model 94 Stepping 3] | 78 | 8.00 | 3.30 | 26.37 |
| Intel(R) Core(TM)2 Duo CPU E7500 @ 2.93GHz [Family 6 Model 23 Stepping 10] | 11 | 2.00 | 3.27 | 6.55 |
| Intel(R) Core(TM) i7-6820HK CPU @ 2.70GHz [Family 6 Model 94 Stepping 3] | 16 | 8.00 | 3.27 | 26.18 |
| Intel(R) Core(TM) i7 CPU 870 @ 2.93GHz [Family 6 Model 30 Stepping 5] | 30 | 8.00 | 3.27 | 26.17 |
| Intel(R) Xeon(R) CPU E5-2670 0 @ 2.60GHz [Family 6 Model 45 Stepping 7] | 26 | 28.92 | 3.27 | 94.59 |
| AMD FX-8370 Eight-Core Processor [Family 21 Model 2 Stepping 0] | 17 | 8. 00 00 |
3.27 | 26.16 |
| Intel(R) Xeon(R) CPU X5670 @ 2.93GHz [Family 6 Model 44 Stepping 2] | 26 | 21.54 | 3.26 | 70.30 |
| Intel(R) Core(TM)2 Quad CPU Q9550 @ 2.83GHz [Family 6 Model 23 Stepping 10] | 29 | 4.00 | 3.26 | 13.04 |
| Intel(R) Core(TM) i7-8550U CPU @ 1.80GHz [Family 6 Model 142 Stepping 10] | 53 | 7.87 | 3.26 | 25.64 |
| Intel(R) Xeon(R) CPU E5-2640 v3 @ 2.60GHz [Family 6 Model 63 Stepping 2] | 10 | 22.40 | 3.25 | 72.86 |
| Intel(R) Core(TM) i5-3230M CPU @ 2.60GHz [Family 6 Model 58 Stepping 9] | 10 | 4.00 | 3.24 | 12.94 |
| AMD FX(tm)-8350 Eight-Core Processor [Family 21 Model 2 Stepping 0] | 173 | 7.98 | 3.23 | 25.80 |
| AMD Phenom(tm) II X4 965 Processor [Family 16 Model 4 Stepping 3] | 20 | 3. 95 95 |
3.22 | 12.73 |
| Intel(R) Xeon(R) CPU E5-2630 v4 @ 2.20GHz [Family 6 Model 79 Stepping 1] | 12 | 30.00 | 3.21 | 96.34 |
| Intel(R) Core(TM) i3-2100 CPU @ 3.10GHz [Family 6 Model 42 Stepping 7] | 26 | 3.92 | 3.20 | 12.54 |
| Intel(R) Xeon(R) CPU E5-2620 v4 @ 2.10GHz [Family 6 Model 79 Stepping 1] | 32 | 22.75 | 3.16 | 71.99 |
| Intel(R) Core(TM) i7-3630QM CPU @ 2.40GHz [Family 6 Model 58 Stepping 9] | 16 | 8.00 | 3.16 | 25.29 |
| AMD Phenom(tm) II X6 1090T Processor [Family 16 Model 10 Stepping 0] | 41 | 6.00 | 3.16 | 18.97 |
| Intel(R) Core(TM) i5-5200U CPU @ 2.20GHz [Family 6 Model 61 Stepping 4] | 22 | 4.00 | 3.14 | 12.55 |
| Intel(R) Core(TM) i5-6500T CPU @ 2.50GHz [Family 6 Model 94 Stepping 3] | 13 | 4. 00 00 |
3.11 | 12.43 |
| Intel(R) Core(TM) i5-8250U CPU @ 1.60GHz [Family 6 Model 142 Stepping 10] | 36 | 7.83 | 3.10 | 24.26 |
| Intel(R) Xeon(R) CPU X5650 @ 2.67GHz [Family 6 Model 44 Stepping 2] | 41 | 18.10 | 3.10 | 56.02 |
| Intel(R) Core(TM) i5-2520M CPU @ 2.50GHz [Family 6 Model 42 Stepping 7] | 13 | 3.92 | 3.08 | 12.10 |
| AMD FX(tm)-4300 Quad-Core Processor [Family 21 Model 2 Stepping 0] | 14 | 4.00 | 3.08 | 12.31 |
| AMD Phenom(tm) II X6 1100T Processor [Family 16 Model 10 Stepping 0] | 22 | 5.95 | 3.07 | 18.27 |
| AMD Phenom(tm) II X4 955 Processor [Family 16 Model 4 Stepping 3] | 11 | 4.00 | 3.07 | 12.27 |
| Intel(R) Xeon(R) CPU E5-2690 0 @ 2.90GHz [Family 6 Model 45 Stepping 7] | 13 | 22..png) 62 62 |
3.05 | 68.87 |
| Intel(R) Core(TM)2 Quad CPU Q8400 @ 2.66GHz [Family 6 Model 23 Stepping 10] | 11 | 4.00 | 3.04 | 12.16 |
| Intel(R) Core(TM)2 Quad CPU Q9400 @ 2.66GHz [Family 6 Model 23 Stepping 10] | 18 | 4.00 | 3.04 | 12.15 |
| Intel(R) Core(TM) i7-4700MQ CPU @ 2.40GHz [Family 6 Model 60 Stepping 3] | 25 | 8.00 | 3.01 | 24.11 |
| Intel(R) Core(TM) i7 CPU 860 @ 2.80GHz [Family 6 Model 30 Stepping 5] | 30 | 8.00 | 3.01 | 24.05 |
| Intel(R) Xeon(R) CPU X5660 @ 2.80GHz [Family 6 Model 44 Stepping 2] | 28 | 23.14 | 3.00 | 69.43 |
| Intel(R) Xeon(R) CPU E5620 @ 2.40GHz [x86 Family 6 Model 44 Stepping 2] | 16 | 16.00 | 2.96 | 47.40 |
| Intel(R) Xeon(R) CPU E7-4830 v2 @ 2.20GHz [Family 6 Model 62 Stepping 7] | 11 | 10. 91 91 |
2.94 | 32.09 |
| Intel(R) Xeon(R) CPU E5-2630 v3 @ 2.40GHz [Family 6 Model 63 Stepping 2] | 25 | 25.28 | 2.93 | 74.13 |
| Intel(R) Core(TM) i5-6200U CPU @ 2.30GHz [Family 6 Model 78 Stepping 3] | 17 | 3.88 | 2.93 | 11.37 |
| Intel(R) Core(TM) i7 CPU 930 @ 2.80GHz [Family 6 Model 26 Stepping 5] | 28 | 7.86 | 2.93 | 22.98 |
| Intel(R) Xeon(R) CPU E5-2640 0 @ 2.50GHz [Family 6 Model 45 Stepping 7] | 13 | 15.54 | 2.91 | 45.22 |
| AMD FX(tm)-8320 Eight-Core Processor [Family 21 Model 2 Stepping 0] | 59 | 8.00 | 2.91 | 23.24 |
| Intel(R) Core(TM) i7 CPU 920 @ 2.67GHz [Family 6 Model 26 Stepping 4] | 23 | 7.65 | 2.89 | 22.15 |
| Intel(R) Xeon(R) CPU E5-2620 v3 @ 2.40GHz [Family 6 Model 63 Stepping 2] | 29 | 15. 86 86 |
2.87 | 45.59 |
| AMD FX(tm)-8150 Eight-Core Processor [Family 21 Model 1 Stepping 2] | 17 | 8.00 | 2.86 | 22.87 |
| Intel(R) Core(TM) i7 CPU 920 @ 2.67GHz [Family 6 Model 26 Stepping 5] | 38 | 8.00 | 2.86 | 22.85 |
| Intel(R) Xeon(R) CPU E5520 @ 2.27GHz [x86 Family 6 Model 26 Stepping 5] | 14 | 16.00 | 2.84 | 45.43 |
| AMD FX(tm)-6300 Six-Core Processor [Family 21 Model 2 Stepping 0] | 67 | 6.00 | 2.83 | 17.00 |
| Intel(R) Core(TM) i5-3210M CPU @ 2.50GHz [Family 6 Model 58 Stepping 9] | 12 | 4.00 | 2.79 | 11.16 |
| Intel(R) Core(TM) i5-2400S CPU @ 2.50GHz [Family 6 Model 42 Stepping 7] | 12 | 3.83 | 2.79 | 10.68 |
| Intel(R) Core(TM) i5-6300U CPU @ 2.40GHz [Family 6 Model 78 Stepping 3] | 17 | 4. 00 00 |
2.79 | 11.14 |
| Intel(R) Xeon(R) CPU E5530 @ 2.40GHz [Family 6 Model 26 Stepping 5] | 12 | 10.67 | 2.78 | 29.64 |
| Intel(R) Xeon(R) Silver 4110 CPU @ 2.10GHz [Family 6 Model 85 Stepping 4] | 13 | 25.23 | 2.78 | 70.10 |
| AMD FX(tm)-8300 Eight-Core Processor [Family 21 Model 2 Stepping 0] | 23 | 8.00 | 2.76 | 22.12 |
| Intel(R) Core(TM) i7-2670QM CPU @ 2.20GHz [Family 6 Model 42 Stepping 7] | 12 | 8.00 | 2.76 | 22.10 |
| Intel(R) Xeon(R) CPU E5-2609 0 @ 2.40GHz [Family 6 Model 45 Stepping 7] | 10 | 7.60 | 2.75 | 20.87 |
| AMD FX(tm)-4100 Quad-Core Processor [Family 21 Model 1 Stepping 2] | 11 | 4.00 | 2.72 | 10.90 |
| Intel(R) Core(TM) i7-3632QM CPU @ 2.20GHz [Family 6 Model 58 Stepping 9] | 10 | 8. 00 00 |
2.72 | 21.77 |
| AMD Phenom(tm) II X6 1055T Processor [Family 16 Model 10 Stepping 0] | 16 | 6.00 | 2.67 | 16.03 |
| Intel(R) Xeon(R) CPU E5620 @ 2.40GHz [Family 6 Model 44 Stepping 2] | 25 | 11.84 | 2.66 | 31.53 |
| Intel(R) Xeon(R) CPU E5645 @ 2.40GHz [Family 6 Model 44 Stepping 2] | 13 | 19.38 | 2.66 | 51.52 |
| AMD FX-8320E Eight-Core Processor [Family 21 Model 2 Stepping 0] | 19 | 8.00 | 2.59 | 20.75 |
| AMD Phenom(tm) II X6 1045T Processor [Family 16 Model 10 Stepping 0] | 13 | 6.00 | 2.59 | 15.56 |
| AMD FX(tm)-6100 Six-Core Processor [Family 21 Model 1 Stepping 2] | 11 | 6.00 | 2.57 | 15.44 |
| Intel(R) Xeon(R) CPU E5-2650 0 @ 2.00GHz [Family 6 Model 45 Stepping 7] | 12 | 25.33 | 2. 52 52 |
63.81 |
| Intel(R) Xeon(R) CPU E5520 @ 2.27GHz [Family 6 Model 26 Stepping 5] | 12 | 14.00 | 2.49 | 34.90 |
| Intel(R) Core(TM) i5-4200U CPU @ 1.60GHz [Family 6 Model 69 Stepping 1] | 13 | 4.00 | 2.49 | 9.94 |
| Intel(R) Core(TM) i5-4210U CPU @ 1.70GHz [Family 6 Model 69 Stepping 1] | 19 | 4.00 | 2.46 | 9.83 |
| Intel(R) Core(TM)2 Quad CPU Q6600 @ 2.40GHz [Family 6 Model 15 Stepping 11] | 30 | 4.00 | 2.44 | 9.76 |
| Intel(R) Xeon(R) CPU E5-2620 0 @ 2.00GHz [Family 6 Model 45 Stepping 7] | 33 | 21.58 | 2.44 | 52.56 |
| AMD FX(tm)-8120 Eight-Core Processor [Family 21 Model 1 Stepping 2] | 15 | 8.00 | 2.38 | 19.05 |
| Intel(R) Xeon(R) CPU E5620 @ 2.40GHz [Family 6 Model 44 Stepping 2] | 22 | 14. 91 91 |
2.19 | 32.66 |
| ARMv7 Processor rev 3 (v7l) [Impl 0x41 Arch 7 Variant 0x0 Part 0xd08 Rev 3] | 31 | 4.00 | 2.09 | 8.36 |
| Intel(R) Xeon(R) CPU L5520 @ 2.27GHz [Family 6 Model 26 Stepping 5] | 15 | 9.60 | 2.03 | 19.53 |
| ARMv7 Processor rev 4 (v7l) [Impl 0x41 Arch 7 Variant 0x0 Part 0xd03 Rev 4] | 13 | 4.00 | 1.14 | 4.57 |
| ARMv7 Processor rev 4 (v7l) | 47 | 4.00 | 0.99 | 3.97 |
| 15 | 4.27 | 0.77 | 3.28 | |
| ARMv7 Processor rev 5 (v7l) [Impl 0x41 Arch 7 Variant 0x0 Part 0xc07 Rev 5] | 11 | 4.00 | 0.66 | 2.63 |
| Total | 12,317 computers | 502.22 TeraFLOPS |
Generated 24 Sep 2022, 1:53:59 UTC
©2022 University of California
SETI@home and Astropulse are funded by grants from the National Science Foundation, NASA, and donations from SETI@home volunteers. AstroPulse is funded in part by the NSF through grant AST-0307956.
CPU performance
This table shows peak CPU speed
(based on Whetstone benchmarks)
of computers participating in this project.
| CPU model | Number of computers | Avg. cores/computer | GFLOPS/core | GFLOPs/computer |
|---|---|---|---|---|
| [Impl 0x41 Arch 8 Variant 0x3 Part 0xd0c Rev 1] | 10 | 3.20 | 6.96 | 22.26 |
| Intel(R) Core(TM) i9-9900K CPU @ 3.60GHz [x86 Family 6 Model 158 Stepping 13] | 13 | 16.00 | 6.39 | 102.26 |
| AMD Ryzen 7 5800X 8-Core Processor [Family 25 Model 33 Stepping 2] | 12 | 15.33 | 6.25 | 95.85 |
| Intel(R) Core(TM) i7-7700K CPU @ 4.20GHz [x86 Family 6 Model 158 Stepping 9] | 18 | 8.00 | 6.20 | 49.60 |
Intel(R) Core(TM) i9-9900K CPU @ 3. 60GHz [x86 Family 6 Model 158 Stepping 12] 60GHz [x86 Family 6 Model 158 Stepping 12] |
11 | 16.00 | 6.20 | 99.18 |
| 12th Gen Intel(R) Core(TM) i7-12700K [Family 6 Model 151 Stepping 2] | 28 | 19.43 | 6.08 | 118.11 |
| AMD Ryzen 5 5600G with Radeon Graphics [Family 25 Model 80 Stepping 0] | 45 | 12.00 | 6.02 | 72.18 |
| AMD Ryzen 9 5950X 16-Core Processor [Family 25 Model 33 Stepping 2] | 21 | 31.24 | 6.01 | 187.60 |
| 12th Gen Intel(R) Core(TM) i9-12900K [Family 6 Model 151 Stepping 2] | 25 | 23.68 | 5.98 | 141.61 |
| AMD Ryzen 9 5950X 16-Core Processor [Family 25 Model 33 Stepping 0] | 76 | 31.58 | 5.97 | 188.38 |
| AMD Ryzen 9 5900X 12-Core Processor [Family 25 Model 33 Stepping 0] | 70 | 23.71 | 5.94 | 140.97 |
| AMD Ryzen 5 5600X 6-Core Processor [Family 25 Model 33 Stepping 0] | 83 | 11. 93 93 |
5.91 | 70.51 |
| AMD Ryzen 9 5900X 12-Core Processor [Family 25 Model 33 Stepping 2] | 28 | 23.21 | 5.90 | 137.00 |
| AMD Ryzen 7 5800X 8-Core Processor [Family 25 Model 33 Stepping 0] | 74 | 15.89 | 5.84 | 92.80 |
| Intel(R) Core(TM) i5-8500 CPU @ 3.00GHz [x86 Family 6 Model 158 Stepping 10] | 16 | 6.00 | 5.80 | 34.83 |
| Intel(R) Core(TM) i5-7600 CPU @ 3.50GHz [x86 Family 6 Model 158 Stepping 9] | 13 | 4.00 | 5.75 | 23.02 |
| Intel(R) Core(TM) i7-10700KF CPU @ 3.80GHz [Family 6 Model 165 Stepping 5] | 13 | 16.00 | 5.74 | 91.86 |
| 11th Gen Intel(R) Core(TM) i9-11900K @ 3.50GHz [Family 6 Model 167 Stepping 1] | 22 | 16.00 | 5.74 | 91.76 |
| Intel(R) Core(TM) i9-10850K CPU @ 3.60GHz [Family 6 Model 165 Stepping 5] | 23 | 20. 00 00 |
5.72 | 114.34 |
| 12th Gen Intel(R) Core(TM) i5-12600K [Family 6 Model 151 Stepping 2] | 16 | 16.00 | 5.71 | 91.32 |
| Intel(R) Core(TM) i9-10900K CPU @ 3.70GHz [Family 6 Model 165 Stepping 5] | 19 | 19.16 | 5.70 | 109.27 |
| Intel(R) Core(TM) i9-10900KF CPU @ 3.70GHz [Family 6 Model 165 Stepping 5] | 16 | 20.00 | 5.70 | 113.92 |
| Intel(R) Core(TM) i7-6700K CPU @ 4.00GHz [x86 Family 6 Model 94 Stepping 3] | 16 | 8.00 | 5.67 | 45.35 |
| AMD Ryzen 7 5700G with Radeon Graphics [Family 25 Model 80 Stepping 0] | 38 | 16.00 | 5.64 | 90.31 |
| AMD Ryzen 9 3900X 12-Core Processor [Family 23 Model 113 Stepping 0] | 131 | 23.66 | 5.57 | 131.92 |
| Intel(R) Core(TM) i7-9700F CPU @ 3.00GHz [Family 6 Model 158 Stepping 13] | 19 | 8. 00 00 |
5.56 | 44.49 |
| Intel(R) Core(TM) i7-9700K CPU @ 3.60GHz [Family 6 Model 158 Stepping 12] | 36 | 8.00 | 5.54 | 44.30 |
| Intel(R) Xeon(R) W-2140B CPU @ 3.20GHz [x86 Family 6 Model 85 Stepping 4] | 13 | 16.00 | 5.49 | 87.85 |
| AMD Ryzen 7 3800X 8-Core Processor [Family 23 Model 113 Stepping 0] | 52 | 16.00 | 5.48 | 87.76 |
| Intel(R) Core(TM) i7-9700K CPU @ 3.60GHz [Family 6 Model 158 Stepping 13] | 58 | 7.97 | 5.47 | 43.57 |
| 11th Gen Intel(R) Core(TM) i7-11700K @ 3.60GHz [Family 6 Model 167 Stepping 1] | 33 | 16.00 | 5.45 | 87.27 |
| AMD Ryzen 9 5900HX with Radeon Graphics [Family 25 Model 80 Stepping 0] | 17 | 16.00 | 5.44 | 87.11 |
| Intel(R) Core(TM) i7-10700K CPU @ 3.80GHz [Family 6 Model 165 Stepping 5] | 44 | 16. 00 00 |
5.44 | 87.05 |
| Intel(R) Core(TM) i7-9750H CPU @ 2.60GHz [x86 Family 6 Model 158 Stepping 10] | 16 | 12.00 | 5.44 | 65.28 |
| AMD Ryzen 7 3700X 8-Core Processor [Family 23 Model 113 Stepping 0] | 194 | 15.89 | 5.44 | 86.42 |
| Intel(R) Core(TM) i5-9600K CPU @ 3.70GHz [Family 6 Model 158 Stepping 13] | 30 | 6.00 | 5.42 | 32.51 |
| Intel(R) Core(TM) i5-8500B CPU @ 3.00GHz [x86 Family 6 Model 158 Stepping 10] | 19 | 6.00 | 5.39 | 32.33 |
| 12th Gen Intel(R) Core(TM) i7-12700 [Family 6 Model 151 Stepping 2] | 22 | 19.82 | 5.36 | 106.22 |
| Intel(R) Core(TM) i5-9600K CPU @ 3.70GHz [Family 6 Model 158 Stepping 12] | 29 | 6.00 | 5.35 | 32.08 |
| AMD Ryzen 9 3900XT 12-Core Processor [Family 23 Model 113 Stepping 0] | 11 | 24. 00 00 |
5.34 | 128.19 |
| AMD Ryzen 5 3600X 6-Core Processor [Family 23 Model 113 Stepping 0] | 63 | 12.00 | 5.33 | 63.91 |
| Intel(R) Core(TM) i5-7500 CPU @ 3.40GHz [x86 Family 6 Model 158 Stepping 9] | 26 | 4.00 | 5.33 | 21.30 |
| Intel(R) Core(TM) i9-9900K CPU @ 3.60GHz [Family 6 Model 158 Stepping 12] | 42 | 16.00 | 5.32 | 85.06 |
| Apple M1 Max | 52 | 10.00 | 5.30 | 52.96 |
| Intel(R) Core(TM) i9-10900 CPU @ 2.80GHz [Family 6 Model 165 Stepping 5] | 15 | 20.00 | 5.29 | 105.82 |
| AMD Ryzen 9 3950X 16-Core Processor [Family 23 Model 113 Stepping 0] | 44 | 32.00 | 5.26 | 168.43 |
| Intel(R) Core(TM) i3-8100B CPU @ 3.60GHz [x86 Family 6 Model 158 Stepping 10] | 21 | 4.00 | 5.26 | 21.05 |
Intel(R) Core(TM) i7-8700B CPU @ 3. 20GHz [x86 Family 6 Model 158 Stepping 10] 20GHz [x86 Family 6 Model 158 Stepping 10] |
38 | 12.00 | 5.24 | 62.87 |
| Intel(R) Core(TM) i5-10600K CPU @ 4.10GHz [Family 6 Model 165 Stepping 5] | 23 | 11.22 | 5.22 | 58.60 |
| Apple M1 Pro | 61 | 9.54 | 5.22 | 49.85 |
| Intel(R) Core(TM) i9-9900K CPU @ 3.60GHz [Family 6 Model 158 Stepping 13] | 51 | 15.84 | 5.22 | 82.76 |
| Intel(R) Core(TM) i3-10105 CPU @ 3.70GHz [Family 6 Model 165 Stepping 3] | 11 | 8.00 | 5.22 | 41.77 |
| AMD Ryzen 5 3600 6-Core Processor [Family 23 Model 113 Stepping 0] | 217 | 11.95 | 5.22 | 62.32 |
| AMD Ryzen Threadripper 1950X 16-Core Processor [Family 23 Model 1 Stepping 1] | 24 | 28.25 | 5.19 | 146.48 |
| AMD Ryzen Threadripper 2950X 16-Core Processor [Family 23 Model 8 Stepping 2] | 16 | 27. 94 94 |
5.18 | 144.84 |
| Intel(R) Core(TM) i7-6850K CPU @ 3.60GHz [Family 6 Model 79 Stepping 1] | 12 | 12.00 | 5.16 | 61.94 |
| Intel(R) Core(TM) i7-9700 CPU @ 3.00GHz [Family 6 Model 158 Stepping 13] | 116 | 8.00 | 5.15 | 41.24 |
| Intel(R) Core(TM) i5-7360U CPU @ 2.30GHz [x86 Family 6 Model 142 Stepping 9] | 11 | 4.00 | 5.14 | 20.57 |
| Intel(R) Core(TM) i7-10700F CPU @ 2.90GHz [Family 6 Model 165 Stepping 5] | 29 | 16.00 | 5.12 | 81.94 |
| Intel(R) Xeon(R) CPU E5-2680 v4 @ 2.40GHz [Family 6 Model 79 Stepping 1] | 100 | 53.00 | 5.10 | 270.17 |
| 12th Gen Intel(R) Core(TM) i5-12400 [Family 6 Model 151 Stepping 5] | 10 | 12.00 | 5.07 | 60.89 |
| Intel(R) Core(TM) i5-8600K CPU @ 3.60GHz [Family 6 Model 158 Stepping 10] | 37 | 6. 00 00 |
5.06 | 30.36 |
| Intel(R) Core(TM) i5-7600K CPU @ 3.80GHz [Family 6 Model 158 Stepping 9] | 18 | 4.00 | 5.06 | 20.24 |
| AMD Ryzen 5 4500U with Radeon Graphics [Family 23 Model 96 Stepping 1] | 32 | 6.00 | 5.05 | 30.30 |
| Intel(R) Core(TM) i9-10980XE CPU @ 3.00GHz [Family 6 Model 85 Stepping 7] | 14 | 36.00 | 5.05 | 181.70 |
| Intel(R) Core(TM) i7-10700 CPU @ 2.90GHz [Family 6 Model 165 Stepping 5] | 79 | 16.00 | 5.04 | 80.64 |
| AMD Ryzen 7 2700X Eight-Core Processor [Family 23 Model 8 Stepping 2] | 104 | 15.80 | 5.04 | 79.56 |
| AMD Ryzen 5 2600X Six-Core Processor [Family 23 Model 8 Stepping 2] | 27 | 12.00 | 5.00 | 59.95 |
| Intel(R) Core(TM) i9-9900 CPU @ 3.10GHz [Family 6 Model 158 Stepping 13] | 21 | 18. 29 29 |
4.99 | 91.24 |
| Intel(R) Core(TM) i7-8700K CPU @ 3.70GHz [Family 6 Model 158 Stepping 10] | 100 | 11.94 | 4.98 | 59.51 |
| 11th Gen Intel(R) Core(TM) i7-11700F @ 2.50GHz [Family 6 Model 167 Stepping 1] | 15 | 16.00 | 4.97 | 79.58 |
| AMD Ryzen 5 3400G with Radeon Vega Graphics [Family 23 Model 24 Stepping 1] | 26 | 7.81 | 4.96 | 38.76 |
| Intel(R) Core(TM) i7-4771 CPU @ 3.50GHz [x86 Family 6 Model 60 Stepping 3] | 11 | 8.00 | 4.93 | 39.45 |
| Intel(R) Core(TM) i3-10100 CPU @ 3.60GHz [Family 6 Model 165 Stepping 3] | 38 | 7.89 | 4.92 | 38.87 |
| Intel(R) Core(TM) i5-9500 CPU @ 3.00GHz [Family 6 Model 158 Stepping 10] | 56 | 6.00 | 4.92 | 29.49 |
| Intel(R) Core(TM) i5-9400 CPU @ 2.90GHz [Family 6 Model 158 Stepping 13] | 31 | 6. 00 00 |
4.91 | 29.46 |
| AMD Ryzen 3 3200G with Radeon Vega Graphics [Family 23 Model 24 Stepping 1] | 34 | 4.00 | 4.91 | 19.63 |
| Intel(R) Core(TM) i5-6500 CPU @ 3.20GHz [x86 Family 6 Model 94 Stepping 3] | 20 | 4.00 | 4.90 | 19.61 |
| Intel(R) Core(TM) i7-3770 CPU @ 3.40GHz [x86 Family 6 Model 58 Stepping 9] | 10 | 8.00 | 4.90 | 39.19 |
| AMD Ryzen 5 1600 Six-Core Processor [Family 23 Model 8 Stepping 2] | 20 | 12.00 | 4.89 | 58.64 |
| AMD Ryzen 7 4800H with Radeon Graphics [Family 23 Model 96 Stepping 1] | 27 | 16.00 | 4.88 | 78.06 |
| Intel(R) Core(TM) i3-9100 CPU @ 3.60GHz [Family 6 Model 158 Stepping 11] | 35 | 4.00 | 4.88 | 19.50 |
| Apple M1 | 237 | 8.00 | 4.86 | 38.87 |
Intel(R) Core(TM) i5-10500 CPU @ 3. 10GHz [Family 6 Model 165 Stepping 3] 10GHz [Family 6 Model 165 Stepping 3] |
83 | 12.00 | 4.85 | 58.22 |
| 11th Gen Intel(R) Core(TM) i5-11400 @ 2.60GHz [Family 6 Model 167 Stepping 1] | 29 | 12.00 | 4.85 | 58.20 |
| 11th Gen Intel(R) Core(TM) i5-11400F @ 2.60GHz [Family 6 Model 167 Stepping 1] | 29 | 12.00 | 4.84 | 58.10 |
| AMD Ryzen Threadripper 1920X 12-Core Processor [Family 23 Model 1 Stepping 1] | 13 | 24.00 | 4.84 | 116.12 |
| Intel(R) Core(TM) i3-9100F CPU @ 3.60GHz [Family 6 Model 158 Stepping 10] | 18 | 4.00 | 4.83 | 19.31 |
| Intel(R) Core(TM) i7-7700K CPU @ 4.20GHz [Family 6 Model 158 Stepping 9] | 112 | 7.96 | 4.80 | 38.24 |
| Intel(R) Core(TM) i7-8700 CPU @ 3.20GHz [Family 6 Model 158 Stepping 10] | 173 | 11.92 | 4.80 | 57.20 |
| AMD Ryzen 3 2200G with Radeon Vega Graphics [Family 23 Model 17 Stepping 0] | 23 | 4. 00 00 |
4.79 | 19.15 |
| Intel(R) Core(TM) i7-6800K CPU @ 3.40GHz [Family 6 Model 79 Stepping 1] | 10 | 12.00 | 4.78 | 57.40 |
| Intel(R) Xeon(R) CPU E5-1650 v2 @ 3.50GHz [x86 Family 6 Model 62 Stepping 4] | 12 | 12.00 | 4.78 | 57.37 |
| Intel(R) Core(TM) i5-8500 CPU @ 3.00GHz [Family 6 Model 158 Stepping 10] | 76 | 6.00 | 4.78 | 28.66 |
| Intel(R) Core(TM) i7-4790K CPU @ 4.00GHz [Family 6 Model 60 Stepping 3] | 87 | 7.84 | 4.78 | 37.44 |
| Intel(R) Core(TM) i5-4570 CPU @ 3.20GHz [x86 Family 6 Model 60 Stepping 3] | 11 | 4.00 | 4.77 | 19.09 |
| Intel(R) Core(TM) i5-10400 CPU @ 2.90GHz [Family 6 Model 165 Stepping 3] | 72 | 12.00 | 4.76 | 57.17 |
| Intel(R) Core(TM) i9-9880H CPU @ 2.30GHz [x86 Family 6 Model 158 Stepping 13] | 14 | 16. |
4.76 | 76.22 |
| AMD Ryzen 5 4600H with Radeon Graphics [Family 23 Model 96 Stepping 1] | 16 | 12.00 | 4.73 | 56.73 |
| AMD Ryzen 7 5800H with Radeon Graphics [Family 25 Model 80 Stepping 0] | 20 | 16.00 | 4.72 | 75.54 |
| AMD Ryzen 5 2600 Six-Core Processor [Family 23 Model 8 Stepping 2] | 102 | 11.94 | 4.72 | 56.33 |
| Intel(R) Core(TM) i5-10400F CPU @ 2.90GHz [Family 6 Model 165 Stepping 3] | 45 | 12.00 | 4.71 | 56.56 |
| Intel(R) Core(TM) i5-4690K CPU @ 3.50GHz [Family 6 Model 60 Stepping 3] | 37 | 4.00 | 4.71 | 18.84 |
| Intel(R) Core(TM) i5-10400 CPU @ 2.90GHz [Family 6 Model 165 Stepping 5] | 23 | 12.00 | 4.71 | 56.52 |
| Intel(R) Core(TM) i5-9400 CPU @ 2.90GHz [Family 6 Model 158 Stepping 10] | 47 | 6. 00 00 |
4.70 | 28.20 |
| Intel(R) Core(TM) i5-9400F CPU @ 2.90GHz [Family 6 Model 158 Stepping 10] | 78 | 6.00 | 4.67 | 28.03 |
| Intel(R) Core(TM) i5-8400 CPU @ 2.80GHz [Family 6 Model 158 Stepping 10] | 130 | 6.00 | 4.66 | 27.94 |
| Intel(R) Core(TM) i5-10300H CPU @ 2.50GHz [Family 6 Model 165 Stepping 2] | 33 | 8.00 | 4.65 | 37.22 |
| Intel(R) Core(TM) i5-10400F CPU @ 2.90GHz [Family 6 Model 165 Stepping 5] | 15 | 12.00 | 4.65 | 55.83 |
| Intel(R) Xeon(R) CPU E3-1225 v6 @ 3.30GHz [Family 6 Model 158 Stepping 9] | 13 | 4.00 | 4.63 | 18.54 |
| Intel(R) Xeon(R) CPU E3-1226 v3 @ 3.30GHz [Family 6 Model 60 Stepping 3] | 20 | 4.00 | 4.63 | 18.53 |
| AMD Ryzen 7 1700X Eight-Core Processor [Family 23 Model 1 Stepping 1] | 23 | 16. 00 00 |
4.62 | 73.98 |
| AMD Ryzen 7 1800X Eight-Core Processor [Family 23 Model 1 Stepping 1] | 28 | 19.00 | 4.62 | 87.82 |
| AMD Ryzen 7 4700U with Radeon Graphics [Family 23 Model 96 Stepping 1] | 15 | 8.00 | 4.60 | 36.84 |
| 11th Gen Intel(R) Core(TM) i3-1115G4 @ 3.00GHz [Family 6 Model 140 Stepping 1] | 22 | 4.00 | 4.59 | 18.34 |
| 11th Gen Intel(R) Core(TM) i7-11700 @ 2.50GHz [Family 6 Model 167 Stepping 1] | 30 | 16.00 | 4.58 | 73.35 |
| Intel(R) Core(TM) i9-9980HK CPU @ 2.40GHz [x86 Family 6 Model 158 Stepping 13] | 10 | 16.00 | 4.56 | 73.00 |
| AMD Ryzen 5 2400G with Radeon Vega Graphics [Family 23 Model 17 Stepping 0] | 27 | 8.00 | 4.56 | 36.48 |
| 11th Gen Intel(R) Core(TM) i5-11400H @ 2.70GHz [Family 6 Model 141 Stepping 1] | 10 | 12. 00 00 |
4.53 | 54.36 |
| Intel(R) Xeon(R) CPU E3-1231 v3 @ 3.40GHz [Family 6 Model 60 Stepping 3] | 15 | 8.00 | 4.53 | 36.22 |
| 12th Gen Intel(R) Core(TM) i7-12700H [Family 6 Model 154 Stepping 3] | 12 | 20.00 | 4.52 | 90.39 |
| Intel(R) Core(TM) i7-6700K CPU @ 4.00GHz [Family 6 Model 94 Stepping 3] | 183 | 7.97 | 4.50 | 35.88 |
| Intel(R) Core(TM) i5-4670 CPU @ 3.40GHz [Family 6 Model 60 Stepping 3] | 52 | 4.00 | 4.49 | 17.95 |
| Intel(R) Core(TM) i5-7600 CPU @ 3.50GHz [Family 6 Model 158 Stepping 9] | 26 | 4.00 | 4.49 | 17.94 |
| Intel(R) Core(TM) i5-4690 CPU @ 3.50GHz [Family 6 Model 60 Stepping 3] | 46 | 4.00 | 4.47 | 17.86 |
| Intel(R) Core(TM) i5-4670K CPU @ 3.40GHz [Family 6 Model 60 Stepping 3] | 25 | 4. 00 00 |
4.45 | 17.82 |
| Intel(R) Xeon(R) CPU E3-1225 v3 @ 3.20GHz [Family 6 Model 60 Stepping 3] | 14 | 3.86 | 4.45 | 17.16 |
| Intel(R) Xeon(R) CPU E3-1275 v5 @ 3.60GHz [Family 6 Model 94 Stepping 3] | 10 | 8.00 | 4.45 | 35.58 |
| AMD Ryzen 5 1600X Six-Core Processor [Family 23 Model 1 Stepping 1] | 26 | 12.00 | 4.43 | 53.21 |
| 11th Gen Intel(R) Core(TM) i7-11800H @ 2.30GHz [Family 6 Model 141 Stepping 1] | 40 | 16.00 | 4.43 | 70.93 |
| Intel(R) Core(TM) i5-6600K CPU @ 3.50GHz [Family 6 Model 94 Stepping 3] | 59 | 4.00 | 4.39 | 17.57 |
| Intel(R) Core(TM) i7-4578U CPU @ 3.00GHz [x86 Family 6 Model 69 Stepping 1] | 11 | 4.00 | 4.36 | 17.44 |
| AMD Ryzen 7 5700U with Radeon Graphics [Family 23 Model 104 Stepping 1] | 10 | 16. 00 00 |
4.33 | 69.35 |
| AMD Ryzen 5 1600 Six-Core Processor [Family 23 Model 1 Stepping 1] | 43 | 12.00 | 4.33 | 51.95 |
| Intel(R) Core(TM) i3-8100 CPU @ 3.60GHz [Family 6 Model 158 Stepping 11] | 62 | 3.98 | 4.33 | 17.25 |
| Intel(R) Xeon(R) W-2295 CPU @ 3.00GHz [Family 6 Model 85 Stepping 7] | 10 | 35.60 | 4.32 | 153.95 |
| AMD Ryzen 7 2700 Eight-Core Processor [Family 23 Model 8 Stepping 2] | 74 | 15.99 | 4.32 | 69.08 |
| 11th Gen Intel(R) Core(TM) i7-1185G7 @ 3.00GHz [Family 6 Model 140 Stepping 1] | 11 | 8.00 | 4.29 | 34.36 |
| Intel(R) Core(TM) i5-10500T CPU @ 2.30GHz [Family 6 Model 165 Stepping 3] | 10 | 12.00 | 4.27 | 51.26 |
| Intel(R) Core(TM) i7-10750H CPU @ 2.60GHz [Family 6 Model 165 Stepping 2] | 66 | 12. 00 00 |
4.27 | 51.25 |
| AMD Ryzen 7 1700 Eight-Core Processor [Family 23 Model 1 Stepping 1] | 57 | 15.58 | 4.27 | 66.47 |
| Intel(R) Core(TM) i5-3570K CPU @ 3.40GHz [Family 6 Model 58 Stepping 9] | 42 | 4.00 | 4.24 | 16.97 |
| AMD Ryzen 5 5500U with Radeon Graphics [Family 23 Model 104 Stepping 1] | 18 | 12.00 | 4.24 | 50.88 |
| Intel(R) Core(TM) i5-3570 CPU @ 3.40GHz [Family 6 Model 58 Stepping 9] | 74 | 3.97 | 4.23 | 16.82 |
| Intel(R) Core(TM) i7-4771 CPU @ 3.50GHz [Family 6 Model 60 Stepping 3] | 10 | 8.00 | 4.22 | 33.78 |
| AMD Ryzen 5 3550H with Radeon Vega Mobile Gfx [Family 23 Model 24 Stepping 1] | 14 | 8.00 | 4.22 | 33.75 |
| Intel(R) Core(TM) i7-5930K CPU @ 3.50GHz [Family 6 Model 63 Stepping 2] | 22 | 12. 00 00 |
4.21 | 50.55 |
| Intel(R) Xeon(R) CPU E5-1650 v3 @ 3.50GHz [Family 6 Model 63 Stepping 2] | 12 | 11.50 | 4.20 | 48.35 |
| Intel(R) Core(TM) i7-4770K CPU @ 3.50GHz [Family 6 Model 60 Stepping 3] | 44 | 7.91 | 4.20 | 33.20 |
| Intel(R) Core(TM) i5-3550 CPU @ 3.30GHz [Family 6 Model 58 Stepping 9] | 16 | 4.00 | 4.18 | 16.71 |
| Intel(R) Core(TM) i7-8700T CPU @ 2.40GHz [Family 6 Model 158 Stepping 10] | 10 | 12.00 | 4.18 | 50.10 |
| Intel(R) Core(TM) i5-4570R CPU @ 2.70GHz [x86 Family 6 Model 70 Stepping 1] | 18 | 4.00 | 4.17 | 16.69 |
| Intel(R) Xeon(R) CPU E3-1220 v3 @ 3.10GHz [Family 6 Model 60 Stepping 3] | 13 | 4.00 | 4.17 | 16.68 |
| Intel(R) Core(TM) i7-7700 CPU @ 3.60GHz [Family 6 Model 158 Stepping 9] | 262 | 7. 98 98 |
4.16 | 33.24 |
| Intel(R) Core(TM) i5-7500T CPU @ 2.70GHz [Family 6 Model 158 Stepping 9] | 11 | 4.00 | 4.13 | 16.54 |
| Intel(R) Core(TM) i5-2500K CPU @ 3.30GHz [Family 6 Model 42 Stepping 7] | 24 | 4.00 | 4.13 | 16.52 |
| Intel(R) Xeon(R) CPU E3-1240 V2 @ 3.40GHz [Family 6 Model 58 Stepping 9] | 12 | 7.67 | 4.13 | 31.66 |
| Intel(R) Core(TM) i5-4570 CPU @ 3.20GHz [Family 6 Model 60 Stepping 3] | 156 | 4.00 | 4.13 | 16.50 |
| Intel(R) Core(TM) i7-3770K CPU @ 3.50GHz [Family 6 Model 58 Stepping 9] | 58 | 7.90 | 4.11 | 32.48 |
| Intel(R) Core(TM) i7-4770S CPU @ 3.10GHz [Family 6 Model 60 Stepping 3] | 15 | 8.00 | 4.08 | 32.66 |
| Intel(R) Core(TM) i7-4790 CPU @ 3.60GHz [Family 6 Model 60 Stepping 3] | 285 | 7. 96 96 |
4.08 | 32.45 |
| Intel(R) Core(TM) i7-4770 CPU @ 3.40GHz [Family 6 Model 60 Stepping 3] | 132 | 7.83 | 4.07 | 31.89 |
| Intel(R) Core(TM) i5-4278U CPU @ 2.60GHz [x86 Family 6 Model 69 Stepping 1] | 27 | 4.00 | 4.07 | 16.28 |
| Intel(R) Core(TM) i5-9500T CPU @ 2.20GHz [Family 6 Model 158 Stepping 10] | 15 | 6.00 | 4.06 | 24.36 |
| Intel(R) Core(TM) i5-6600 CPU @ 3.30GHz [Family 6 Model 94 Stepping 3] | 58 | 4.00 | 4.05 | 16.21 |
| Intel(R) Core(TM) i7-3820 CPU @ 3.60GHz [Family 6 Model 45 Stepping 7] | 12 | 8.00 | 4.05 | 32.42 |
| Intel(R) Core(TM) i5-4590 CPU @ 3.30GHz [Family 6 Model 60 Stepping 3] | 184 | 3.99 | 4.04 | 16.13 |
| Intel(R) Core(TM) i7-3770 CPU @ 3.40GHz [Family 6 Model 58 Stepping 9] | 233 | 7. 84 84 |
4.04 | 31.62 |
| 11th Gen Intel(R) Core(TM) i7-1165G7 @ 2.80GHz [Family 6 Model 140 Stepping 1] | 68 | 8.00 | 4.03 | 32.22 |
| Intel(R) Core(TM) i7-3615QM CPU @ 2.30GHz [x86 Family 6 Model 58 Stepping 9] | 24 | 8.00 | 4.02 | 32.15 |
| Intel(R) Core(TM) i7-5820K CPU @ 3.30GHz [Family 6 Model 63 Stepping 2] | 46 | 12.00 | 4.02 | 48.21 |
| Intel(R) Core(TM) i7-7700T CPU @ 2.90GHz [Family 6 Model 158 Stepping 9] | 16 | 8.00 | 4.00 | 32.03 |
| Intel(R) Core(TM) i5-7500 CPU @ 3.40GHz [Family 6 Model 158 Stepping 9] | 134 | 4.00 | 3.98 | 15.93 |
| Intel(R) Core(TM) i5-3470 CPU @ 3.20GHz [Family 6 Model 58 Stepping 9] | 237 | 3.99 | 3.96 | 15.78 |
| Intel(R) Core(TM) i7-9750H CPU @ 2.60GHz [Family 6 Model 158 Stepping 10] | 59 | 12. 00 00 |
3.95 | 47.39 |
| Intel(R) Core(TM) i5-2500 CPU @ 3.30GHz [Family 6 Model 42 Stepping 7] | 62 | 4.00 | 3.93 | 15.74 |
| Intel(R) Core(TM) i5-3450 CPU @ 3.10GHz [Family 6 Model 58 Stepping 9] | 22 | 4.00 | 3.93 | 15.72 |
| Intel(R) Core(TM) i5-4460 CPU @ 3.20GHz [Family 6 Model 60 Stepping 3] | 79 | 4.00 | 3.93 | 15.72 |
| 11th Gen Intel(R) Core(TM) i5-1135G7 @ 2.40GHz [Family 6 Model 140 Stepping 1] | 72 | 8.00 | 3.92 | 31.33 |
| Intel(R) Core(TM) i3-1005G1 CPU @ 1.20GHz [Family 6 Model 126 Stepping 5] | 27 | 4.00 | 3.91 | 15.65 |
| Intel(R) Pentium(R) Gold G5400 CPU @ 3.70GHz [Family 6 Model 158 Stepping 10] | 12 | 4.00 | 3.90 | 15.60 |
| Intel(R) Xeon(R) CPU E3-1265L V2 @ 2.50GHz [Family 6 Model 58 Stepping 9] | 12 | 8. 00 00 |
3.90 | 31.18 |
| Intel(R) Xeon(R) CPU E5-1620 0 @ 3.60GHz [Family 6 Model 45 Stepping 7] | 15 | 7.73 | 3.89 | 30.09 |
| Intel(R) Core(TM) i7-4790S CPU @ 3.20GHz [Family 6 Model 60 Stepping 3] | 14 | 8.00 | 3.89 | 31.09 |
| Intel(R) Core(TM) i3-10110U CPU @ 2.10GHz [Family 6 Model 142 Stepping 12] | 13 | 4.00 | 3.86 | 15.43 |
| Intel(R) Core(TM) i7-9750H CPU @ 2.60GHz [Family 6 Model 158 Stepping 13] | 15 | 12.00 | 3.85 | 46.26 |
| Intel(R) Core(TM) i7-7820HQ CPU @ 2.90GHz [Family 6 Model 158 Stepping 9] | 11 | 8.00 | 3.85 | 30.84 |
| Common KVM processor [Family 15 Model 6 Stepping 1] | 26 | 12.38 | 3.84 | 47.50 |
| Intel(R) Core(TM) i5-3210M CPU @ 2.50GHz [x86 Family 6 Model 58 Stepping 9] | 21 | 4. 00 00 |
3.83 | 15.33 |
| Intel(R) Core(TM) i7-10875H CPU @ 2.30GHz [Family 6 Model 165 Stepping 2] | 11 | 16.00 | 3.83 | 61.23 |
| Intel(R) Core(TM) i7-3930K CPU @ 3.20GHz [Family 6 Model 45 Stepping 7] | 16 | 12.25 | 3.80 | 46.59 |
| Intel(R) Core(TM) i5-2500S CPU @ 2.70GHz [x86 Family 6 Model 42 Stepping 7] | 14 | 4.00 | 3.80 | 15.18 |
| Intel(R) Core(TM) i7-6700 CPU @ 3.40GHz [Family 6 Model 94 Stepping 3] | 346 | 7.96 | 3.78 | 30.11 |
| Intel(R) Core(TM) i7-8850H CPU @ 2.60GHz [Family 6 Model 158 Stepping 10] | 10 | 12.00 | 3.77 | 45.25 |
| Intel(R) Core(TM) i5-4570S CPU @ 2.90GHz [Family 6 Model 60 Stepping 3] | 19 | 4.00 | 3.76 | 15.05 |
| Intel(R) Core(TM) i7-4810MQ CPU @ 2.80GHz [Family 6 Model 60 Stepping 3] | 10 | 8. 00 00 |
3.76 | 30.04 |
| Intel(R) Core(TM) i7-7500U CPU @ 2.70GHz [Family 6 Model 142 Stepping 9] | 51 | 4.00 | 3.75 | 15.00 |
| Intel(R) Core(TM) i5-3470S CPU @ 2.90GHz [Family 6 Model 58 Stepping 9] | 25 | 4.00 | 3.74 | 14.96 |
| Intel(R) Core(TM) i3-7100 CPU @ 3.90GHz [Family 6 Model 158 Stepping 9] | 144 | 4.00 | 3.73 | 14.91 |
| Intel(R) Core(TM) i7-2600 CPU @ 3.40GHz [Family 6 Model 42 Stepping 7] | 141 | 7.97 | 3.72 | 29.65 |
| Intel(R) Core(TM) i5-7300HQ CPU @ 2.50GHz [Family 6 Model 158 Stepping 9] | 12 | 4.00 | 3.72 | 14.88 |
| Intel(R) Core(TM) i7-2600K CPU @ 3.40GHz [Family 6 Model 42 Stepping 7] | 55 | 8.00 | 3.71 | 29.66 |
| Intel(R) Core(TM) i5-8300H CPU @ 2.30GHz [Family 6 Model 158 Stepping 10] | 17 | 8. 00 00 |
3.70 | 29.59 |
| Intel(R) Core(TM) i5-4590S CPU @ 3.00GHz [Family 6 Model 60 Stepping 3] | 45 | 4.00 | 3.70 | 14.79 |
| Intel(R) Xeon(R) CPU E5-2680 v2 @ 2.80GHz [Family 6 Model 62 Stepping 4] | 11 | 31.09 | 3.68 | 114.56 |
| Intel(R) Core(TM) i7-8750H CPU @ 2.20GHz [Family 6 Model 158 Stepping 10] | 59 | 12.00 | 3.68 | 44.17 |
| Intel(R) Core(TM) i5-9300H CPU @ 2.40GHz [Family 6 Model 158 Stepping 10] | 26 | 8.00 | 3.67 | 29.36 |
| AMD Ryzen 5 3500U with Radeon Vega Mobile Gfx [Family 23 Model 24 Stepping 1] | 22 | 8.00 | 3.66 | 29.25 |
| Intel(R) Pentium(R) CPU G4600 @ 3.60GHz [Family 6 Model 158 Stepping 9] | 15 | 4.00 | 3.65 | 14.59 |
| Intel(R) Core(TM) i7-8565U CPU @ 1.80GHz [Family 6 Model 142 Stepping 12] | 33 | 8. 00 00 |
3.63 | 29.02 |
| Intel(R) Core(TM) i5-2400 CPU @ 3.10GHz [Family 6 Model 42 Stepping 7] | 192 | 3.99 | 3.62 | 14.46 |
| Intel(R) Core(TM) i3-4160 CPU @ 3.60GHz [Family 6 Model 60 Stepping 3] | 197 | 3.99 | 3.61 | 14.40 |
| Intel(R) Core(TM) i5-6300HQ CPU @ 2.30GHz [Family 6 Model 94 Stepping 3] | 11 | 4.00 | 3.61 | 14.43 |
| Intel(R) Core(TM) i7-5500U CPU @ 2.40GHz [Family 6 Model 61 Stepping 4] | 27 | 4.00 | 3.60 | 14.41 |
| Intel(R) Core(TM) i5-6500 CPU @ 3.20GHz [Family 6 Model 94 Stepping 3] | 329 | 4.00 | 3.58 | 14.33 |
| Intel(R) Core(TM) i7-7700HQ CPU @ 2.80GHz [Family 6 Model 158 Stepping 9] | 69 | 8.00 | 3.56 | 28.48 |
| Intel Core Processor (Haswell, no TSX) [Family 6 Model 60 Stepping 1] | 11 | 1. 82 82 |
3.56 | 6.46 |
| Intel(R) Core(TM) i3-6098P CPU @ 3.60GHz [Family 6 Model 94 Stepping 3] | 15 | 4.00 | 3.54 | 14.18 |
| Intel(R) Core(TM) i7-6600U CPU @ 2.60GHz [Family 6 Model 78 Stepping 3] | 15 | 4.00 | 3.54 | 14.17 |
| Intel(R) Core(TM) i5-7400 CPU @ 3.00GHz [Family 6 Model 158 Stepping 9] | 256 | 4.00 | 3.54 | 14.15 |
| Intel(R) Core(TM) i3-4170 CPU @ 3.70GHz [Family 6 Model 60 Stepping 3] | 162 | 4.00 | 3.53 | 14.14 |
| Intel(R) Core(TM) i5-4430 CPU @ 3.00GHz [Family 6 Model 60 Stepping 3] | 27 | 4.00 | 3.53 | 14.13 |
| Intel(R) Core(TM) i5-10210U CPU @ 1.60GHz [Family 6 Model 142 Stepping 12] | 66 | 8.00 | 3.53 | 28.24 |
| [Impl 0x41 Arch 8 Variant 0x2 Part 0xd05 Rev 0] | 10 | 8.00 | 3. 52 52 |
28.16 |
| Intel(R) Core(TM) i7-7600U CPU @ 2.80GHz [Family 6 Model 142 Stepping 9] | 10 | 4.00 | 3.51 | 14.03 |
| Intel(R) Core(TM) i5-4570T CPU @ 2.90GHz [Family 6 Model 60 Stepping 3] | 22 | 3.91 | 3.51 | 13.71 |
| Intel(R) Core(TM) i5-2320 CPU @ 3.00GHz [Family 6 Model 42 Stepping 7] | 38 | 4.00 | 3.50 | 14.02 |
| Intel(R) Core(TM) i5-3350P CPU @ 3.10GHz [Family 6 Model 58 Stepping 9] | 14 | 4.00 | 3.50 | 14.00 |
| AMD FX(tm)-8350 Eight-Core Processor [Family 21 Model 2 Stepping 0] | 38 | 8.00 | 3.50 | 27.99 |
| Intel(R) Core(TM) i7-6820HQ CPU @ 2.70GHz [Family 6 Model 94 Stepping 3] | 18 | 8.00 | 3.50 | 27.98 |
| Intel(R) Xeon(R) CPU E5-2680 v3 @ 2.50GHz [Family 6 Model 63 Stepping 2] | 14 | 25.93 | 3. 49 49 |
90.52 |
| Intel(R) Core(TM) i7-1065G7 CPU @ 1.30GHz [Family 6 Model 126 Stepping 5] | 41 | 8.00 | 3.49 | 27.88 |
| Intel(R) Pentium(R) CPU G4560 @ 3.50GHz [Family 6 Model 158 Stepping 9] | 37 | 4.00 | 3.48 | 13.93 |
| Intel(R) Core(TM) i5-3340 CPU @ 3.10GHz [Family 6 Model 58 Stepping 9] | 18 | 4.00 | 3.48 | 13.93 |
| AMD FX-8370 Eight-Core Processor [Family 21 Model 2 Stepping 0] | 10 | 8.00 | 3.48 | 27.86 |
| Intel(R) Core(TM) i5-2400S CPU @ 2.50GHz [x86 Family 6 Model 42 Stepping 7] | 11 | 4.00 | 3.48 | 13.91 |
| Intel(R) Core(TM) i3-8130U CPU @ 2.20GHz [Family 6 Model 142 Stepping 10] | 11 | 4.00 | 3.47 | 13.90 |
| Intel(R) Core(TM) i7-4710MQ CPU @ 2.50GHz [Family 6 Model 60 Stepping 3] | 11 | 8. 00 00 |
3.47 | 27.78 |
| Intel(R) Core(TM) i3-2130 CPU @ 3.40GHz [Family 6 Model 42 Stepping 7] | 12 | 4.00 | 3.47 | 13.87 |
| Intel(R) Core(TM)2 Duo CPU E8400 @ 3.00GHz [Family 6 Model 23 Stepping 10] | 22 | 2.00 | 3.46 | 6.93 |
| Intel(R) Core(TM) i7-10510U CPU @ 1.80GHz [Family 6 Model 142 Stepping 12] | 30 | 8.00 | 3.46 | 27.66 |
| Intel(R) Core(TM) i3-6100 CPU @ 3.70GHz [Family 6 Model 94 Stepping 3] | 326 | 3.99 | 3.46 | 13.79 |
| Intel(R) Core(TM) i7-3630QM CPU @ 2.40GHz [Family 6 Model 58 Stepping 9] | 23 | 7.65 | 3.46 | 26.44 |
| Intel(R) Core(TM) i7-4700MQ CPU @ 2.40GHz [Family 6 Model 60 Stepping 3] | 19 | 8.00 | 3.45 | 27.64 |
| Intel(R) Core(TM) i3-4150 CPU @ 3.50GHz [Family 6 Model 60 Stepping 3] | 104 | 4. 00 00 |
3.45 | 13.79 |
| Intel(R) Xeon(R) CPU X5670 @ 2.93GHz [Family 6 Model 44 Stepping 2] | 11 | 19.27 | 3.44 | 66.34 |
| Intel(R) Pentium(R) CPU G3260 @ 3.30GHz [Family 6 Model 60 Stepping 3] | 54 | 2.00 | 3.44 | 6.88 |
| Intel(R) Core(TM) i7-6700HQ CPU @ 2.60GHz [Family 6 Model 94 Stepping 3] | 61 | 8.00 | 3.43 | 27.48 |
| Intel(R) Core(TM) i5-3320M CPU @ 2.60GHz [Family 6 Model 58 Stepping 9] | 16 | 4.00 | 3.43 | 13.73 |
| Intel(R) Core(TM) i5-4440 CPU @ 3.10GHz [Family 6 Model 60 Stepping 3] | 93 | 4.00 | 3.43 | 13.70 |
| AMD Ryzen 5 2500U with Radeon Vega Mobile Gfx [Family 23 Model 17 Stepping 0] | 10 | 8.00 | 3.42 | 27.33 |
| Intel(R) Xeon(R) CPU E5-2650 v2 @ 2.60GHz [Family 6 Model 62 Stepping 4] | 14 | 18. 86 86 |
3.40 | 64.06 |
| Intel(R) Pentium(R) CPU G3250 @ 3.20GHz [Family 6 Model 60 Stepping 3] | 43 | 2.00 | 3.39 | 6.78 |
| Intel(R) Core(TM) i5-3330 CPU @ 3.00GHz [Family 6 Model 58 Stepping 9] | 41 | 4.00 | 3.39 | 13.57 |
| Intel(R) Core(TM) i5-4460 CPU @ 3.20GHz [Family 6 Model 60 Stepping 3] | 204 | 4.00 | 3.39 | 13.56 |
| Intel(R) Core(TM) i3-3240 CPU @ 3.40GHz [Family 6 Model 58 Stepping 9] | 97 | 3.97 | 3.39 | 13.44 |
| Intel(R) Pentium(R) CPU G3258 @ 3.20GHz [Family 6 Model 60 Stepping 3] | 10 | 2.00 | 3.38 | 6.76 |
| Intel(R) Core(TM) i3-3250 CPU @ 3.50GHz [Family 6 Model 58 Stepping 9] | 12 | 4.00 | 3.38 | 13.50 |
| Intel(R) Core(TM) i3-4130 CPU @ 3.40GHz [Family 6 Model 60 Stepping 3] | 120 | 4. 00 00 |
3.37 | 13.49 |
| Intel(R) Core(TM) i7-8650U CPU @ 1.90GHz [Family 6 Model 142 Stepping 10] | 15 | 8.00 | 3.37 | 26.94 |
| Intel(R) Core(TM) i7-4720HQ CPU @ 2.60GHz [Family 6 Model 60 Stepping 3] | 10 | 8.00 | 3.36 | 26.90 |
| Intel(R) Core(TM) i5-4260U CPU @ 1.40GHz [x86 Family 6 Model 69 Stepping 1] | 11 | 4.00 | 3.36 | 13.45 |
| Intel(R) Core(TM) i7-6700T CPU @ 2.80GHz [Family 6 Model 94 Stepping 3] | 36 | 7.67 | 3.36 | 25.76 |
| Intel(R) Core(TM) i5-4460S CPU @ 2.90GHz [Family 6 Model 60 Stepping 3] | 33 | 4.00 | 3.35 | 13.42 |
| Intel(R) Core(TM) i5-7300U CPU @ 2.60GHz [Family 6 Model 142 Stepping 9] | 15 | 4.00 | 3.35 | 13.40 |
| Intel(R) Xeon(R) CPU E5-2620 v4 @ 2.10GHz [Family 6 Model 79 Stepping 1] | 15 | 20. 13 13 |
3.35 | 67.42 |
| Intel(R) Core(TM) i3-2120 CPU @ 3.30GHz [Family 6 Model 42 Stepping 7] | 107 | 3.96 | 3.31 | 13.12 |
| Intel(R) Core(TM)2 Duo CPU E8500 @ 3.16GHz [Family 6 Model 23 Stepping 10] | 10 | 2.00 | 3.29 | 6.58 |
| Intel(R) Core(TM) i5-8265U CPU @ 1.60GHz [Family 6 Model 142 Stepping 11] | 23 | 8.00 | 3.28 | 26.27 |
| Intel(R) Core(TM) i7-8565U CPU @ 1.80GHz [Family 6 Model 142 Stepping 11] | 21 | 8.00 | 3.28 | 26.23 |
| Intel(R) Core(TM) i7-6500U CPU @ 2.50GHz [Family 6 Model 78 Stepping 3] | 36 | 4.00 | 3.26 | 13.06 |
| Intel(R) Core(TM) i3-3220 CPU @ 3.30GHz [Family 6 Model 58 Stepping 9] | 148 | 4.00 | 3.25 | 13.02 |
| Intel(R) Core(TM) i7-3610QM CPU @ 2.30GHz [Family 6 Model 58 Stepping 9] | 10 | 8. 00 00 |
3.24 | 25.93 |
| Intel(R) Core(TM) i5-2300 CPU @ 2.80GHz [Family 6 Model 42 Stepping 7] | 13 | 4.00 | 3.24 | 12.95 |
| Intel(R) Core(TM) i3 CPU 540 @ 3.07GHz [Family 6 Model 37 Stepping 5] | 10 | 4.00 | 3.24 | 12.95 |
| AMD FX(tm)-8320 Eight-Core Processor [Family 21 Model 2 Stepping 0] | 15 | 7.73 | 3.23 | 25.01 |
| Intel(R) Core(TM) i5-6300U CPU @ 2.40GHz [Family 6 Model 78 Stepping 3] | 20 | 4.00 | 3.23 | 12.93 |
| Intel(R) Pentium(R) CPU G3220 @ 3.00GHz [Family 6 Model 60 Stepping 3] | 33 | 2.00 | 3.22 | 6.45 |
| Intel(R) Core(TM) i7-8665U CPU @ 1.90GHz [Family 6 Model 142 Stepping 12] | 15 | 8.00 | 3.22 | 25.77 |
| Intel(R) Core(TM) i5-2520M CPU @ 2.50GHz [Family 6 Model 42 Stepping 7] | 15 | 4. 00 00 |
3.22 | 12.88 |
| Intel(R) Xeon(R) CPU E5-2630 v3 @ 2.40GHz [Family 6 Model 63 Stepping 2] | 11 | 18.73 | 3.20 | 60.02 |
| Intel(R) Core(TM) i5-3230M CPU @ 2.60GHz [Family 6 Model 58 Stepping 9] | 17 | 4.00 | 3.20 | 12.80 |
| Intel(R) Core(TM) i5 CPU 650 @ 3.20GHz [Family 6 Model 37 Stepping 5] | 11 | 4.00 | 3.20 | 12.80 |
| Intel(R) Core(TM) i5-4590T CPU @ 2.00GHz [Family 6 Model 60 Stepping 3] | 16 | 4.00 | 3.20 | 12.79 |
| Intel(R) Core(TM) i5-8265U CPU @ 1.60GHz [Family 6 Model 142 Stepping 12] | 42 | 8.00 | 3.20 | 25.56 |
| Intel(R) Core(TM) i5-5200U CPU @ 2.20GHz [Family 6 Model 61 Stepping 4] | 33 | 4.00 | 3.19 | 12.75 |
| Intel(R) Core(TM) i5-6500T CPU @ 2.50GHz [Family 6 Model 94 Stepping 3] | 38 | 4. 00 00 |
3.19 | 12.75 |
| AMD Phenom(tm) II X4 965 Processor [Family 16 Model 4 Stepping 3] | 13 | 4.00 | 3.18 | 12.72 |
| Intel(R) Xeon(R) CPU X5650 @ 2.67GHz [Family 6 Model 44 Stepping 2] | 35 | 20.00 | 3.18 | 63.58 |
| Intel(R) Xeon(R) CPU E5-2620 v3 @ 2.40GHz [Family 6 Model 63 Stepping 2] | 16 | 18.13 | 3.18 | 57.57 |
| Intel(R) Core(TM) i5-7200U CPU @ 2.50GHz [Family 6 Model 142 Stepping 9] | 88 | 3.98 | 3.17 | 12.62 |
| Intel(R) Core(TM) i5-6402P CPU @ 2.80GHz [Family 6 Model 94 Stepping 3] | 22 | 4.00 | 3.17 | 12.68 |
| Intel(R) Pentium(R) CPU G3240 @ 3.10GHz [Family 6 Model 60 Stepping 3] | 32 | 2.00 | 3.17 | 6.33 |
| AMD Phenom(tm) II X6 1090T Processor [Family 16 Model 10 Stepping 0] | 12 | 6. 00 00 |
3.16 | 18.93 |
| Intel(R) Core(TM) i5-6400 CPU @ 2.70GHz [Family 6 Model 94 Stepping 3] | 297 | 4.00 | 3.16 | 12.62 |
| Intel(R) Xeon(R) CPU E5-2670 0 @ 2.60GHz [Family 6 Model 45 Stepping 7] | 27 | 13.11 | 3.14 | 41.23 |
| Intel(R) Pentium(R) CPU G4400 @ 3.30GHz [Family 6 Model 94 Stepping 3] | 136 | 2.00 | 3.14 | 6.28 |
| Intel(R) Xeon(R) CPU E5-2640 0 @ 2.50GHz [Family 6 Model 45 Stepping 7] | 11 | 16.73 | 3.14 | 52.52 |
| Intel(R) Core(TM) i3-4130T CPU @ 2.90GHz [Family 6 Model 60 Stepping 3] | 11 | 4.00 | 3.14 | 12.55 |
| Intel(R) Core(TM) i5-1035G1 CPU @ 1.00GHz [Family 6 Model 126 Stepping 5] | 58 | 8.00 | 3.13 | 25.04 |
| Intel(R) Core(TM)2 Duo CPU E8400 @ 3.00GHz [Family 6 Model 23 Stepping 10] | 26 | 2. 00 00 |
3.12 | 6.24 |
| Intel(R) Core(TM) i5-2310 CPU @ 2.90GHz [Family 6 Model 42 Stepping 7] | 11 | 4.00 | 3.12 | 12.47 |
| Intel(R) Core(TM) i7 CPU 870 @ 2.93GHz [Family 6 Model 30 Stepping 5] | 13 | 8.00 | 3.10 | 24.82 |
| AArch64 Processor rev 14 (aarch64) [Impl 0x51 Arch 8 Variant 0xd Part 0x805 Rev 14] | 20 | 8.00 | 3.10 | 24.81 |
| Intel(R) Core(TM) i7 CPU 860 @ 2.80GHz [Family 6 Model 30 Stepping 5] | 13 | 7.85 | 3.10 | 24.31 |
| Intel(R) Core(TM) i5-8350U CPU @ 1.70GHz [Family 6 Model 142 Stepping 10] | 18 | 8.00 | 3.09 | 24.72 |
| Intel(R) Pentium(R) CPU G2020 @ 2.90GHz [Family 6 Model 58 Stepping 9] | 27 | 2.00 | 3.07 | 6.14 |
| Intel(R) Core(TM) i7-8550U CPU @ 1.80GHz [Family 6 Model 142 Stepping 10] | 66 | 7. 94 94 |
3.07 | 24.37 |
| Intel(R) Core(TM) i3-2100 CPU @ 3.10GHz [Family 6 Model 42 Stepping 7] | 72 | 3.97 | 3.07 | 12.18 |
| Intel(R) Core(TM) i7-4510U CPU @ 2.00GHz [Family 6 Model 69 Stepping 1] | 11 | 4.00 | 3.06 | 12.25 |
| Intel(R) Pentium(R) CPU G2030 @ 3.00GHz [Family 6 Model 58 Stepping 9] | 37 | 2.00 | 3.06 | 6.12 |
| Intel(R) Core(TM) i5-4300U CPU @ 1.90GHz [Family 6 Model 69 Stepping 1] | 11 | 4.00 | 3.05 | 12.22 |
| Intel(R) Core(TM) i5-8250U CPU @ 1.60GHz [Family 6 Model 142 Stepping 10] | 96 | 7.96 | 3.05 | 24.27 |
| Intel(R) Core(TM) i3-7100T CPU @ 3.40GHz [Family 6 Model 158 Stepping 9] | 11 | 4.00 | 3.05 | 12.20 |
| Intel(R) Xeon(R) CPU E5-2660 0 @ 2.20GHz [Family 6 Model 45 Stepping 7] | 11 | 16. 36 36 |
3.05 | 49.83 |
| Intel(R) Core(TM) i5-3330S CPU @ 2.70GHz [Family 6 Model 58 Stepping 9] | 10 | 4.00 | 3.04 | 12.16 |
| Intel(R) Core(TM) i3-6100T CPU @ 3.20GHz [Family 6 Model 94 Stepping 3] | 34 | 4.00 | 3.04 | 12.14 |
| Intel(R) Celeron(R) CPU G3930 @ 2.90GHz [Family 6 Model 158 Stepping 9] | 13 | 2.00 | 3.03 | 6.06 |
| Intel(R) Celeron(R) CPU G1820 @ 2.70GHz [Family 6 Model 60 Stepping 3] | 10 | 2.00 | 3.03 | 6.06 |
| Intel(R) Core(TM) i5-3210M CPU @ 2.50GHz [Family 6 Model 58 Stepping 9] | 28 | 4.00 | 3.03 | 12.10 |
| Intel(R) Core(TM) i5-2400S CPU @ 2.50GHz [Family 6 Model 42 Stepping 7] | 24 | 4.00 | 3.01 | 12.04 |
| AMD A8-7600 Radeon R7, 10 Compute Cores 4C+6G [Family 21 Model 48 Stepping 1] | 10 | 4. 00 00 |
2.98 | 11.90 |
| Intel(R) Core(TM)2 Duo CPU E7500 @ 2.93GHz [Family 6 Model 23 Stepping 10] | 16 | 2.00 | 2.96 | 5.93 |
| Intel(R) Core(TM) i3-3240T CPU @ 2.90GHz [Family 6 Model 58 Stepping 9] | 13 | 4.00 | 2.94 | 11.74 |
| Intel(R) Celeron(R) CPU G1840 @ 2.80GHz [Family 6 Model 60 Stepping 3] | 20 | 2.00 | 2.92 | 5.85 |
| AMD FX(tm)-6300 Six-Core Processor [Family 21 Model 2 Stepping 0] | 28 | 6.00 | 2.92 | 17.52 |
| Intel(R) Core(TM) i5-4210U CPU @ 1.70GHz [Family 6 Model 69 Stepping 1] | 16 | 4.00 | 2.92 | 11.67 |
| Intel(R) Xeon(R) CPU E5620 @ 2.40GHz [Family 6 Model 44 Stepping 2] | 24 | 10.92 | 2.91 | 31.80 |
| Intel(R) Pentium(R) CPU G630 @ 2.70GHz [Family 6 Model 42 Stepping 7] | 18 | 2. 00 00 |
2.86 | 5.71 |
| Intel(R) Core(TM) i5-7400T CPU @ 2.40GHz [Family 6 Model 158 Stepping 9] | 17 | 4.00 | 2.85 | 11.42 |
| Intel(R) Core(TM) i5-6200U CPU @ 2.30GHz [Family 6 Model 78 Stepping 3] | 68 | 4.00 | 2.85 | 11.39 |
| Intel(R) Xeon(R) CPU E5645 @ 2.40GHz [Family 6 Model 44 Stepping 2] | 14 | 13.43 | 2.82 | 37.92 |
| Intel(R) Celeron(R) CPU G3900 @ 2.80GHz [Family 6 Model 94 Stepping 3] | 14 | 2.00 | 2.81 | 5.62 |
| Intel(R) Core(TM) i7 CPU 920 @ 2.67GHz [Family 6 Model 26 Stepping 5] | 11 | 8.00 | 2.77 | 22.12 |
| Intel(R) Pentium(R) CPU G620 @ 2.60GHz [Family 6 Model 42 Stepping 7] | 15 | 2.00 | 2.76 | 5.52 |
| Intel(R) Xeon(R) CPU E5-2620 v2 @ 2.10GHz [Family 6 Model 62 Stepping 4] | 19 | 15. 79 79 |
2.72 | 42.96 |
| 120 | 11.86 | 2.67 | 31.67 | |
| Intel(R) Core(TM) i3-5010U CPU @ 2.10GHz [Family 6 Model 61 Stepping 4] | 12 | 4.00 | 2.66 | 10.64 |
| AMD FX(tm)-6100 Six-Core Processor [Family 21 Model 1 Stepping 2] | 10 | 6.00 | 2.64 | 15.82 |
| Intel(R) Core(TM) i5-6400T CPU @ 2.20GHz [Family 6 Model 94 Stepping 3] | 40 | 4.00 | 2.64 | 10.54 |
| Intel(R) Core(TM) i5-4200U CPU @ 1.60GHz [Family 6 Model 69 Stepping 1] | 12 | 4.00 | 2.61 | 10.45 |
| Intel(R) Core(TM) i5-2410M CPU @ 2.30GHz [Family 6 Model 42 Stepping 7] | 11 | 4.00 | 2.59 | 10.36 |
| Intel(R) Core(TM) i3-7020U CPU @ 2.30GHz [Family 6 Model 142 Stepping 9] | 13 | 4.00 | 2.57 | 10.28 |
Intel(R) Core(TM) i3-3110M CPU @ 2. 40GHz [Family 6 Model 58 Stepping 9] 40GHz [Family 6 Model 58 Stepping 9] |
12 | 4.00 | 2.50 | 9.99 |
| Intel(R) Core(TM) i5-4460T CPU @ 1.90GHz [Family 6 Model 60 Stepping 3] | 20 | 4.00 | 2.50 | 9.99 |
| Intel(R) Core(TM) i3-7100U CPU @ 2.40GHz [Family 6 Model 142 Stepping 9] | 22 | 4.00 | 2.49 | 9.98 |
| Intel(R) Xeon(R) CPU E5-2650 0 @ 2.00GHz [Family 6 Model 45 Stepping 7] | 11 | 23.09 | 2.47 | 57.08 |
| Intel(R) Xeon(R) CPU E5-2620 0 @ 2.00GHz [Family 6 Model 45 Stepping 7] | 15 | 21.73 | 2.42 | 52.62 |
| BCM2835 [Impl 0x41 Arch 8 Variant 0x0 Part 0xd08 Rev 3] | 148 | 4.00 | 2.37 | 9.47 |
| Intel(R) Core(TM) i3-5005U CPU @ 2.00GHz [Family 6 Model 61 Stepping 4] | 17 | 4.00 | 2.32 | 9.29 |
| AMD A8-7410 APU with AMD Radeon R5 Graphics [Family 22 Model 48 Stepping 1] | 12 | 4. 00 00 |
2.30 | 9.20 |
| Intel(R) Core(TM) i3-6100U CPU @ 2.30GHz [Family 6 Model 78 Stepping 3] | 30 | 4.00 | 2.25 | 8.98 |
| Intel(R) Core(TM) i3-6006U CPU @ 2.00GHz [Family 6 Model 78 Stepping 3] | 24 | 4.00 | 2.20 | 8.80 |
| [Impl 0x41 Arch 8 Variant 0x0 Part 0xd03 Rev 4] | 11 | 6.91 | 2.14 | 14.77 |
| Intel(R) Pentium(R) CPU J2900 @ 2.41GHz [Family 6 Model 55 Stepping 8] | 12 | 4.00 | 1.85 | 7.40 |
| Intel(R) Celeron(R) CPU J1800 @ 2.41GHz [Family 6 Model 55 Stepping 8] | 10 | 2.00 | 1.78 | 3.56 |
| Intel(R) Core(TM) i3-4005U CPU @ 1.70GHz [Family 6 Model 69 Stepping 1] | 16 | 4.00 | 1.77 | 7.07 |
| Intel(R) Pentium(R) CPU J3710 @ 1.60GHz [Family 6 Model 76 Stepping 4] | 12 | 4.00 | 1. 74 74 |
6.95 |
| Intel(R) Pentium(R) CPU N3700 @ 1.60GHz [Family 6 Model 76 Stepping 3] | 10 | 4.00 | 1.65 | 6.61 |
| AMD A8-7600 Radeon R7, 10 Compute Cores 4C+6G [Family 21 Model 48 Stepping 1] | 14 | 4.00 | 1.60 | 6.39 |
| AMD A10-7800 Radeon R7, 12 Compute Cores 4C+8G [Family 21 Model 48 Stepping 1] | 11 | 4.00 | 1.51 | 6.04 |
| Total | 15,645 computers | 579.64 TeraFLOPS |
Generated 23 Sep 2022, 21:04:57 UTC
©2022 University of Washington
https://www.bakerlab.org
Processors ranking: GFLOPS performance — GadgetVersus
- Home page
- Processor
- GFLOPS performance
|
|
|
|
|
Processors ranking on the Geekbench 4 benchmark platform with SGEMM to get the GFLOPS power.
Note: Commissions may be earned from the link above.
This page contains references to products from one or more of our advertisers. We may receive compensation when you click on links to those products. For an explanation of our advertising policy, please visit this page.
| Geekbench 4 SGEMM — Score in GFLOPS | |
|---|---|
| Dual Intel Xeon Platinum 8375C |
5.370,0 |
| Quad Intel Xeon Platinum 8180 |
4.156,7 |
| Quad Intel Xeon Platinum 8168 |
4.030,0 |
| Quad Intel Xeon Platinum 8180M |
4.013,0 |
| Quad Intel Xeon Gold 6230 |
3.920,0 |
| Quad Intel Xeon Gold 6148 |
3.886,0 |
| AMD Ryzen Threadripper 3990X |
3.  732,0 732,0 |
| Dual Intel Xeon Platinum 8275CL |
3.500,0 |
| Dual Intel Xeon Platinum 8180M |
3.464,0 |
| Dual AMD EPYC 7763 |
3.390,0 |
| Dual Intel Xeon Platinum 8280 |
3.260,0 |
| Quad Intel Xeon Gold 6154 |
3.054,0 |
| Dual Intel Xeon Platinum 8124M |
3.000,0 |
| Dual Intel Xeon Platinum 8180 |
2.995,1 |
| Dual AMD EPYC 7713 |
2.970,0 |
| AMD Ryzen Threadripper PRO 3995WX |
2.810,0 |
| Dual Intel Xeon Platinum 8167M |
2.702,0 |
| AMD Ryzen Threadripper PRO 3975WX |
2.  690,0 690,0 |
| Quad Intel Xeon Gold 6130 |
2.675,0 |
| Intel Xeon Platinum 8275CL |
2.670,0 |
| Dual AMD EPYC 7h22 |
2.550,0 |
| Dual AMD EPYC 7742 |
2.513,0 |
| Dual Intel Xeon Gold 6148 |
2.502,0 |
| AMD EPYC 7543P |
2.480,0 |
| Dual Intel Xeon Gold 6248R |
2.464,0 |
| Intel Xeon W-3265 |
2.460,0 |
| Quad Intel Xeon Gold 6254 |
2.357,0 |
| Intel Xeon W-3175X |
2.295,0 |
| Intel Xeon W-3275 |
2.280,0 |
| Quad Intel Xeon Gold 6140 |
2.  260,0 260,0 |
| AMD EPYC 7713 |
2.230,0 |
| Octa Intel Xeon Platinum 8168 |
2.228,0 |
| Dual AMD EPYC 7662 |
2.210,0 |
| Intel Xeon Platinum 8280 |
2.190,0 |
| Intel Xeon W-3275M |
2.176,0 |
| Dual Intel Xeon Gold 6230 |
2.158,0 |
| Dual AMD EPYC 7402 |
2.124,0 |
| AMD EPYC 7702P |
2.112,0 |
| Dual Intel Xeon Platinum 8168 |
2.070,0 |
| AMD EPYC 7R32 |
2.070,0 |
| Dual Intel Xeon Gold 6142 |
1.990,0 |
| Dual Intel Xeon Gold 6254 |
1.  970,0 970,0 |
| Intel Xeon W-3265M |
1.964,0 |
| Dual AMD EPYC 7502 |
1.934,0 |
| Dual AMD EPYC 7513 |
1.930,0 |
| AMD Ryzen Threadripper 3960X |
1.898,0 |
| Intel Xeon Gold 6248R |
1.888,0 |
| Intel Xeon Platinum 8167M |
1.880,0 |
| Dual Intel Xeon Platinum 8160 |
1.872,0 |
| AMD EPYC 7532 |
1.870,0 |
Note: Commissions may be earned from the links above. These scores are only an
average of the performances got with these processors, you may get different results.
Geekbench 4 is a complete benchmark platform with several types of tests, including data compression, images, AES encryption, SQL encoding, HTML, PDF file rendering, matrix computation, Fast Fourier Transform, 3D object simulation, photo editing, memory testing. This allows us to better visualize the respective power of these devices. For each result, we took an average of 250 values on the famous benchmark software.
Disclaimer:
When you click on links to various merchants on this site and make a purchase, this can result in this site earning a commission. Affiliate programs and affiliations include, but are not limited to, the eBay Partner Network.
As an Amazon Associate I earn from qualifying purchases.
This page includes affiliate links for which the administrator of GadgetVersus may earn a commission at no extra cost to you should you make a purchase. These links are indicated using the hashtag #ad.
Information:
We do not assume any responsibility for the data displayed on our website. Please use at your own risk. Some or all of this data may be out of date or incomplete, please refer to the technical page on the respective manufacturer’s website to find the latest up-to-date information regarding the specifics of these products.
Trading System Forex
W3Ask
W3Ask Brasil
W3Ask Deutschland
W3Ask España
W3Ask France
W3Ask Italia
W3Ask Nederland
AMD Radeon and NVIDIA GeForce FP32/FP64 GFLOPS Table
JeGX
Here is the GFLOPS comparative table of recent AMD Radeon and NVIDIA GeForce GPUs in FP32 (single precision floating point) and FP64 (double precision floating point). I compiled on a single table the values I found from various articles and reviews over the web.
| GPU | FP32 GFLOPS | FP64 GFLOPS | Ratio |
| GeForce RTX 3090 | 35580 | 556 | FP64 = 1/64 FP32 |
| GeForce RTX 3080 | 29770 | 465 | FP64 = 1/64 FP32 |
| Radeon RX 6900 XT | 23040 | 1440 | FP64 = 1/16 FP32 |
| Radeon RX 6800 XT | 20740 | 1296 | FP64 = 1/16 FP32 |
| GeForce RTX 3070 | 20310 | 317 | FP64 = 1/64 FP32 |
| GeForce RTX 3060 Ti | 16200 | 253 | FP64 = 1/64 FP32 |
| Radeon RX 6800 | 16170 | 1010 | FP64 = 1/16 FP32 |
| TITAN V | 13800 | 6900 | FP64 = 1/2 FP32 |
| GeForce RTX 2080 Ti | 13450 | 420 | FP64 = 1/32 FP32 |
| Radeon RX 6700 XT | 13200 | 825 | FP64 = 1/16 FP32 |
| GeForce RTX 3060 | 12740 | 199 | FP64 = 1/64 FP32 |
| Radeon RX Vega 64 | 12700 | 790 | FP64 = 1/16 FP32 |
| GeForce GTX 1080 Ti | 11340 | 354 | FP64 = 1/32 FP32 |
| GeForce GTX 1080 Ti | 11300 | 350 | FP64 = 1/32 FP32 |
| Radeon R9 295X2 | 11264 | 1408 | FP64 = 1/8 FP32 |
| TITAN X Pascal | 11000 | 340 | FP64 = 1/32 FP32 |
| Radeon RX Vega 56 | 10500 | 656 | FP64 = 1/16 FP32 |
| GeForce RTX 2080 | 10070 | 314 | FP64 = 1/32 FP32 |
| Radeon RX 5700 XT | 9754 | 609 | FP64 = 1/16 FP32 |
| GeForce RTX 2070 SUPER | 9062 | 283 | FP64 = 1/32 FP32 |
| GeForce GTX 1080 | 8873 | 277 | FP64 = 1/32 FP32 |
| Radeon R9 Fury X | 8600 | 537 | FP64 = 1/16 FP32 |
| GeForce GTX 1070 Ti | 8100 | 253 | FP64 = 1/32 FP32 |
| Radeon HD 7990 | 7782 | 1946 | FP64 = 1/4 FP32 |
| GeForce RTX 2070 | 7465 | 233 | FP64 = 1/32 FP32 |
| Radeon RX 5600 XT | 7188 | 449 | FP64 = 1/16 FP32 |
| GeForce GTX 1070 | 6463 | 202 | FP64 = 1/32 FP32 |
| GeForce RTX 2060 | 6451 | 201 | FP64 = 1/32 FP32 |
| Radeon RX 580 | 6175 | 385 | FP64 = 1/16 FP32 |
| GeForce GTX 980 Ti | 6060 | 189 | FP64 = 1/32 FP32 |
| Radeon RX 480 | 5834 | 364 | FP64 = 1/16 FP32 |
| GeForce GTX Titan Black | 5645 | 1881 | FP64 = 1/3 FP32 |
| GeForce GTX 690 | 5622 | 234 | FP64 = 1/24 FP32 |
| Radeon R9 290X | 5632 | 704 | FP64 = 1/8 FP32 |
| GeForce GTX 1660 Ti | 5437 | 169 | FP64 = 1/32 FP32 |
| GeForce GTX 780 Ti | 5345 | 223 | FP64 = 1/24 FP32 |
| Radeon RX 5500 XT | 5196 | 324 | FP64 = 1/16 FP32 |
| Radeon HD 6990 | 5099 | 1276 | FP64 = 1/4 FP32 |
| Radeon RX 570 | 5095 | 318 | FP64 = 1/16 FP32 |
| GeForce GTX 1660 SUPER | 5027 | 157 | FP64 = 1/32 FP32 |
| GeForce GTX 1660 | 5027 | 157 | FP64 = 1/32 FP32 |
| GeForce GTX 980 | 4981 | 156 | FP64 = 1/32 FP32 |
| Radeon RX 470 | 4900 | 306 | FP64 = 1/16 FP32 |
| Radeon R9 290 | 4849 | 606 | FP64 = 1/8 FP32 |
| GeForce GTX Titan | 4709 | 1523 | FP64 = 1/3 FP32 |
| GeForce GTX 1650 SUPER | 4416 | 138 | FP64 = 1/32 FP32 |
| GeForce GTX 1060 | 4400 | 137 | FP64 = 1/32 FP32 |
| GeForce GTX 1060 6GB | 4375 | 136 | FP64 = 1/32 FP32 |
| Radeon HD 7970 GHz | 4301 | 1075 | FP64 = 1/4 FP32 |
| GeForce GTX 780 | 4156 | 173 | FP64 = 1/24 FP32 |
| Radeon R9 280X | 4096 | 1024 | FP64 = 1/4 FP32 |
| GeForce GTX 970 | 3920 | 122 | FP64 = 1/32 FP32 |
| Radeon HD 7970 | 3789 | 947 | FP64 = 1/4 FP32 |
| Radeon R9 280 | 3344 | 836 | FP64 = 1/4 FP32 |
| Radeon HD 7950 Boost | 3315 | 828 | FP64 = 1/4 FP32 |
| GeForce GTX 770 | 3210 | 134 | FP64 = 1/24 FP32 |
| GeForce GTX 680 | 3090 | 129 | FP64 = 1/24 FP32 |
| GeForce GTX 1650 | 2984 | 93 | FP64 = 1/32 FP32 |
| Radeon HD 7950 | 2867 | 717 | FP64 = 1/4 FP32 |
| Radeon HD 5870 | 2720 | 544 | FP64 = 1/5 FP32 |
| Radeon HD 6970 | 2703 | 675 | FP64 = 1/4 FP32 |
| Radeon R9 270X | 2688 | 168 | FP64 = 1/16 FP32 |
| Radeon RX 560 | 2611 | 163 | FP64 = 1/16 FP32 |
| Radeon HD 7870 | 2560 | 160 | FP64 = 1/16 FP32 |
| GeForce GTX 590 | 2488 | 311 | FP64 = 1/8 FP32 |
| GeForce GTX 670 | 2460 | 102 | FP64 = 1/24 FP32 |
| GeForce GTX 660 Ti | 2460 | 102 | FP64 = 1/24 FP32 |
| Radeon R9 270 | 2368 | 148 | FP64 = 1/16 FP32 |
| GeForce GTX 760 | 2258 | 94 | FP64 = 1/24 FP32 |
| Radeon HD 6950 | 2253 | 563 | FP64 = 1/4 FP32 |
| GeForce GTX 1050 Ti | 2138 | 66 | FP64 = 1/32 FP32 |
| Radeon HD 5850 | 2088 | 417 | FP64 = 1/5 FP32 |
| Radeon R7 260X | 1971 | 123 | FP64 = 1/16 FP32 |
| Radeon R7 265 | 1894 | 118 | FP64 = 1/16 FP32 |
| GeForce GTX 660 | 1882 | 78 | FP64 = 1/24 FP32 |
| GeForce GTX 1050 | 1862 | 58 | FP64 = 1/32 FP32 |
| Radeon HD 7790 | 1792 | 128 | FP64 = 1/14 FP32 |
| Radeon HD 7850 | 1761 | 110 | FP64 = 1/16 FP32 |
| GeForce GTX 580 | 1581 | 197 | FP64 = 1/8 FP32 |
| Radeon R7 260 | 1536 | 96 | FP64 = 1/16 FP32 |
| GeForce GTX 650 Ti Boost | 1505 | 62 | FP64 = 1/24 FP32 |
| GeForce GTX 650 Ti | 1425 | 60 | FP64 = 1/24 FP32 |
| GeForce GTX 570 | 1405 | 175 | FP64 = 1/8 FP32 |
| GeForce GTX 750 Ti | 1389 | 43 | FP64 = 1/32 FP32 |
| Radeon HD 7770 GHz | 1280 | 80 | FP64 = 1/16 FP32 |
| Radeon R7 250X | 1280 | 80 | FP64 = 1/16 FP32 |
| Radeon RX 550 | 1211 | 75 | FP64 = 1/16 FP32 |
| GeForce GT 1030 | 1127 | 35 | FP64 = 1/32 FP32 |
| GeForce GTX 750 | 1110 | 34 | FP64 = 1/32 FP32 |
| GeForce GTX 650 | 812 | 33 | FP64 = 1/24 FP32 |
| Radeon R7 250 | 806 | 50 | FP64 = 1/16 FP32 |
| GeForce GT 1010 | 751 | 31 | FP64 = 1/24 FP32 |
| GeForce GT 730 | 692 | 28 | FP64 = 1/24 FP32 |
| Radeon R7 240 | 500 | 31 | FP64 = 1/16 FP32 |
| GeForce GT 710 | 366 | 15 | FP64 = 1/24 FP32 |
| GeForce GT 210 | 39 | N. A. A. |
Workstations cards:
| GPU | FP32 GFLOPS | FP64 GFLOPS | Ratio |
| FirePro W9100 | 5240 | 2620 | FP64 = 1/2 FP32 |
GPU Computing, Graphics Cards
AMD, flops, fp32, fp64, geforce, gflops, gpu computing, NVIDIA, radeon
Understand measures of supercomputer performance and storage system capacity
On this page:
- Measure computer performance in FLOPS
- Measure storage capacity in bytes
- Prefixes for representing orders of magnitude
- Understand orders of magnitude in computer
performance - Understand orders of magnitude in storage
capacity - IU examples
Measure computer performance in FLOPS
The performance capabilities of supercomputers (for example, Indiana University’s research supercomputers) are expressed using a standard rate for indicating the number of floating-point arithmetic calculations systems can perform on a per-second basis. The rate, floating-point
operations per
second, is abbreviated as FLOPS.
Computer vendors and service providers typically list the theoretical peak performance (Rpeak) capabilities of their systems expressed in FLOPS. A system’s Rpeak is calculated by multiplying the number of processors by the clock speed of the processors, and then multiplying that product by the number of floating-point operations the processors can perform in one second on standard benchmark programs, such as the LINPACK DP TPP and HPC Challenge (HPCC) benchmarks, and the SPEC integer and floating-point benchmarks.
Measure storage capacity in bytes
Computer storage and memory capacities are expressed in units called bits and bytes. A bit is the smallest unit of measurement for digital information in computing. A byte is the number of bits a particular computing architecture needs to store a single text character. Consequently, the number of bits in a byte can differ between computing platforms. However, due to the overwhelming popularity of certain major computing platforms, the 8-bit byte has become the international standard, as defined by the International Electrotechnical Commission (IEC).
An uppercase «B» is used for abbreviating «byte(s)»; a lowercase «b» is used for abbreviating «bit(s)». This difference can cause confusion. For example, file sizes are commonly represented in bytes, but download speeds for electronic data are commonly represented in bits per second. With a download speed of 10 megabits per second (Mbps), you might mistakenly assume a 100 MB file will download in only 10 seconds. However, 10 Mbps is equivalent to only 1.25 MB per second, meaning a 100 MB file would take at least 80 seconds to download.
Prefixes for representing orders of magnitude
Orders of magnitude (in base 10) are expressed using standard metric prefixes, which are abbreviated to single characters when prepended to other abbreviations, such as FLOPS and B (for byte):
| Prefix | Abbreviation |
Order of magnitude |
Computer performance | Storage capacity |
|---|---|---|---|---|
| giga- | G | 109 | gigaFLOPS (GFLOPS) |
gigabyte (GB) |
| tera- | T | 1012 | teraFLOPS (TFLOPS) |
terabyte (TB) |
| peta- | P | 1015 | petaFLOPS (PFLOPS) |
petabyte (PB) |
| exa- | E | 1018 | exaFLOPS (EFLOPS) |
exabyte (EB) |
| zetta- | Z | 1021 | zettaFLOPS (ZFLOPS) |
zettabyte (ZB) |
| yotta- | Y | 1024 | yottaFLOPS (YFLOPS) |
yottabyte (YB) |
- Terascale: Refers to methods and processes for using supercomputers capable of performing at least 1 TFLOPS or storage systems capable of storing at least 1 TB
- Petascale: Refers to methods and processes for using supercomputers capable of performing at least 1 PFLOPS or storage systems capable of storing at least 1 PB
- Exascale: Refers to methods and processes for using supercomputers capable of performing at least 1 EFLOPS or storage systems capable of storing at least 1 EB
Understand orders of magnitude in computer performance
GigaFLOPS
A 1 gigaFLOPS (GFLOPS) computer system is capable of performing one billion (109) floating-point operations per second. To match what a 1 GFLOPS computer system can do in just one second, you’d have to perform one calculation every second for 31.69 years.
TeraFLOPS
A 1 teraFLOPS (TFLOPS) computer system is capable of performing one trillion (1012) floating-point operations per second. The rate 1 TFLOPS is equivalent to 1,000 GFLOPS. To match what a 1 TFLOPS computer system can do in just one second, you’d have to perform one calculation every second for 31,688.77 years.
PetaFLOPS
A 1 petaFLOPS (PFLOPS) computer system is capable of performing one quadrillion (1015) floating-point operations per second. The rate 1 PFLOPS is equivalent to 1,000 TFLOPS. To match what a 1 PFLOPS computer system can do in just one second, you’d have to perform one calculation every second for 31,688,765 years.
ExaFLOPS
A 1 exaFLOPS (EFLOPS) computer system is capable of performing one quintillion (1018) floating-point operations per second. The rate 1 EFLOPS is equivalent to 1,000 PFLOPS. To match what a 1 EFLOPS computer system can do in just one second, you’d have to perform one calculation every second for 31,688,765,000 years.
Understand orders of magnitude in storage capacity
Gigabyte
A gigabyte is equal to one billion bytes. You can fit 4.7 GB of data on one single-sided DVD (each DVD is about 1.2 mm, or 0.047 inches, thick).
Terabyte
A terabyte is equal to one trillion (one thousand billion) bytes, or 1,000 GB. To hold 1 TB of data, you would need about 213 single-sided DVDs (a stack that’s about 255.6 mm, or 10.06 inches, tall).
Petabyte
A petabyte is equal to one quadrillion (one thousand trillion) bytes, or 1,000 TB. To hold 1 PB of data, you would need about 212,766 single-sided DVDs (a stack that’s about 255.3 meters, or 837.67 feet, tall).
Exabyte
An exabyte is equal to one quintillion (one thousand quadrillion) bytes, or 1,000 PB. To hold 1 EB, you would need about 212,765,958 single-sided DVDs (a stack that’s about 255. 3 kilometers, or 158.65 miles, tall).
IU examples
Following are some examples of tera-, peta-, and exascale computing at IU:
- IU’s Big Red 3 system has a theoretical peak performance (Rpeak) of 934 trillion floating-point operations per second (934 teraFLOPS).
- The SDA’s tape library provides 79 PB of long-term storage capacity for research data.
- IU’s Center for Research in Extreme Scale Technologies (CREST) develops methods, technologies, and training resources to enable exascale data analysis and computation.
Console Power Comparison Chart — TheGamingSetup
The new Xbox Series X and Playstation 5 are on their way later this year, they of course tout the hottest graphics and the fastest processors, but how fast is it exactly compared to previous gens? Comparison chart below.
What are FLOPS?
FLOPS is an acronym for floating point operations per second. It is used as a general measure of performance of a processing unit.
What’s a floating point operation?
Floating point operations are required when dealing with software that uses a huge range of numbers. Software stores exponentially large or small numbers into a predictable encoded 64 bit size.
Converting these 64-bit instructions into raw numbers takes processing power. Processors can be measured in FLOPS, which refers to how fast they can turn bit instructions into numbers.
In gaming, floating point numbers are used to determine polygons and shapes. The more FLOPS a GPU can process, the faster it will be able to render a 3D scene. FLOPS
FLOPS is only one aspect of determining console power, but it helps give you an idea of what the comparative raw processing speed of a system.
Console GPU FGLOPS Comparison Table
| System | GFlops | GPU Name | ||
| Xbox Series X | 12000 | Playstation 5 | 9200 | Unknown |
| Xbox One X | 6000 | Scorpio | ||
| Playstation 4 Pro | 4200 | Neo | ||
| Xbox Series S | 4000 | Lockhart | ||
| PlayStation 4 | 1843 | Xbox One S | 1400 | Durango 2 |
| Xbox One | 1310 | Durango | ||
| Nintendo Switch (Docked) | 500 | GM20B | ||
| Nintendo Switch | GM20B | |||
| Xbox 360 | 240 | Xenos | ||
| PlayStation 3 | 230.4 |
Reality Synthesizer |
||
| Nintendo Wii U | 176 | Hollywood | ||
| Xbox | 20 | Nintendo Wii | 12 | Hollywood |
| Nintendo Gamecube | 9.4 | Flipper | ||
| PlayStation 2 | 6.2 |
Graphics Synthesizer |
||
| Nintendo 3DS | PICA200 | |||
| Dreamcast | 1.4 |
PowerVR CLX2 |
||
| Nintendo DS | 0.6 | |||
| Nintendo 64 | 0.1 |
Reality Coprocessor |
FLOPS Conversions
You might see FLOPS, GFLOPS and TFLOPS terms floating around, these are all the same measurement, just different magnitudes. A simple reference would be to compare bytes to megabytes, gigabytes and terabytes.
1000 FLOPS = 1 MFLOPS
1000 MFLOPS = 1 GFLOPS
1000 GFLOPS = 1 TFLOPS
What do the FLOPS mean for next-gen?
While the numbers are nice to have as a rough comparison of compute power, the real world difference will be less obvious, the Xbox Series X will likely have slightly better resolution or framerates in cross-platform games, but FLOPS should not be the deciding factor in which console you choose.
Exclusives, other features like SSD speeds, backward compatibility, crossplay and mouse and keyboard should be bigger factors in your decision.
90,000 comparison of the processor graphics, staircase diagram
Comparison of processor performance
rating of the Intel AMD
Comparison Intel Xeon
Comparison of the video card
9000
Comparison of the video card and processor in 2012 9000 9000 9000 9000 9000 9000 — ————————————————— ————————————-
Latest Notebook Processor July 15, 2012_CPU_Performance Ranking. doc.zip Download Down Docx.zipdownload
2012 laptop and desktop graphics card and processor ladder rating (As of September, including some mobile platforms)
2012 laptop and desktop processor rating and comparison
2012 Intel Xeon series CPU Main Parameters
————————————————— ————-
—- Intel Xeon 3000 series —— Conroe interface (dual core) LGA775 —-
Intel Xeon 3040 (1.83 GHz/2MB L2/FSB1066)
Intel Xeon 3050 (2.13 GHz/2MB L2/FSB1066)
Intel Xeon 3060 (2.40 GHz/4MB L2/FSB1066)
Intel Xeon 3070 (2.66 GHz/4MB L2/FSB1066)
—- Intel Xeon 50xx Dempsey series (dual-core, LGA771 — interface) —
5030 (2x2MB/2.67GHz/667MHz FSB/95W/DP)
5050 (2x2MB/3.00GHz/667MHz FSB/95W/DP)
5060 (2x2MB / 3.20GHz / FSB 1066MHz / Power 130W / DP)
5063 (2x2MB / 3. 20GHz / FSB 1066MHz / Power 95W / DP)
5080 (2x2MB / 3.73GHz / FSB 1066MHz / Power 130W / DP)
—- Intel® Xeon® 5100 Series, WoodCrest (dual core), 65nm, full line maximum power consumption is only 80W, LGA771 interface —-
Xeon 5110(1.6GHz/4MB L2/1066MHz FSB)
Xeon 5120(1.86GHz/4MB L2/1066MHz FSB)
Xeon 5130(2GHz/4MB L2/1333MHz FSB)
Xeon 5140(2.33GHz/4MB L2/1333MHz FSB)
XEON 5148 LV(2.33GHz/4MB L2 Cache/1333MHz FSB) 40W
Xeon 5150(2.66GHz/4MB L2/1333MHz FSB)
Xeon 5160(3GHz/4MB L2/1333MHz FSB)
Intel® Xeon® Processor 5200 Series Dual Core 45nm Intel® Processor
2 5300 Quad-Core 65nm 8MB L2 Cache
Intel® Xeon® Processor 5400 Series 45nm Quad-Core 12MB L2 Cache
Intel® Xeon® Processor 5500 Series 45nm
Intel® Xeon® Processor 5600 Series 32nm
—- Sandy Bridge (four cores, four or eight threads) —-
Xeon E3-1200 series processors based on the new Sandy Bridge architecture can be roughly divided into three parts;
One of them is the five series E3-12×0 without GPU graphics core, which were listed earlier
Xeon E3-1280: quad-core, eight-thread, 3. 5 GHz, dynamic acceleration up to 3.9 GHz, cache 3 levels 8 MB, official price — $612.
Xeon E3-1270: Quad-core, eight-thread, 3.4GHz base frequency, 3.8GHz dynamic boost, 8MB L3 cache, US$328 official price.
Xeon E3-1240: quad-core, eight-thread, 3.3 GHz, dynamic acceleration up to 3.7 GHz, 8 MB L3 cache, $250 official price.
Xeon E3-1230: quad-core, eight-thread, 3.2 GHz, dynamic acceleration up to 3.6 GHz, 8 MB L3 cache, official price $215.
Xeon E3-1220: quad-core, quad-thread, 3.1 GHz, dynamic boost up to 3.5 GHz, 8 MB L3 cache, list price $189.
Xeon E3-1280 thermal power consumption 95W, the other four thermal power consumption 80W.
The second is four E3-12×5 series with the same GPU. Xeon E3-12×5 series is closer to Sandy Bridge Core i7/i5/i3 on desktop, but the specifications are more powerful and the functions are more complete: 32nm process manufacturing, LGA1155 case interface, case temperature 72.6℃, thermal power consumption 95W, dual-channel DDR3-1333/1066.
Xeon E3-1275: quad-core, eight-thread, 3.4GHz, dynamic boost up to 3.8GHz, 8MB L3 cache, list price $339 .
Xeon E3-1245: quad-core, eight-thread, 3.3GHz, dynamic boost up to 3.7GHz, 8MB L3 cache, official price is $262.
Xeon E3-1235: quad-core, eight-thread, 3.2 GHz, dynamic acceleration up to 3.6 GHz, 8 MB L3 cache, $240 official price.
Xeon E3-1225: Quad-core, four threads, 3.1 GHz, dynamic acceleration up to 3.4 GHz, 8 MB L3 cache, list price $194.
Three — two special low power and energy saving versions.
Xeon E3-1260L, 4 cores, 8 threads, 2.4 GHz base frequency, 3.3 GHz dynamic boost, 8 MB L3 cache, HD Graphics 2000 integrated graphics 650-1250 MHz , consumed thermal power 45 W;
Xeon E3-1220L, dual-core, four threads, 2.2 GHz base clock, dynamic boost up to 3.4 GHz, 3 MB L3 cache, no graphics core, 20 W thermal power consumption.
—- 6-core processor —-
Processor number Δ L2 cache L3 cache Clock frequency (base frequency) FSB System type Power Number of cores
X7460 9MB 16MB 2. 66GHz 1066 MHz, 130 W multiplex 6
L7455
2012 Desktop Processor Ranking Desktop Processor Performance Comparison Home CPU Comparison Table
———————- ————————————————— —————-
Latest and Most Complete 146 CPU Performance Ratings in May 2010
———————————————— ———————
The French website BeHardware launched a real super catastrophic CPU evaluation using a total of 146 dual-core, triple-core, quad-core and six-core Intel and AMD processors, testing 12 designs and getting a total of 1752 results.
Test platform includes:
Motherboard: ASUS P5QC (LGA775)
Intel DP55KG (LGA1156)
Intel DX58SO (LGA1366)
ASUS M4A79-T (AM3 / AM2)
: 2x2GB DDR3-1333 7-7-7
2x2GB DDR3-1066 7-7-7
2x2GB DDR2-1066 5-5-5
2x2GB DDR2-800 4-4-4
Graphics: GeForce GTX 280 + GeForce 190. 62 driver
Hard Drive: Western Digital Raptor 74GB + Raptor 150GB
Sound Card: innovation Audigy
Operating system: Windows 7 64bit
The average test rating, based on the Core 2 Quad Q6600 estimate, is converted from 100 points
in 2008 Matbe from France made 100 super cross-comment processors.
———————————————— —————————————————
PConline evaluation room April 6, 2009 ——
————————————————— ——————
The benchmark score for some mobile processors is CineBench R10 benchmark score. The score of the test may be affected by other accessories such as the memory/video cards of the entire machine.
Microsoft Learn
- Article
- Reading takes 46 minutes
This guide provides detailed methods that you can use to investigate issues with central processing units (CPUs) that affect evaluation metrics.
The individual metrics or issues sections in the analysis guides for specific assessments identify common issues to investigate. This guide contains methods and tools that you can use to investigate these issues.
This guide uses the Windows Performance Analyzer (WPA) from the Windows Performance Toolkit (WPT). WPT is part of the Windows Assessment and Deployment Kit (Windows ADK) and can be downloaded from the Windows Insider Program. For more information, see the Windows Productivity Toolkit Technical Reference.
This manual is organized into the following three sections:
|
Background |
This topic describes how to manage CPU resources in Windows 10. |
|
Tools WINDOWS ADK |
This section explains how to view and interpret CPU information in the WINDOWS ADK. |
|
Techniques |
This section contains a set of methods that you can use to investigate and resolve common CPU performance issues. |

Historical
This section contains simple descriptions and basic discussion of CPU performance. For a more comprehensive study of this topic, we recommend the book Windows Internals, Fifth Edition.
Modern computers may contain multiple CPUs installed in separate sockets. Each CPU can host multiple physical processor cores, each of which can simultaneously process one or two separate instruction streams. These individual instruction stream handlers are managed by the Windows operating system as logical processors.
In this manual, processor and CPU refer to a logical processor, which is a hardware device that an operating system can use to execute program instructions.
Windows 10 actively manages processor hardware in two main ways: power management, balancing power consumption and performance; as well as using to balance the processing requirements of programs and drivers.
Processor power management
Processors do not always exist in an operational state. If the instructions are not ready to execute, Windows places the processor in the target idle state (or C-State) as defined by Windows Power Manager. Based on CPU usage patterns, the target CPU state of the processor will adjust over time.
Idle states are numbered states from C0 (active, not idle) through gradually low-level states. These states include C1 (stopped but the clock is still on), C2 (stopped and the clock is off), and so on. The implementation of idle states depends on the processor. However, the higher state count across all processors reflects lower power consumption, but also longer wait times before the processor can return to processing instructions. The time spent in idle states has a significant impact on power usage and battery life.
Some processors may operate in the performance (P-) and throttling (T-) states even while they are actively processing instructions. P-states determine the clock frequency and voltage levels supported by the processor. T-states do not directly change the frequency of time, but can reduce the effective speed of the clock by skipping processing actions on some fractions of clock ticks. Together, the current states of P- and T determine the effective frequency of the processor. Lower frequencies correspond to lower performance and lower power consumption.
Windows Power Manager determines the appropriate P- and T state for each processor based on CPU usage patterns and system power policy. The time spent in high performance states versus low performance states significantly impacts power usage and battery life.
Controlling CPU usage
Windows uses three basic abstractions to control CPU usage.
Processes and threads
All user-mode programs in Windows run in the context of process . The process includes the following attributes and components:
-
Virtual address space
-
Priority class
-
Loaded program modules
-
Environment and configuration information
-
At least one thread
Although processes contain program modules, context, and environment, they are not intended to run directly on the processor. Instead, threads owned by a process must run on the processor.
The thread maintains execution context information. Almost all computations are managed as part of a thread. The activity of the thread significantly affects the performance and performance of the system.
Since the number of processors in the system is limited, all threads cannot run at the same time. Windows implements processor time sharing, which allows a thread to run for a specified period of time before the processor switches to another thread. The action of switching between threads is called context switch and is performed by a Windows component called Manager . The dispatcher makes thread scheduling decisions based on priority , ideal processor and affinity , quantum , and state .
Priority
Priority is a key factor in how the dispatcher selects a thread to run. The thread’s priority is an integer between 0 and 31. If the thread is executable and has a higher priority than the current thread, the lower priority thread is immediately preempted and the higher priority thread is context switched.
If a thread is running or ready to run, no lower priority thread can run unless there are enough processors to run both threads simultaneously, or if the higher priority thread can only run on a subset of the available processors. Threads have a base priority that can be temporarily raised to higher priorities at certain times: for example, when a process owns the foreground window or after I/O has completed.
Ideal processor and affinity
A thread’s ideal processor and affinity determine the processors on which the thread is scheduled to run. Each thread has an ideal processor set by the program or automatically by Windows. Windows uses a round robin technique to ensure that each processor is assigned an approximately equal number of threads. Whenever possible, Windows schedules a thread to run on an ideal processor, but a thread can sometimes run on other processors.
A thread’s processor affinity limits the processors on which a thread will run. This is a stronger constraint than the ideal thread processor attribute. The program sets the affinity with SetThreadAffinityMask . Affinity can prevent threads from running on certain processors.
Quantum
Context switches are expensive operations. Windows usually allows each thread to run for a certain amount of time, called to quantum before it moves to another stream. Quantum duration is intended to maintain the apparent speed of the system’s response. It maximizes throughput while minimizing context switch overhead. Quantum duration can vary between clients and servers. The quantum duration is typically longer on the server to increase throughput at the expense of apparent responsiveness. On client computers, Windows assigns shorter quantums overall, but provides a longer quantum stream associated with the current foreground window.
State
Each thread exists in a specific execution state at any given time. Windows uses three states related to performance. The following values are: «Running «, « Done «, and «Waiting «.
Threads that are currently running are in state «Running «. Threads that can run but are not currently running are in state ready . Threads that cannot run because they are waiting for a particular event are in state waiting .
The transition from state to state is shown in fig. 1. Flow state transitions:
1. Flow State Transitions
1. The thread state transitions are described below.
-
A thread in the running state initiates a transition to the wait state by calling a wait function such as WaitForSingleObject or Sleep(> 0) .
-
A running thread or kernel operation reads a thread in a waiting state (for example, SetEvent or timer expiration). If the processor is idle, or if the prepared thread has a higher priority than the currently running thread, then the prepared thread may switch directly to the «Running» state.
 Otherwise, it is placed in the ready state.
 -
A thread in the ready state is scheduled to be processed by the dispatcher when a running thread waits, returns (Sleep(0)) , or reaches the end of its quantum.
-
A thread in the «Running» state is switched and placed in the ready state by the dispatcher when it is preempted by a higher priority thread, returns (Sleep(0)) or when its quantum ends.
A thread that exists in a waiting state does not necessarily indicate a performance problem. Most threads spend a significant amount of time waiting, which allows processors to enter idle states and conserve power. The state of a thread becomes an important performance factor only when the user is waiting for the thread’s operation to complete.
CPU and isR
In addition to processing threads, processors respond to notifications from hardware devices such as network cards or timers. When a hardware device needs the processor’s attention, it generates interrupt . Windows responds to a hardware interrupt by suspending the currently executing thread and executing the ISR associated with the interrupt.
During the execution of an ISR, a handler can be disabled by handling any other action, including other interrupts. For this reason, isR must terminate quickly or system performance may be degraded. To reduce execution time, ISRs typically schedule operations to be executed in response to an interrupt. For each logical processor, Windows maintains a queue of scheduled CPUs. DpCs take precedence over threads at any priority level. Before the processor returns to the processing threads, it executes all the CPUs in the queue.
While executing by CPU and isR handler, threads cannot run on this processor. This property can cause problems with streams that must perform work at a specific bandwidth or time, such as a stream that plays audio or video. If the CPU time used to execute the CPU and isR does not allow these threads to receive enough processing time, the thread may not reach the required throughput or complete work items on time.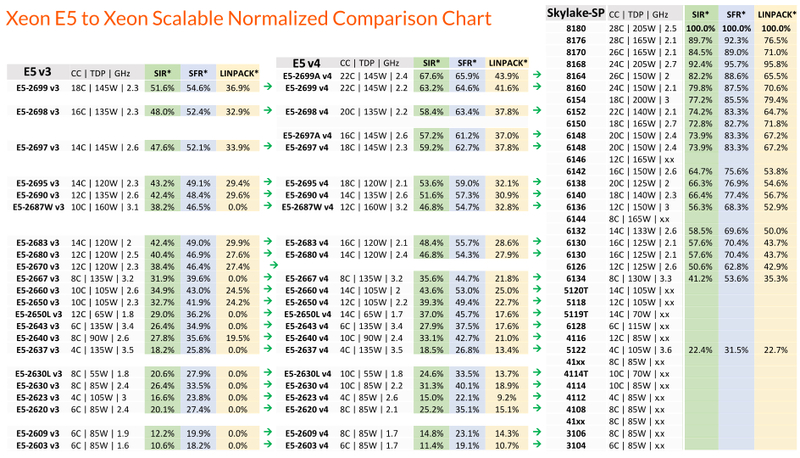
WINDOWS ADK Tools
The Windows ADK writes hardware information and scores to score files . WPA provides detailed information about CPU usage in various graphs. This section explains how to use Windows ADK and WPA to collect, view, and analyze CPU performance data.
Windows ADK evaluation results files
Since Windows only supports symmetric multiprocessor systems, all information in this section applies to all installed CPUs and cores.
Detailed CPU hardware information is available in the EcoSysInfo section of the evaluation results files on the node.
Example:
The name of the first CPU The maximum frequency of the first CPU The total number of processors The total number of cores The total number of logical processors ...and so on...
WPA graphs
After loading the trace into WPA, you can find information about the processor hardware in sections Trace/System Configuration/General and Trace/System Configuration/PnP of the WPA user interface.
Note All procedures in this guide are performed in WPA.
CPU Idle States Graph
If idle state information is collected in a trace, CPU Idle State Graph will be displayed in the WPA user interface. This graph always contains the idle state of the target for each processor. The graph will also contain information about the actual idle state of each processor, if that state is supported by the processor.
Each row in the following table describes the idle state change for the target or actual processor state. The following columns are available for each row in the graph:
|
CPU |
Processor affected by state change. |
|
Entry time |
The time the processor entered the idle state. |
|
Exit time |
Processor recovery time from idle state. |
|
Max:Duration(ms) |
Time spent in idle state (default aggregation:maximum). |
|
Min:Duration(ms) |
Time spent in idle state (aggregation default: minimum). |
|
Next state |
The state the processor enters after the current state. |
|
Status prev |
The state from which the processor transitioned to the current state. |
|
Status |
Current idle state. |
|
State (Numeric) |
Current idle state as a number (eg 0 for C0). |
|
Sum:Duration(ms) |
Time spent in idle state (default aggregation:sum). |
|
Table |
Not used |
|
Type |
Target (for the selected Power Manager target state for the processor) or Actual (for the actual processor idle state). |

The default WPA profile provides two presets for this graph: state by Type, CPU and State Diagram by Type, CPU .
State by type, CPU
The target and actual states of each CPU are graphed together with the state number on axis Y in state by type, CPU column . Figure 2 CPU Idle States by CPU Type displays the actual CPU state as it changes between active and target idle states.
Fig. 2. CPU Idle State by Type, CPU
Status Chart by Type, CPU
In this graph, the target and actual states of each CPU are presented in a timeline format.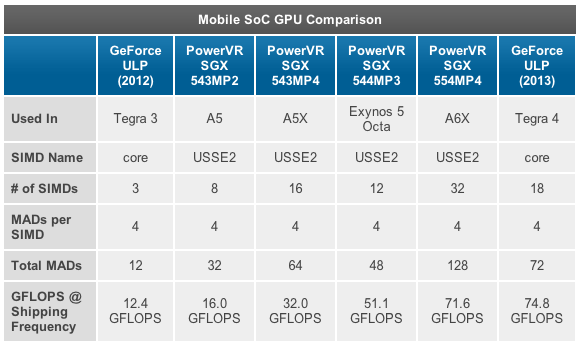 Each state has a separate line on the timeline. On fig. Figure 3 CPU Idle Status Chart by Type, CPU displays the same data as Figure 2 CPU Idle States by Type, CPU in Timeline View.
Fig. 3. CPU Idle State Status Chart by Type, CPU
CPU Frequency Graph
If the CPU frequency data was collected on a system that supports multiple P or T states, CPU Frequency Graph will be available in the WPA UI. Each row in the following table represents time at a particular processor frequency level. Column frequency (MHz) contains a limited number of frequencies corresponding to the P and T states supported by the processor. The following columns are available for each row in the graph:
|
% duration |
The duration is expressed as a percentage of the total CPU time for the current visible time period. |
|
Count |
Number of frequency changes (always 1 for individual lines). |
|
CPU |
CPU affected by frequency change. |
|
Entry time |
The time the CPU entered the P state. |
|
Exit time |
CPU exit time from P-state. |
|
Frequency (MHz) |
The frequency of the CPU during the time it is in the P-state. |
|
Max:Duration(ms) |
Time spent in P-state (default aggregation: maximum). |
|
Min:Duration(ms) |
Time spent in P-state (default aggregation: minimum). |
|
Sum:Duration(ms) |
Time spent in P-state (default aggregation: sum). |
|
Table |
Not used |
|
Type |
Learn more about P-State. |

The default profile determines the frequency according to CPU presets for this graph.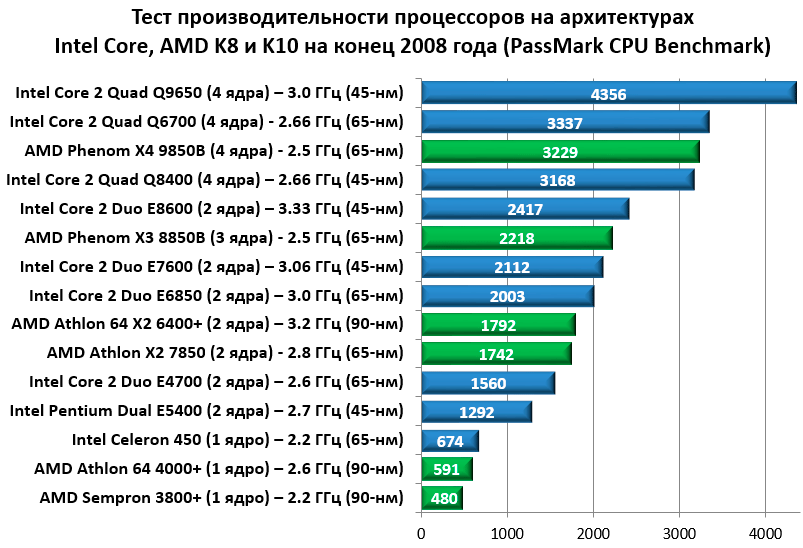 Figure 4 CPU Clock by CPU Displays CPU in Three State Transition P:
Figure 4 CPU Clock by CPU
CPU Usage (Example) Graph
Data displayed in CPU Usage Graph (sample) , represent examples of CPU activity that occur at a regular sampling interval. In most traces, this is one millisecond (1 ms). Each row in the table represents one example.
Sample weight represents the value of this sample relative to other samples. The weight is equal to the timestamp of the current example minus the timestamp of the previous example. The weight is not always equal to the sampling interval due to fluctuations in system state and activity.
Fig. 5 CPU Sampling represents the data collection method:
Figure 5. CPU Sampling
Any CPU actions that occur between instances are not recorded by this sampling method. Thus, activities with very short duration, such as CPU and isR, are not presented in column 9. 0017 CPU sampling .
The following columns are available for each row in the graph:
The weight is expressed as a percentage of the total CPU time spent in the current visible time range.
Address
The memory address of the function that is at the top of the stack.
All meters
The number of samples represented by the row. This number includes examples that are accepted when the processor is idle. For individual rows, this column is always 1.
Count
The number of samples represented by the string, excluding examples that are taken when the processor is idle. For individual rows, this column is always 1 (or 0 if the CPU was in a low power state).
CPU
Index 0 of the CPU on which this example was taken.
Display name
The display name of the active process.
DPC/ISR
Whether the sample is measuring regular CPU usage, DPC/ISR, or low power.
Function
Function at the top of the stack.
Module
Module containing the function at the top of the stack.
Priority
The priority of the running thread.
Process
The name of the process image that owns the running code.
Process name
Full name (including process ID) of the process that owns the executing code.
Stack
The stack of the running thread.
Flow ID
ID of the running thread.
Flow start function
The function with which the running thread is started.
Flow Launcher
Module containing the function to start a thread.
TimeStamp
The time the selection was made.
Weight
The time (in milliseconds) represented by the sample (i.e., the time of the last sample).
The default profile provides the following presets for this graph:
-
CPU usage
-
Use by priority
-
Use by process
-
Use by process and flow
CPU Usage
The CPU Usage by CPU chart shows the distribution of work between processors. On fig. Figure 6 CPU usage by CPU shows this distribution for two CPUs:
Figure 6. CPU usage by CPU
Usage by priority
CPU usage grouped by thread priority shows how high priority threads are affected with low priority. Figure 7 CPU usage (sample) by priority displays the following graph:
Fig. 7. CPU usage (sample) by priority
Usage by process
CPU usage grouped by process shows relative usage of processes. Figure 8 CPU usage (sample) by process shows this preset. This graph example shows that one process consumes more CPU time than other processes.
Fig. 8 CPU usage (sample) by process
Usage by Process and Thread
CPU Usage , grouped by process and then grouped by thread, shows the relative usage of processes and threads in each process. Figure 9 CPU usage (sample) by process and thread shows this preset. Threads of one process are selected in this column.
Fig. 9. CPU usage (sample) by processes and threads
CPU usage graph (exact)
CPU usage graph data (fine) records information related to context switch events. Each row represents a set of data associated with one context switch; that is, when the thread starts. Data is collected for the following sequence of events:
-
The new stream is shut down.
-
A new thread is ready to be started using a ready thread.
-
The new thread is switched, thereby switching the old thread.
-
The new thread is switched off again.
In Figure 10 Exact CPU Usage Diagram, time passes from left to right. The chart labels correspond to the column names in column «CPU Usage (exact version). Labels for columns of timestamp are displayed at the top of the chart, and labels for columns of time interval are displayed at the bottom of the chart.
Figure 10. Accurate chart of CPU usage
Timeline breaks in fig. 10. Accurate CPU usage pattern divides the timeline into regions that can occur simultaneously on different CPUs. These timelines may overlap as long as the order of the numbered events is not changed. For example, a ready thread might run on processor-2 at the same time when the new thread switches, and then again on processor-1).
Information is recorded for the following four targets on the timeline:
-
New stream , which is the stream that was switched. This is the main focus of this line in the graph.
-
Stream NewPrev , which refers to the previous switch time of the new stream.
-
Preparing thread , which is the thread that prepared the new thread for processing.
-
Old stream that was switched when the new stream was switched.
The data in the following table is per target thread:
|
CPU usage of a new thread after it has been switched. This value is expressed as a percentage of the total CPU time for the current visible time period. |
|
|
Count |
The number of context switches represented by the string. This is always 1 for individual rows. |
|
Count:Waits |
The number of waits represented by the string. This is always 1 for individual rows, except when the thread switches to an idle state; in this case it is set to 0. |
|
CPU |
CPU on which a context switch has occurred. |
|
CPU usage (ms) |
New thread CPU usage after context switch. This is equal to NewInSwitchTime but displayed in milliseconds. |
|
IdealCpu |
The ideal CPU selected by the scheduler for the new thread. |
|
LastSwitchOutTime(s) |
The last time the new thread was shut down. |
|
NewInPri |
New stream switching priority. |
|
NewInSwitchTime(s) |
NextSwitchOutTime(s) minus SwitchInTime(s) |
|
NewOutPri |
The priority of the new thread when it exits. |
|
NewPrevOutPri |
The priority of the new thread when it was previously disabled. |
|
NewPrevState |
The state of the new thread after it was previously disabled. |
|
NewPrevWaitMode |
Waiting for a new thread when it was previously disabled. |
|
NewPrevWaitReason |
Reason for disabling the new thread. |
|
NewPriDecr |
Priority boost affecting thread. |
|
NewProcess |
New thread process. |
|
Name NewProcess |
Process name of the new thread, including PID. |
|
NewQnt |
Not used. |
|
NewState |
Status of the new stream after it has been switched. |
|
NewThreadId |
Thread ID of the new thread. |
|
NewThreadStack |
The stack of a new thread when it is switched. |
|
NewThreadStartFunction |
The start function of the new thread. |
|
NewThreadStartModule |
The start module of a new thread. |
|
NewWaitMode |
Waiting for a new thread. |
|
NewWaitReason |
Reason for disabling the new thread. |
|
NextSwitchOutTime(s) |
Time of the next switch of the new stream. |
|
OldInSwitchTime(s) |
Old stream switching time before it is disabled. |
|
OldOutPri |
The priority of the old thread when it is turned off. |
|
Old Process |
The process that owns the old thread. |
|
Name OldProcess |
The name of the process that owns the old thread, including the PID. |
|
OldQnt |
Not used. |
|
Old State |
Status of the old thread after it was shut down. |
|
OldThreadId |
Thread ID of the old thread. |
|
OldThreadStartFunction |
The initial function of the old thread. |
|
OldThreadStartModule |
Starter module of the old thread. |
|
OldWaitMode |
Old thread wait mode. |
|
OldWaitReason |
Reason for shutting down the old thread. |
|
PrevCState |
Previous CSstate of the processor. If the value is not 0 (active), the processor was idle before the new thread switched to context. |
|
Finished |
SwitchInTime(s) minusReadyTime(s) |
|
Preparing ThreadId |
Provisioning stream ID. |
|
Prepare ThreadStartFunction |
Ready stream start function. |
|
Prepare ThreadStartModule |
Ready stream start module. |
|
ReadyingProcess |
The process that owns the ready thread. |
|
Name ReadyingProcess |
The name of the process that owns the ready thread, including the PID. |
|
ReadyThreadStack |
Ready stream stack. |
|
ReadyTime(s) |
New stream preparation time. |
|
SwitchInTime(s) |
New stream switching time. |
|
TimeSinceLast(s) |
SwitchInTime(s) minus LastSwitchOutTime(s) |
|
Waiting(s) |
ReadyTime (s) minus LastSwitchOutTime (s) |


The default profile uses the following presets for this graph:
-
CPU Timeline
-
Process Timeline, Flow
-
Use by priority when starting a context switch
-
CPU usage
-
Usage by process, flow
CPU timeline
CPU usage The CPU timeline shows the distribution of work between processors. On fig. 11 CPU Usage Timeline (Fine) by CPU shows the timeline on an eight processor system:
Fig. 11 CPU usage (fine) timeline by CPU
Timeline by process, thread
CPU usage on the timeline for each process per thread shows which processes were running at a specific time. In Figure 12, the (exact) timeline by process thread shows this timeline across multiple processes:
12 Use (accurate) timeline by process, flow
Usage by priority at start of context switch
This graph defines bursts of high priority thread activity at each priority level. Figure 13 CPU usage (exact) by priority during context switching at the initial stage shows the distribution of priorities:
13. CPU Usage (Fine) by Priority at Start of Context Switch
CPU Usage
In this graph, CPU usage is grouped and plotted by CPU to show how work is distributed across processors.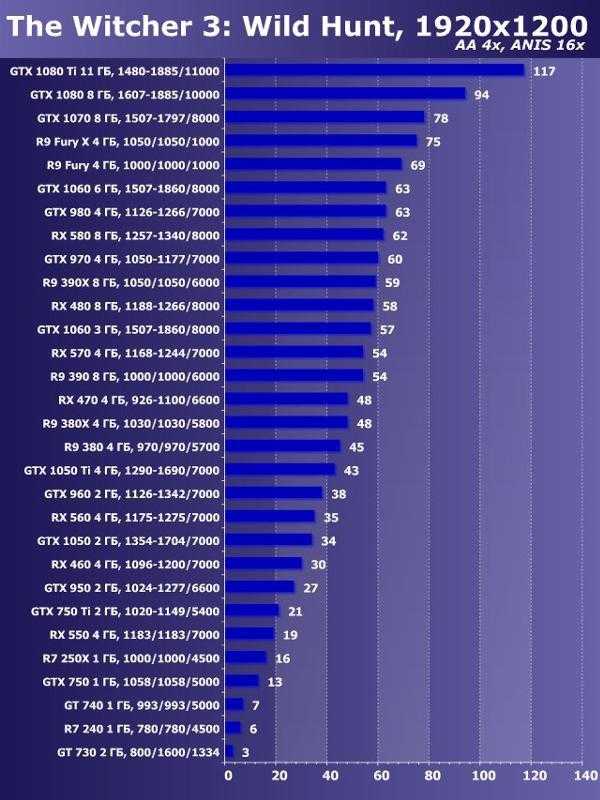 On fig. 14 CPU Utilization (Exact) CPU Utilization shows this graph for a system with eight processors.
Fig. 14 CPU Usage (Exact) by CPU
Usage by Process, Thread
In this graph, CPU usage is grouped first by process and then by thread. It shows the relative usage of processes and threads in each process. Figure 15 CPU (exact) usage per process, thread shows this distribution across multiple processes:
15 CPU usage (fine) by process, thread
Graph DPC/ISR
Graph DPC/ISR is the main source of DPC/ISR data in WPA. Each line in the graph represents a fragment, which is a period of time during which the DPC or ISR was running continuously. Data is collected at the beginning and end of fragments. Additional data is collected after the completion of the DPC/ISR. Figure 16 DPC/ISR shows how it works:
16 Diagram DPC/ISR
16 The DPC/ISR schema describes the data collected during the following activities:
-
DPC/ISR-A starts.
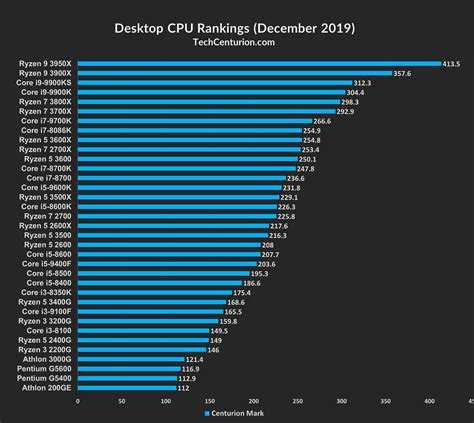
-
Interrupting a device that has a higher interrupt level than DPC/ISR-A results in interrupt isR-B interrupt DPC/ISR A , thereby ending the first fragment DPC/ISR-A .
-
ISR-B terminates and thus ends fragment of ISR-B . DPC/ISR-A resumes execution in the second fragment.
-
DPC/ISR-A ends, thereby ending the second fragment DPC/ISR-A .
A row for each fragment is displayed in the data table. Fragments DPC/ISR-A share identical information with columns without fragments.
DPC/ISR graph columns describe fragment level information or DPC/ISR level columns. Each fragment differs from data in fragment level columns and identical data in DPC/ISR columns.
|
% duration (fragmented) |
Duration (fragmented), expressed as a percentage of the total CPU time in the current visible time period. |
|
% exclusive duration |
Exclusive duration expressed as a percentage of the total CPU time in the current visible time period. |
|
% inclusive duration |
Inclusive time expressed as a percentage of the total CPU time in the current visible time period. |
|
Address |
Memory address of the DPC or ISR function. |
|
Count (DPCs/ISR) |
The number of dpcs/ISRs represented by this line. This is always 1 for lines representing the final DPC/ISR fragment; otherwise, this number is 0. |
|
Count (Fragments) |
The number of fragments represented by the string. This is always 1 for individual rows. |
|
CPU |
Index of the logical processor running the DPC or ISR. |
|
Type DPC |
For DPC, the DPC type is normal or timer. |
|
DPC/ISR 9 insertion time0003 |
Trace time when starting DPC/ISR. |
|
DPC/ISR exit time (s) |
Time from trace start to end of DPC/ISR. |
|
Duration (Fragmented) (ms) |
Fragment exit time (s) minus fragment input time (s) in milliseconds. |
|
Exclusive Duration (ms) |
Sum of fragmented durations in ms. for all fragments of this DPC/ISR. |
|
Fragment |
If the DPC/ISR of this line contains multiple fragments, this value is True ; otherwise, false . |
|
Fragment |
If this was not the only fragment for the given DPC/ISR, this value is True ; otherwise, false . |
|
Fragment input time (s) |
Fragment start time. |
|
Fragment release time (s) |
Fragment execution stop time. |
|
Function |
DPC or ISR function started. |
|
Inclusive duration (ms) |
DPC/ISR Exit Time (s) minus DPC/ISR Enter Time (s) in milliseconds. |
|
MessageIndex |
Interrupt index for interrupts signaled by a message. |
|
Module |
Module containing the DPC or ISR function. |
|
Return value |
DPC/ISR return value |
|
Type |
Event type; it’s either a DPC or an interrupt (ISR). |
|
Vector |
Device interrupt vector value. |

 This value is empty for isR.
The default profile uses the following presets for this graph:
-
[DPC,ISR,DPC/ISR] Duration by CPU
-
[DPC,ISR,DPC/ISR] Modulo duration, functions
-
[DPC,ISR,DPC/ISR] Modulo time scale, functions
[DPC,ISR,DPC/ISR] CPU Duration
DPC/ISR events are aggregated by the CPU they ran on and sorted by duration.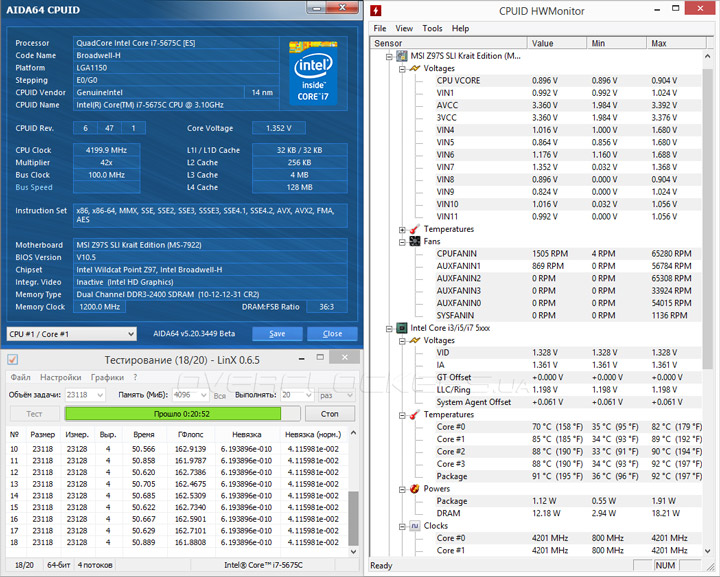 This graph shows the distribution of DPC activities across CPUs. Figure 17 DPC/ISR Duration by CPU shows this graph for a system with eight processors.
Fig. 17 DPC/ISR duration by CPU
[DPC,ISR,DPC/ISR] Modulo duration, functions
DPC/ISR events are aggregated in this column by DPC/ISR routine module and function and sorted by duration. This example shows which DPC/ISR routines use the most time in fig. 18 DPC/ISR Duration by Module, Function shows the time period during which the DPC/ISR action is executed in two modules:
Figure 18 DPC/ISR Duration by Module, Function
[DPC,ISR,DPC/ISR] Timeline by module, functions . They are graphed as a timeline. This graph provides a detailed view of the time period during which dpcs/ISRs were running. This graph also shows how individual DPC/ISRs can be fragmented. In Figure 19 DPC/ISR Timeline by Module, Function shows the action timeline in three modules:
Fig. 19 DPC/ISR Timeline by Module, Function
Stack Trees
Stack Trees appear in tables CPU usage (sample), CPU usage (fine) and DPC/ISR in WPA, and in problems reported in evaluation reports. Call stack stack trees associated with multiple events over a period of time. Each node in the tree represents a stack segment that is shared by a subset of events. The tree is created on the basis of individual stacks and is shown in Figure 20 stacks of three events:
Figure 20. Stacks of three events
Figure 21 Common Segments Identified shows how common sequences are defined for this graph: based on stacks, showing how common segments are combined to form tree nodes:
0002 Column Stacks in the WPA user interface contains an expander for each non-end node. For problems reported on the score, the tree is displayed along with the aggregate weights. Some branches can be removed from the graph if their weights do not meet a given threshold. The stack below shows how the events above appear as part of the issue reported by the score.
 5ms ModuleA!Function1
5ms ModuleA!Function2
5ms ModuleA!Function3
      |
4ms |-ModuleA!Function4
4ms | ModuleB!Function1
|   |
1ms | |-ModuleB-Function2
1ms | | ModuleB-Function3
|   |
3ms | |-ModuleB!Function3
3ms | ModuleB!Function4
      |
1ms |-ModuleA!Function5
1msModuleC!Function1
1msModuleC!Function2
Node on the stack represents the time when the function itself is at the top of the stack. Node does not include time spent in functions called by the parent function. This duration is called the exclusive time spent on the function.
For example, Function 1 calls Function2 . Function 2 spent 2ms in a CPU intensive loop and called another function that was running for 4ms. This can be represented by the following stack:
 6ms ModuleA!Function1
      |
2ms |-
4ms |-ModuleA!Function2
4msModuleB!Function3
4msModuleB-Function4
Methods
This section describes the standard approach to performance analysis. It provides methods that you can use to investigate common CPU-related performance issues.
Performance analysis is a four-step process:
-
Identify the scenario and problem.
-
Determine the components involved and the corresponding time range.
-
Create a model of what was to happen.
-
Use the model to identify problems and investigate root causes.
Scenario and Problem Definition
The first step in performance analysis is to clearly define the scenario and problem. Many performance issues affect scenarios measured by evaluation metrics. Example:
Scenario 1: A physical resource is not fully utilized.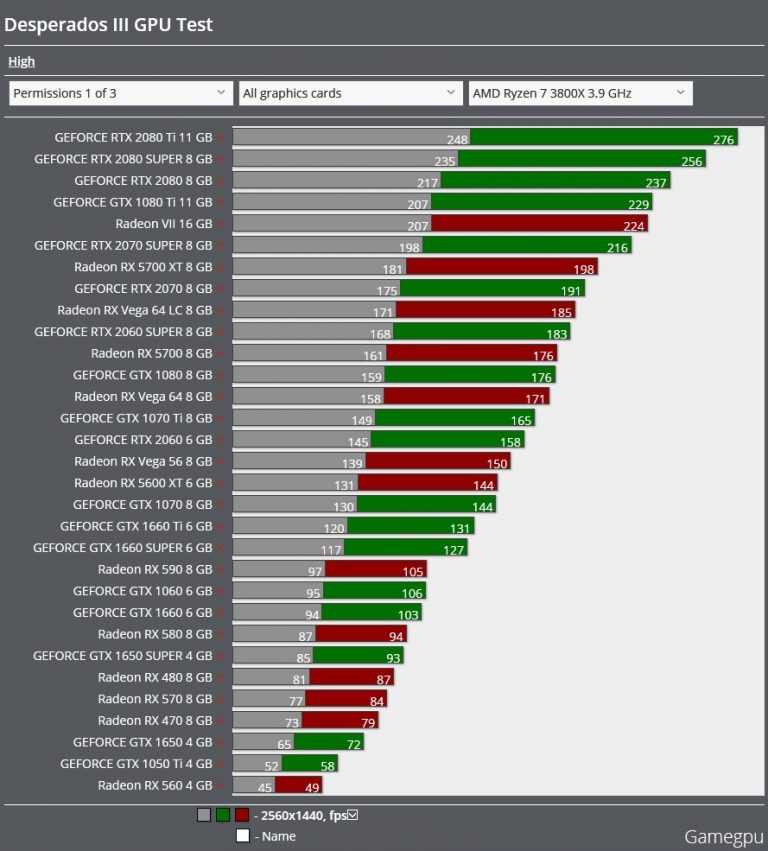 For example, the server cannot fully utilize the network connection because it cannot encrypt packets fast enough.
Scenario 2: A physical resource is being used more than it should be. For example, the system uses significant CPU resources during idle time using battery power.
Scenario 3. Actions are not performed at the required rate. For example, frames are dropped during video playback because the frames are not decoded fast enough.
Scenario 4. An action has been delayed. For example, the user launched Internet Explorer, but the tab took longer than expected to open.
Scenarios 3 and 4 related to CPU resources are covered in this guide. Scenarios 1 and 2 are out of scope and not considered. To analyze these problems, you can start with an ambiguous observation such as «too slow» and ask additional questions to determine the scenario and the exact problem.
Identify components and time period
Once you have identified the scenario and problem, you can determine the components involved and the time period you are interested in.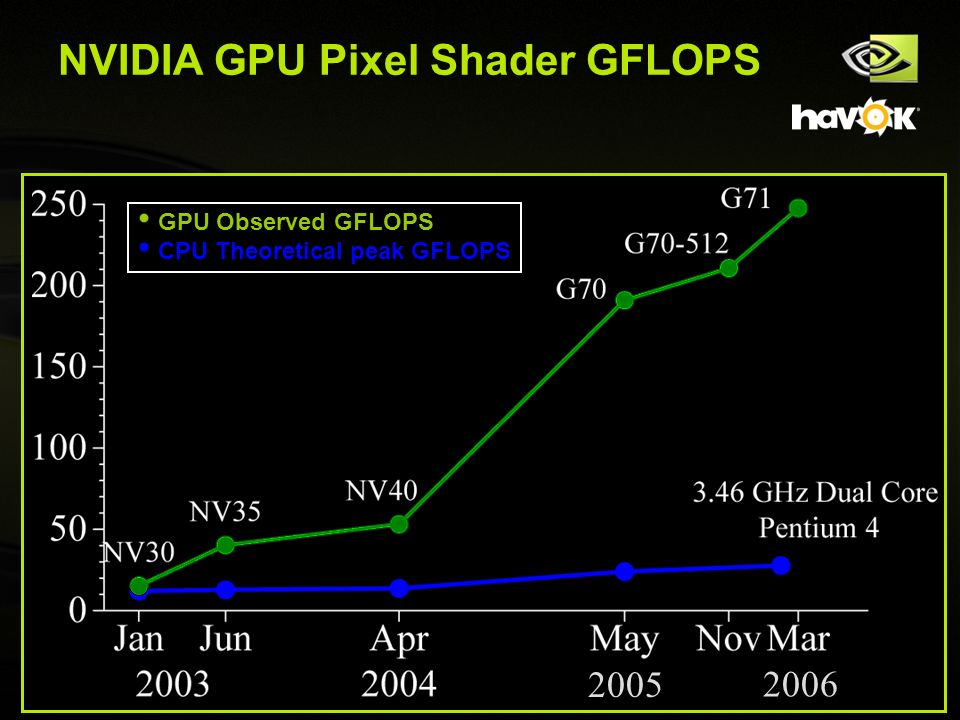 Components include hardware resources, processes, and threads.
You can often find the time range of interest by defining the associated action in the analysis guide. The action is the interval between the start event and the stop event, which can be selected and incremented in WPA. If no action is defined, you can find the time range by looking for specific generic events associated with the scenario, or look for changes in resource usage that can mark the start and end of the scenario. For example, if the CPU was idle for two seconds, then fully used for four seconds, and then idle again for two seconds, four seconds of full usage could be an area of interest in a trace that captures video playback.
Creating a model
To understand the root causes of a problem, it is necessary to have a model of what should happen. The model starts with a problem or any associated goal for a metric; For example, «This operation should be completed in less than 5 seconds.»
The more complete model contains information about how the components should be executed. For example, what kind of interaction is expected between components? What resource usage is typical? How long does the operation usually take?
Details of the model can often be found in the Assessment Review Guide. If this resource is not available, you can create a trace based on similar hardware and software that does not exhibit performance issues to generate the model.
Use the model to identify problems, then investigate the root causes
After the model has been created, you can compare the trace with the model to identify problems. For example, a model for a specific action named Suspend Devices can assume that all activities should complete within three seconds, and each instance of a subtask named «Suspend device
Each deviation from the model can be analyzed to find the root cause. You need to examine the status of the threads involved and look for common root causes. The following are some of the main CPU-related causes for activities that do not complete at the required speed or are delayed.
Direct CPU usage: Appropriate threads received full CPU resources, but the required program was not running fast enough. This can be caused by a software bug or slow hardware.
Thread Interference: A thread did not get enough execution time because other threads were executing instead. In this case, the thread is considered hungry or preempted.
DPC/ISR interference: Threads did not get enough execution time because the CPU was busy processing CPU or isR.
In many cases, one of these root causes does not noticeably affect the thread, and the thread spends most of its time waiting. In this case, you must determine and investigate the event for which the thread is expected. This recursive type of exploration is called expectation analysis and begins with the definition of a critical path.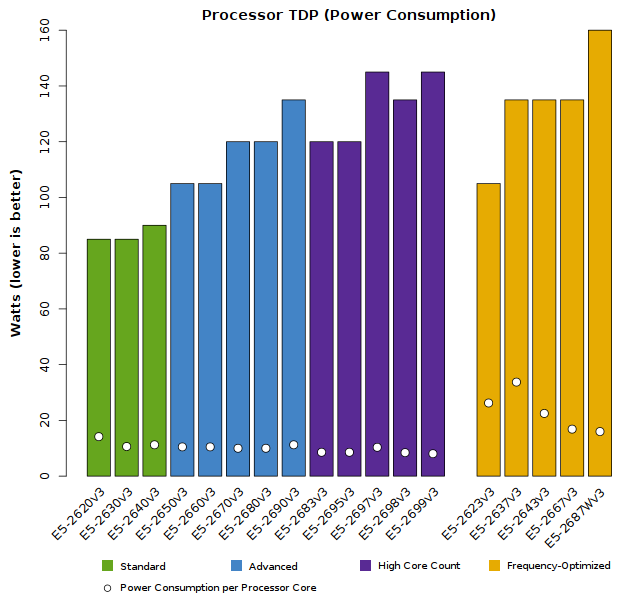
Extended Method: Wait Analysis and Critical Path
An action is a network of operations, some sequential and parallel operations that flow from a start event to an end event. Any pair of start/end events in a trace can be considered an action. The longest path through this network of operations is called the critical path. Decreasing the duration of any activity on the critical path directly reduces the duration of the overall activity, although this can also change the critical path.
Figure 23 Action Operations shows the action of three flows. Thread-1 dispatches an activity start event and then waits for both Thread-2 and Thread-3 tasks to complete. Thread-2 completes its task first, and then Thread-3. When both threads have completed their tasks, Thread-1 will be ready and completes the action event.
Figure 23 Activity Operations
In this scenario, the critical path includes parts of Thread-3 and Thread-1. They are traced in Fig.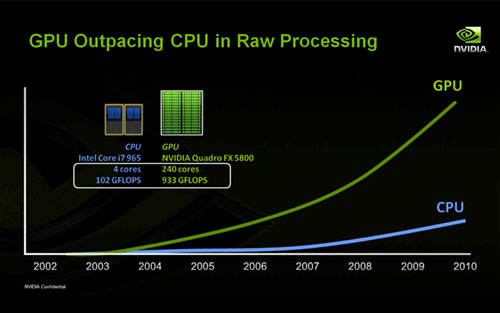 24 Critical Path. Since Thread-2 is not on the critical path, the time it takes to complete the task does not affect the overall activity time.
Figure 24. Critical Path
The critical path is a low literal answer to the question of why an action took as long as it did. Once the key segments of the critical path are known, they can be analyzed to find issues that contribute to overall latency.
General approach to finding the critical path
The first step in finding the critical path is to look at the scenario model to understand the purpose and implementation of the action.
Understanding an activity can help identify specific activities, processes, and flows that may be on the critical path. For example, a delay in the « Quick Launch Browser Initialization» action can be caused by RunOnce applications and the browser initialization process that require a significant amount of I/O.
After reviewing the scenario model, check if the assessment reported any issues for the affected activity. In many cases, the critical path approximation is included in the latency problems reported on the estimate. The critical path is displayed as a sequence of expectations and ready actions. It can be read end-to-end as a sequence of events with the main critical path segment deferred in the middle of the list. The last entry in the list is the action that is ready to perform the action.
If it is necessary to manually search for the critical path, it is recommended that you define the process and thread by completing the action and work backwards from when the action completed. You can identify the process and thread that started the action, and the process and thread that ended the action, using the graph of action in WPA.
Activity graph is displayed when a trace is loaded using an evaluation results XML file. To identify the process and thread associated with a particular activity, expand the graph to the activity of interest, and then switch the view to Graph+Table . Set graph mode to tabular . The columns start Process , Start Thread Id , End Process , and End Thread Id are displayed for each activity in the table.
Once you know the start and end process, flow, and action implementation, the critical path can be traced back. Start by analyzing the thread that completed the activity to determine how that thread spent most of its time: running, ready, or waiting.
Significant execution time indicates that direct CPU usage may be contributing to the length of the critical path. The time spent in ready mode indicates that other threads are contributing to the length of the critical path by preventing a thread on the critical path from executing. Time spent waiting for I/O points, timers, or other threads and processes in the critical path for which the current thread is waiting.
Each thread that is ready for the current thread is probably another link in the critical path, and can also be parsed as long as the length of the critical path is not taken into account.
Procedure. Finding the Critical Path in WPA
The following procedure assumes that you have identified an action in the action graph for which you want to find the critical path.
-
You can identify the process that completed the action by hovering over the action in the action column.
-
Add column CPU usage (fine). Zoom in on the affected action and apply preset « Usage by process» and «Flow «.
-
Right-click the column headers and make columns ReadyThreadStack and cpu Usage (ms) visible. Delete columns Ready (us) [Max] and Waits (us) [Max] .
-
Expand the target process and sort accordingly by CPU usage (ms), Ready (us) [Sum] , and Waits (us) [Sum] .
-
Find NewThreadIds in the process with the most time spent running, ready, or waiting.
Threads that spend significant time in the Running or Ready states may represent direct CPU usage on the critical path. Note that their thread IDs. Threads that spend a significant amount of time waiting may be waiting for I/O, a timer, or another thread on the critical path.
-
To see which threads were waiting, expand the NewThreadId group to display ReadyThreadStack .
-
Expand [root] .
-
Stacks starting with KiDispatchInterrupt are not associated with another thread. To determine what a thread is waiting on these stacks, expand KiDispatchInterrupt and look at the functions on the child stack. IopfCompleteRequest indicates that a ready thread was waiting for I/O. KiTimerExpiration indicates that a ready thread was waiting for a timer.
-
Expand stacks that do not start with KiDispatchInterrupt until you see ReadyingProcess and ReadyingThread .
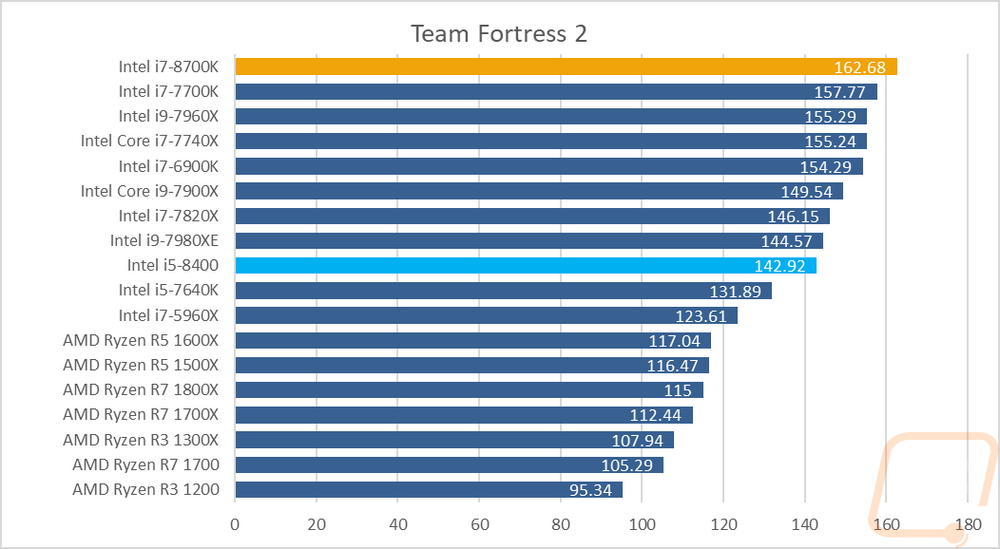 If the process is already deployed, deploy NewThreadId corresponding to ReadyingThreadThread . Repeat this step until you find a running, ready thread, waiting for a different reason, or waiting for a different process. If the thread is waiting for another process, repeat this procedure using that process.
Example
This example shows a delay in the Quick Launch Browser initialization action. Searching «Problems» area reveals that seven delayed problems are reported for this action. Each of these questions can be thought of as a segment of the critical path. The following key segments are defined:
-
TestBootStrapper.exe process thread 3872 (3024) multiplied for 2.1 seconds.
-
Thread 3872 of the TestBootStrapper.exe process (3024) is using 1 second of CPU time.
-
Thread 3872 of the TestBootStrapper.exe process (3024) clears the registry hive for 544 milliseconds.

-
TestBootStrapper.exe process thread 3872 (3024) sleeps at 513 milliseconds.
-
Explorer.exe threads 4052 and 4036 are reading from disk, resulting in a delay of 461 milliseconds.
-
Thread 3872 of the TestBootStrapper.exe process (3024) is starving for 187 milliseconds.
-
Thread 3872 of the TestBootStrapper.exe process writes 3.5 MB to disk, resulting in a latency of 178 milliseconds.
Issues indicate that this action was delayed by 5.2 seconds. These delays make up the bulk of the actions in the total duration of 6.3 seconds. The TestBootStrapper.exe application is primarily responsible for the latency, primarily because it preempted other processing tasks.
Investigating problems in critical path
-
Zoom in on the affected region and add columns ReadyThreadStack and CPU usage (ms).
-
In this case, Explorer.
 exe is the process that ends the action. Expand the explorer.exe process and sort it accordingly by CPU usage (ms), Ready (us) [Sum] , and Waits (us) [Sum] , as shown in the following pictures:
 Fig. 25. CPU Load Action (ms)
Fig. 26 Action on readiness (we)
Fig. 27. Actions on expectations (to us)
-
Sorting on column CPU Usage (ms) displays the top child row at 299 milliseconds. Sorting on column Ready (us) [Sum] displays top child row 46ms. Sorting on column Waits (us) [Sum] displays top child row 5749milliseconds and the second line is 4902 milliseconds. Since these lines contribute significantly to latency, they should be investigated further.
-
Expand stacks to display ready streams as shown in the following figures:
Fig.
 28. Preparation process and flow preparation for flow
 Fig. 29. Preparation process and preparation of a stream for another stream
In this example, the first thread spends most of its time waiting for the RunOnce.exe process to terminate. You should investigate why the RunOnce.exe process is taking so long to complete. The second thread is waiting on the first thread and is probably a minor link in the same wait chain.
-
Repeat the steps in this procedure for RunOnce.exe. The main contribution column is Waits (us) and has four possible members.
-
Expand each participant to see that the first three participants are waiting for the fourth participant. This situation makes the first three participants insignificant for the waiting chain. The fourth member is waiting for another process, TestBootStrapper.exe.
This scenario is shown in fig. 30 Preparing process and preparing thread for thread in RunOnce.
 exe:
exe: Fig. 30 Preparing process and preparing thread for thread in RunOnce.exe
-
Repeat the steps in this procedure for TestBootStrapper.exe. The results are shown in the following three figures:
Fig. 31 Threads by CPU load (ms)
Fig. 32 Flows on readiness (to us)
Fig. 33. Flows by expectations (to us)
Thread 3872 spent approximately 1 second, 2 seconds ready, and 1.3 seconds waiting. Since this thread is also a ready thread for thread 3872, the execution and ready times are likely contributing to the delay. The score reports the following issues, the times of which correspond to delays:
-
TestBootStrapper.exe process thread 3872 (3024) multiplied for 2.1 seconds.
-
Thread 3872 of the TestBootStrapper.exe process (3024) is starving for 187 milliseconds.
-
Thread 3872 of the TestBootStrapper.
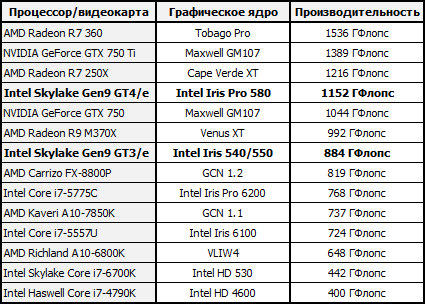 exe process (3024) uses 1 second of CPU time.
-
-
To find other issues related to this, view the event for which thread 3872 is waiting. 34 participants for waiting time:
Figure 34. Deposits while waiting
KiRetireDpcList is usually I/O related and KiTimerExpiration is a timer. You can view how the I/O and timer were initiated by removing ReadyThreadStack and by viewing NewThreadStack . This view shows three related functions, as shown in Figure 1. 35 I/O and timers in NewThreadStack:
Fig. 35 I/O and timer in NewThreadStack
This view provides the following information:
-
Thread 3872 of the TestBootStrapper.exe process (3024) clears the registry hive for 544 milliseconds.
-
TestBootStrapper.exe process thread 3872 (3024) sleeps at 513 milliseconds.
-
Thread 3872 of the TestBootStrapper.
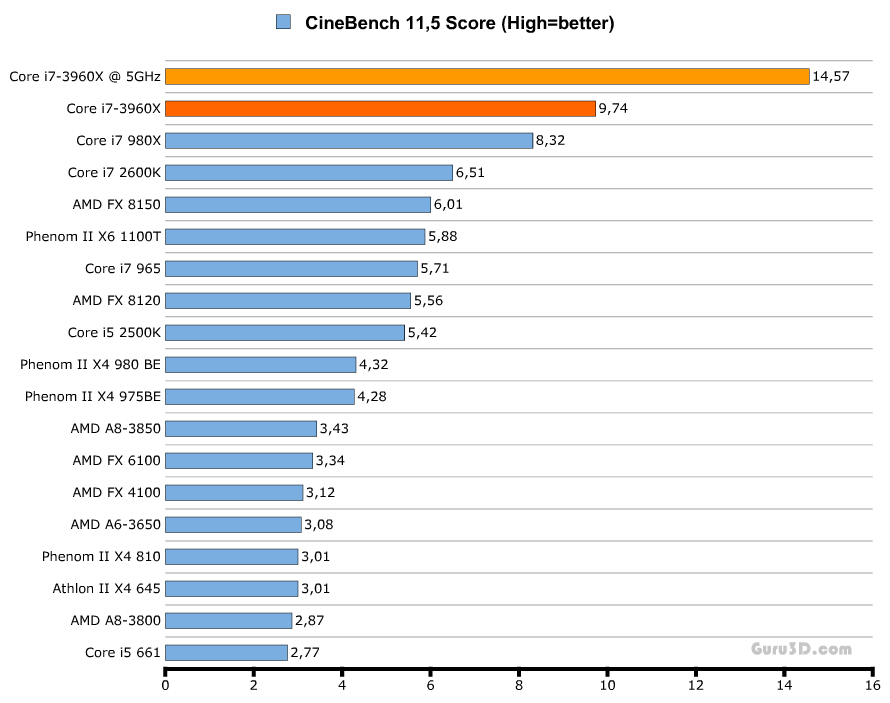 exe process writes 3.5 MB to disk, resulting in a latency of 178 milliseconds.
-
-
When you started investigating the critical path, you analyzed the most significant wait cause in Explorer.exe and ignored all parts of the critical path that occurred after that wait cause. To record this previously ignored section of the critical path, you need to view the timeline. add CPU usage (fine) and apply timeline per process, thread preset.
-
Filter to include only processes defined as part of the critical path. The resulting graph is shown in Figure 36 of the Critical Path Timeline:
Figure 36. Critical Path Timeline
In fig. 36 The critical path timeline shows that Explorer.exe did more work after stopping waiting for RunOnce.exe. Zoom in to the time period after the previously analyzed wait chain and perform another analysis. In this case, the analysis shows a large number of threads that are internal to Explorer.
 exe, and there is no clear trace through the critical path. In this case, further analysis will most likely not provide useful information.
Direct CPU usage
Activities are often delayed because a thread on the critical path is using significant CPU time. Using the thread state model, you can see that this problem is characterized by a thread on the critical path that spends an exceptional amount of time in the running state. On some hardware, this heavy CPU usage can contribute to latencies.
Identifying Problems
Many evaluations use heuristics to identify direct problems related to CPU usage. Significant CPU usage on the critical path is displayed as a problem in the following form:
Process CPU usage P is delaying the affected action A for x seconds
Where P is the running process, A is the action, and x is the time
If these problems are reported for an action that results in delays, direct CPU usage may be the cause.
Investigate direct CPU usage
-
You can manually identify the problem, find the individual CPUs that caused 100% CPU usage in column «CPU load (sample).
-
Zoom in on the graph area of interest and select usage preset by process and flow .
By default, the table displays the rows at the top with the highest total CPU consumption. These threads are also displayed at the top of the CPU usage graph (selection).
Note On a system with multiple processors, a thread that uses 100% of a single processor will consume 100/(number of logical processors). In such a system, only virtual idle thread (PID 0, TID 0) can represent more CPU usage than 100/(number of logical processors). If the processes and threads that consume the most CPU match any threads in the critical path, direct CPU usage is likely a factor.
Assessment-Reported direct CPU usage example
TestUM. exe process CPU usage (4024) delays the affected activity, the TestIM.exe startup process quickly exiting within 2.1 seconds. This example is shown in fig. 37 Thread 3208:
Figure 37. Thread 3208
Exploring
When you find that direct CPU usage contributes to critical path latency, you need to identify the specific modules and functions that contribute to latency.
Method. View Direct CPU Issue Assessment-Reported
You can expand the direct CPU issue reported by the assessment to display the critical path that affects direct CPU usage. If you expand the node related to CPU usage, you will see stacks related to CPU usage and associated modules. This representation is shown in Fig. Figure 38 Expanded CPU usage segment:
Figure 38 Expanded CPU usage segment
Method: Manually Examine Problem Stacks with Direct CPU Usage
If the score does not report a problem or additional verification is required, you can use the CPU Usage Graph (Sampling) to collect information about the modules and functions associated with the usage problem CPU.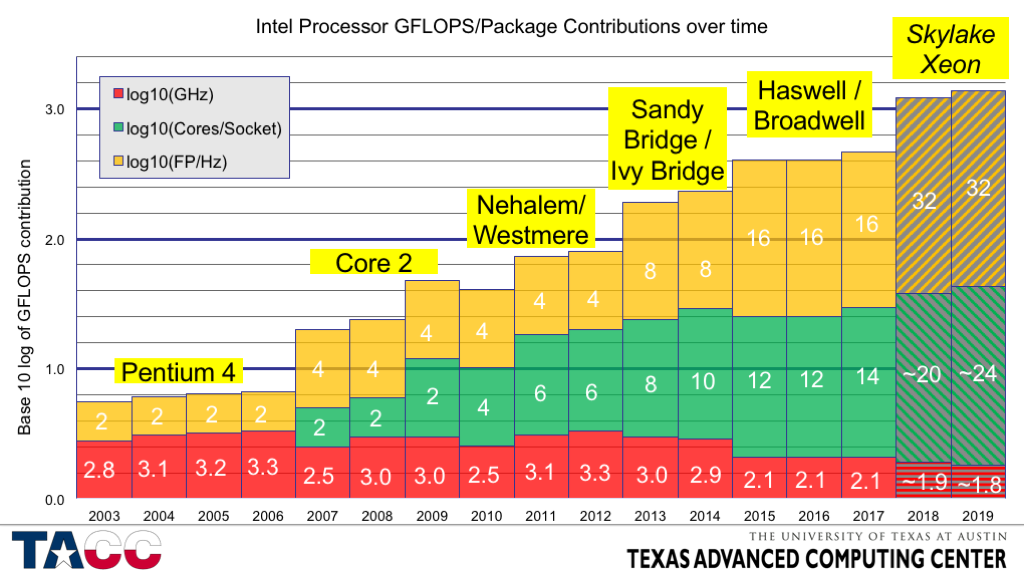 To do this, you need to zoom in on the area of interest and view the stacks sorted by CPU usage.
Exploring direct CPU stacks manually
-
On the Routing menu, click Load Symbols.
-
Enlarge the timeline to display only the portion of the critical path affected by the CPU issue.
-
Application preset usage by process and flow .
-
Add column Stack to the screen, and then drag this column to the right of thread ID (to the left of the panel).
-
Expand the process and thread to display the stack trees.
Strings on the stack are sorted in descending order by % CPU load . This puts the most interesting stacks on top. When expanding stacks, look at the %Weight column to make sure the focus stays on the rows with the highest consumption.
-
To extract a copy of the stack, select all rows, right-click and select «Copy selection «.

Solution
You can apply remedies at both the configuration and component levels to resolve high CPU usage.
Direct CPU usage has a greater impact on computers with lower end processors. In such cases, you can add additional processing power to your computer. In addition, you can remove problem modules from the critical path or from the system. If you can change the components, consider redesigning to achieve one of the following:
-
Remove CPU intensive code from critical path
-
Using more efficient CPU algorithms
-
Postpone or cache work
Thread interference
CPU usage by threads that are not on the critical path (and that may not be associated with an activity) can delay threads that are on the critical path. The thread state model shows that this problem is characterized by threads on the critical path that spend unusual time in the ready state.
Problem identification
Many evaluations use heuristics to identify problems associated with an intervention. This data is displayed in one of the following two forms:
Where P is the process, A is the activity, and x is the time in ms.
The first form reflects interference from flows at the same priority level as a flow on the critical path. The second form reflects the intervention of threads that are at a higher priority level than the thread on the critical path.
If these types of problems are submitted for pending action, flow interference may be the cause. You can use graph CPU usage (fine), to manually identify the problem.
Detect flow noise problems
-
Increase interval and apply CPU load preset . A usage of 100% on all CPUs indicates a noise problem.
-
Application use by process, stream preset and sort by first column Ready (us). (This is a column that includes aggregation sums .
)
-
Expand the process of the affected activity and view the readiness time for threads on the critical path. This value is the maximum time that the delay can be reduced by eliminating any flow interference problem. A value with a significant value relative to the delay under investigation indicates that there is a flow interference problem.
Fig. 39 CPU utilization almost 100% and fig. 40 The flow interference problem represents this scenario:
Figure 39. Operation close to 100%
Figure 40. Flow interference problem time in ready state.
Method: Determine why a thread has spent time in the ready state
You can use graph CPU Usage (fine), to determine why a thread spent time in the ready state. First you need to determine if the thread is limited to certain processors. While this information cannot be obtained directly, you can examine the thread’s CPU usage log during periods of high CPU usage. This is the period when threads frequently switch between processors.
Detect thread processor limits
-
Zoom in on the affected area.
-
Add CPU usage graph (fine) and apply usage preset per process and thread .
-
Use the Advanced dialog to add column CPU with aggregation mode unique Count to the right of NewThreadId .
-
Filter the graph to display only the streams you are interested in.
The value in column CPU reflects the number of processors on which the thread was executing during the current time interval. During periods of 100% CPU usage, this number will approximate the number of processors on which this thread is allowed to run. If the value is less than the number of available processors, the thread is probably limited to certain CPUs.
Figure 41 Restricted flows shows an example of this graph:
Figure 41 Restricted flows
Once you know the processor limits of a thread, you can determine what is being preempted or starving a thread. To do this, you need to determine the intervals that the thread spent in the ready state, and then check what other threads or processes were running during these intervals.
Determining what was pushed or pushed away from the thread
-
Create a graph showing when the thread was in the Ready state and applied preset «Usage by Process» and «Flow «.
-
Open view editor , click «Advanced » button and go to tab « Graph configuration».
-
Set start time to to ReadyTime (s) and set Duration to Ready (us) to as shown in Figure
-
42 Ready time columns.
Press button OK .
Figure 42. Ready time columns
-
In the view editor , replace column CPU Usage (%) with column Ready (us) [Sum] .
-
Select the flow of interest to create a graph similar to fig. 43 Ready Time Graph:
Figure 43 Ready time graph
-
In this case, the thread has spent a significant amount of time in the ready state. To determine typical priority, add aggregation average into column NewInPri .
In this case, the thread’s average priority is exactly 8. This number indicates that this is probably a background thread that never gets a priority boost.
-
Once the average priority is known, view the CPU activity for the CPU on which the thread is allowed to run.
In this case, the thread should only have affinity for CPU 1.
-
Add another column CPU usage and apply preset CPU usage . Select the appropriate CPUs.
-
Open the expanded view and add the priority filter you found earlier to filter this stream. This scenario is shown in Figure 44 Flow Filter:
Figure 44 Flow filter
In Figure 45 CPU Usage, Ready Time, and Other Thread Activity, the top graph shows the CPU usage of thread 3548. The middle graph shows the time the thread was ready, and the bottom graph shows the activity on the CPU on which the thread was allowed to run (in in this case, cpu1).
Fig. 45 CPU usage, ready time and other thread activity
-
Zoom in on a region where a stream was ready but didn’t run most of the time during this interval.
-
In the CPU usage graph , add NewInPri to the left of the bar and view the results.
Threads or processes that have priorities equal to the priority of the target thread are showing thread timeout. Threads or processes with a higher priority than the target thread’s priority show the time the thread was terminated. You can calculate the total time a thread was preempted by adding the time of all preemptive threads and activities.
Fig. 46 Using by priority when the target stream was ready shows that 730 ms of stream time was denied and 300 ms of stream time was short. (This figure is enlarged to an interval of 1192 ms.)
Fig. 46. Use by priority when target thread was ready
-
To determine which threads are responsible for preempting and starving this thread, add column NewProcess to the right of column NewInPri and view the priority levels at which the processes were running. In this case, the preemption and hunger were mainly caused by another thread in the same process and TestResidentApp.
exe. It can be assumed that these processes receive periodic priority boosts above the base priority.
Solution
You can fix the preemption or shortage problems by changing the configuration or components. Consider the following protections:
-
Remove problematic processes from the system.
-
Set the base priority of problematic processes…
-
Change the execution time of problematic processes; For example, the startup time delay when the computer is restarted.
-
If the components of the problem can be changed, change them so that they are less resource intensive or start at a lower priority.
DPC/ISR intervention
If excessive CPU time is being consumed while executing the CPU and isR, there may not be enough free CPU time to run threads. This situation can lead to similar delays in traffic interference. When threads need to perform operations at a normal high frequency, such as when playing a video or animation, dpcs and ISR interference can cause operational problems.
Problem Identification
Many evaluations use heuristics to identify DPC/ISR related problems. A DPC/ISR activity is identified as suspicious when it receives a problem message in the following form:
DPC D exceeds threshold in milliseconds x for P . N instances of this DPC are executed for the cumulative number of milliseconds.
Where D is the DPC, m is the number of milliseconds that defines the threshold, x is the number of times the DPC threshold was exceeded, P is the current time, n is the number of instances that the DPC started , and t is the total time in milliseconds after which the DPC exceeded the threshold.
For example, the score reports the following problem:
DPC sdbus.sys! SdbusWorkerDpc exceeds the 3.0 millisecond target 153 times during the lifetime of the media engine. 153 instances of this DPC run in a total of 864 milliseconds
If this issue occurs for an activity that displays problem or delay events, a DPC/ISR activity may be the cause.
Manually detect DPC/ISR interference
-
To manually detect DPC/ISR interference, open a trace in WPA and identify the problem events of interest. These are general evaluation events such as Microsoft-Windows-Dwm-Core:SCHEDULE_GLITCH or Microsoft-Windows-MediaEngine:DroppedFrame .
-
Next to the event graph, add DPC/ISR duration on CPU graph . If peak values at DPC/ISR durations on CPU graph correspond to problem events, DPC/ISR may be a factor causing problems.
-
For more data, increase the time period that occurs 100ms before multiple problem events are displayed. If significant DPC/ISR activity is displayed on one or more processors in the 100ms region prior to the occurrence of problem events, it can be concluded that the problem events were caused by DPC/IRS activity.
-
To determine if DPC/ISR is causing interference, zoom in on the region where the running thread is displayed.
Make a note of the CPU or CPU that this thread is running on.
-
On the DPC/ISR graph, apply the DPC/ISR duration to the CPU preset and view the DPC/ISR activity on the corresponding CPUs in that time range.
47 . Problem events and DPC/ISR activity indicate that thread 864 from iexplore.exe is related to the affected activity. Thread 864 is in the «Running» state on CPU2 for 10.65% of the time range in the view. However, the DPC/ISR graph shows that CPU2 is busy running DPC/ISR for 10% of that time.
Note Most DPC/ISRs don’t have as much of an impact as shown in this example.
Fig. Figure 47. Problem Events and DPC/ISR Actions
In Figure 48 DPC/ISRs not associated with problem events, DPC/ISRs are not associated with performance problems:
48 DPC/ISRs not associated with problem events
Figure 49 DPC/ISR interference delay shows DPC/ISRs to cause performance issues:
Fig. 49 Delay caused by DPC/ISR interference
Research
Having determined that dpcs/ISRs are associated with problems or delays, it is necessary to determine which specific CPUs/ISRs are involved and why they occur frequently or run for an excessive amount of time.
Method. Checking the Issue with an Assessment-Reported DPC/ISR
In assessment-reported DPC/ISR issues, you can expand an issue that maps the underlying processes that are preempted by the DPC or ISR. Expand the stack to see the DPC activity for the process most related to the affected activity, as shown in the example, expand the stack to understand what the DPC is doing. Figure 50 Expanded DPC stack shows the expanded stack:
Figure 50. Expanded DPC stack
Method. Finding Maximum CPU/ISR Duration and Viewing Stacks
If the score does not report a DPC/ISR issue, you can use DPC/ISR graphs and CPU usage (sample), to get stack information for the most relevant CPUs. It is recommended that you find the DPC/ISR you are interested in, note its module and function, and then look for examples in column CPU usage (selection), for complete stack information.
Find the longest dpcs/ISR and view stacks
-
Increase the interval of interest.
-
In the DPC/ISR column, select the preset modulo DPC/ISR duration, function .
If symbols are loaded, DPC/ISR events are sorted by total duration and then broken down by modulo and function. The top rows in the list contain DPC/ISR events that are likely to have caused problems with the events. Write down the names of modules and functions.
-
In the CPU usage graph (sample) , select preset «Usage by process «. By default, this preset hides the DPC/ISR action.
-
Open the view editor and click the «More » button.
-
On the «Filter » tab, change the hide lines corresponding to the filter parameter to keep the lines corresponding to filter . This will display DPC/ISR activities.
-
Remove column Process and add column of stack to view dpcs/ISR sorted by stack.
-
Clear the current row selection.
-
Right-click the cell in column of stack and select «Find in this column».
-
Enter the module and function that you wrote down in step 2 of this procedure.
-
Select the checkbox «Add to current selection » and click the button «Find all » to select all instances of the function.
-
Once all rows have been selected, right-click and select Butterfly or View Callables.
This view shows the activities of this particular function, sorted by total duration. The view is similar to the stacks that appear in the detailed view of an issue that is reported by an assessment. Column «Weight » approximates the inclusive time spent by each function on the stack in milliseconds.
This view is shown in Figure 51 DPC Callables sorted by approximate duration:
51 DPCs sorted by approximate duration
Method. Long-Running dpcs/ISR check
Total CPU/ISR duration is important, but long-running individual CPUs/ISRs are likely to cause delays. On the DPC/ISR chart column inclusive duration (ms), sorted in descending order, displays the maximum duration of individual DPC/ISRs. The preset long DPCs/ISR available in some scoring profiles allows you to filter this view to display only dpcs/ISRs with an inclusive duration greater than 1ms.
Note If this preset is not available, you can open the « View Editor» section, « Advanced » to add a filter.
Solution
DPC/ISR action often reflects a hardware or software problem that needs to be fixed at the hardware or component level. At the configuration level, you can replace the hardware or update the associated driver to a fixed version. At the component level, hardware and drivers should follow MSDN’s dpcs/ISR guidelines and use streaming CPUs whenever possible. Stream CPUs do not run at the dispatch level in client editions of Windows. For more information on recommendations for dpcs/ISR, see the isR and DPC behavior guides and an introduction to streaming dpcs.
Streaming Domain Controller Overview
Symbol Loading
Power Management and ACPI — Architecture and Driver Support
SCP System in Windows Vista and Windows Server 2008
Priority Scheduling
Scheduling, Thread Context, and IRQL3 Internals
, Sixth Edition
Windows Performance Analyzer
Windows Toolkit Performance Technical Reference
How to choose different GPUs for different applications in Windows 11/10
One of the most exciting new features of Windows 11/10 is the ability to select GPU for applications to improve application performance as well as save battery life in the long run. Many computers have two GPUs (GPUs) installed on the motherboard. One of them could be on board, while the other could be installed separately. If your configuration allows you to use them separately, try this feature. By using this method, you can improve your productivity graphics (Graphics) for certain applications or software.
Select (Choose) Other Graphic processor (GPU) for different Applications (Apps) in Windows
more than powerful graphic processor (GPU) is required. It could be a heavy game, video/image editing software, or something else that requires more processing power.
When your list is ready, go to Settings > Display > and scroll to the bottom. Look for a link that says « Graphics Settings». (Graphics Settings. ) Open this.
This section mentions that you can tune graphics performance for certain applications. Settings can profile better app performance or save battery life. After making changes, you will need to close the application and launch it again. See also: How to reset GPU Settings (GPU Preferences) for Applications (Apps) to Default (Default) .
increase (Increase Graphics) graphics performance for certain applications
In the first opening list, it is proposed to select Classic Appendix (Classic App) or Applications UWP UWP UWP UWP UWP UWP UWP UWP If you choose the desktop app, you will need to manually browse and select EXE is the file of this application. If you select a UWP app, you will be presented with a list of installed apps on your PC.
After populating the list, select the application in which you want to adjust the graphics performance, and then select » Options (Options) » . In the next window there will be a list of video cards depending on performance. You need Energy Saving GPU (Saving GPU) and High Performance GPU (High-performance GPU) with their name.
Choose from the following three options:
- System Default,
- Energy Saving,
- High Performance.
Then save it.
Allow (Allow) users to specify a high performance GPU (GPU) as default or select a specific GPU (GPU) for each application.
Microsoft updated Settings (Settings) Graphics (Graphics) to allow users to specify the default high-performance GPU (3. PU) 933 You can select specific GPU (GPU) in Windows 10 as shown above per app.
How to set
graphics settings (Graphics Preference) for programs in Windows 11
In Windows 11 Settings > Settings look like this:
Find the app and click Options.
You can adjust graphics performance in the panel that opens.
When the settings window 9 opens0017 graphics, select the option you prefer for graphics performance. (Graphics) Three options are displayed, namely
- Let Windows decide (energy saving).
- Energy saving.
- High performance.
When finished, press the button » Save (Save ) » and exit the settings.
If your PC has multiple high-end GPUs (GPUs) and you want to specify which of these GPUs (GPUs) should be used for high performance use cases, now you can do so.
They also added the ability to specify which (GPU) graphics processor (GPU) you want to run the application on using the new option «Specific graphics processor». (GPU)
while Windows manages everything on its own, but it’s great that this option is available for user management. If you have a heavy application that uses the graphics processor (GPU) , you can force it to use the power saving graphics processor (GPU) to save battery power. You can bookmark this tip under Battery saving tips for your laptop.
This will also help reduce the load on the main integrated graphics processor (GPU) and make it easier to perform two tasks, one medium and one heavy.
To remove, select the application and click the button » Remove (Remove) » . It won’t ask for confirmation, so be careful.
How normal is GPU usage?
No such threshold, so even 100% usage GPU (GPU) is considered normal. However, this means that you are using your hardware to the fullest and leaving no performance on the table. Such cases usually occur during graphics-intensive games.
How to improve computer graphics?
The most preferred way is to increase FPS or frames (Frame Per Second) per second on your PC. You can do this by updating your graphics and video drivers, by optimizing your game settings, or by investing in upgrade software FPS .
Hope this helps!
Related posts
-
How to backup and restore GPU Preferences for Apps in Windows 10
-
Fix PowerShell causing High CPU usage in Windows 11/10
-
How to use Performance Monitor in Windows 10
-
How to install or uninstall Microsoft Store Apps on Windows 10
-
Using the iTunes app from Microsoft Store on Windows 10
-
Optimize and improve Windows 10 computer performance Windows 10
-
Can’t Pin Apps or Programs to the Taskbar in Windows 10
-
3647
-
How to fix 100% Disk, High CPU, High Memory usage in Windows 10
-
How to view HEIC and HEVC files on Windows 10 Photos app
-
How to run Computer Performance Benchmark Test on Windows 10
-
Top 10 free Epub readers for Windows 11/10
-
Windows Store Cache can be corrupted in Windows 11/10
-
Tune-Up Windows 10 using these tips and free software
-
performance of Intel processors of different generations / Habr
Almost every year a new generation of Intel Xeon E5 central processors enters the market.
In each generation, the socket and technological process alternately change. There are more and more cores, and the heat dissipation is gradually decreasing. But a natural question arises: “What does the new architecture give to the end user?”
To do this, I decided to test the performance of similar processors of different generations. I decided to compare models of the mass segment: 8-core processors 2660, 2670, 2640V2, 2650V2, 2630V3 and 2620V4. Testing with such a generational spread is not entirely fair, because between V2 and V3 there is a different chipset, a new-generation memory with a higher frequency, and most importantly, there are no direct peers in frequency among models of all 4 generations. But, in any case, this study will help to understand to what extent the performance of new processors has increased in real applications and synthetic tests.
The selected line of processors has many similar parameters: the same number of cores and threads, 20 MB SmartCache, 8 GT/s QPI (except 2640V2) and the number of PCI-E lanes equal to 40.
To assess the feasibility of testing all processors, I turned to the test results PassMark.
Below is a summary graph of the results:
Since the frequency is significantly different, it is not entirely correct to compare the results. But despite this, conclusions immediately suggest themselves:
1. 2660 equivalent in performance to 2620V4
2. 2670 outperforms 2620V4 (obviously due to frequency)
3. 2640V2 sags, and 2650V2 beats everyone (also because of the frequency)I divided the result by the frequency and got a certain performance value at 1 GHz:
Here the results are more interesting and visual:
1. 2660 and 2670 — an unexpected run for me within one generation, 2670 justifies only that its overall performance is very high
2. 2640V2 and 2650V2 — a very strange low result, which is worse than 2660
3. 2630V3 and 2620V4 are the only logical growth (apparently just due to the new architecture...)
, and not very successful, in my opinion — I remove
from the candidates
2. 2630V3 is an excellent result, but it is unreasonably more expensive than 2620V4, given the similar performance and, moreover, this is already an outgoing generation of 9 processors3731
3. 2620V4 is an adequate price (compared to 2630V3), high performance and, most importantly, this is the only model of the latest generation 8-core processor with Hyper-threading in our list, so we definitely leave
for further tests
4. 2660 and 2670 are excellent results compared to 2620V4. In my opinion, it is the comparison of the first and last (at the moment) generation in the Intel Xeon E5 line that is of particular interest. In addition, we still have sufficient stocks of first-generation processors in stock, so this comparison is very relevant for us.The cost of servers based on 2660 and 2620V4 processors can differ by almost 2 times against the latter, so by comparing their performance and choosing a server based on V1 processors, you can significantly reduce the budget for buying a new server.
But I will talk about this proposal after the results of testing.
3 stands were assembled for testing:
1. 2 x Xeon E5-2660, 8 x 8Gb DDR3 ECC REG 1333, SSD Intel Enterprise 150Gb
2. 2 x Xeon E5-2670, 8 x 8Gb DDR3 ECC REG 1333, SSD Intel Enterprise 150Gb
3. 2 x Xeon E5-2620V4, 8 x 8Gb DDR4 ECC REG 2133, SSD Intel Enterprise 150GbPassMark PerformanceTest 9.0
When selecting processors for tests, I already used the results of synthetic tests, but now it is interesting to compare these models in more detail. The comparison was made in groups: the 1st generation against the 4th.
A more detailed test report allows us to draw some conclusions:
1. Mathematics, incl. and floating point, mainly depends on the frequency. The difference of 100 MHz allowed the 2660 to outperform the 2620V4 in computational operations, in encryption and compression (and this despite a significant difference in memory frequency)
2.Physics and calculations using extended instructions on the new architecture are performed better, despite the low frequency
3. And, of course, the test with the use of memory passed in favor of the V4 processors, since in this case different generations of memory competed — DDR4 and DDR3.It was synthetic. Let’s see what specialized benchmarks and real applications will show.
7ZIP archiver
Here the results are similar to the previous test — direct binding to the processor frequency. It does not matter that a slower memory is installed — V1 processors confidently take the lead in frequency.
CINEBENCH R15
CINEBENCH is a computer performance benchmark for MAXON Cinema 4D professional animation software.
Xeon E5-2670 pulled out in frequency and beat 2620V4. But the E5-2660, which has a less visible advantage in frequency, lost to the 4th generation processor. Hence the conclusion — this software uses useful additions to the new architecture (although it may be all about memory .
..), but not so much that it was a decisive factor.
3DS MAX + V-Ray
To evaluate the performance of processors when rendering in a real application, I took a bunch: 3ds Max 2016 + V-ray 3.4 + a real scene with several light sources, specular and transparent materials, and an environment map.
The results were similar to CINEBENCH: the Xeon E5-2670 had the lowest render time, while the 2660 couldn’t beat the 2620V4.
1: SQL/File
In conclusion of testing, I enclose the results of gilev tests for 1C.
When testing a database with file access, the E5-2620V4 processor confidently leads. The table shows the average values of 20 runs of the same test. The difference between the results of each stand in the case of the file base was no more than 2%.
A single-threaded SQL database test showed very strange results. The difference turned out to be negligible, given the different frequencies for 2660 and 2670, and the different frequencies for DDR3 and DDR4.
There was an attempt to optimize the SQL settings, but the results turned out to be worse than it was, so I decided to test all the stands on the basic settings.
The results of the multi-threaded SQL test turned out to be even more strange and inconsistent. The maximum speed of 1 thread in MB/s was equivalent to the performance index in the previous single-threaded test.
The next parameter was the maximum speed (of all streams) — the result was almost identical for all stands. Since the results of different runs fluctuated greatly (+ -5%) — sometimes they were at different stands with a significant margin both in one direction and in the other. The same average multi-threaded SQL test results lead me to 3 thoughts:
1. This situation is caused by an unoptimized SQL configuration
2. SSD became the bottleneck of the system and did not allow processors to overclock
3. There is almost no difference between the frequency of memory and processors for these tasks (which is extremely unlikely)If you have reliable explanations for such results, please share them in the comments.
Also, the result for the “Recommended number of users” parameter turned out to be inexplicable. The average result of the 2660 turned out to be the highest of all — and this is despite the low results of all tests.
I will also be glad to see your comments on this issue.Terminals
The results of several comprehensive computational tests showed that the frequency of the processor in most cases turned out to be more important than the generation, architecture, and even memory frequency. Of course, there is modern software that uses all the improvements of the new architecture. For example, video transcoding is sometimes performed incl. using AVX2.0 instructions, but this is specialized software — and most server applications are still tied to the number and frequency of cores.
Of course, I’m not saying that there is absolutely no difference between processors, I just want to note that for certain applications there is no point in a «planned» transition to a new generation.
If you do not agree with me or you have suggestions for testing, the stands have not yet been sorted out, and I will be happy to test your tasks.
Economic benefit
As I wrote at the beginning of the article, we offer a line of servers based on the first generation Xeon E5 processors, which are significantly more expensive than servers based on the E5-2620V4.
These are the same new servers (not to be confused with used ones) with a 3-year warranty.Below is an approximate calculation:
STSS Flagman server RX227.4-008LH in the configuration 2 x Intel Xeon E5-2620V4 + 8 x 8Gb DDR4 ECC REG at retail costs today
r 265066
Similar configuration STSS Flagman EX227.3-008LH based on 2 x Intel Xeon E5-2660 + 8 x 8Gb DDR3 ECC REG is available for 175275r.
Habr readers can get an additional discount when ordering 5% . To do this, you need to select the desired case form factor from the list of models on our website .
Model EX217.3-004LH is 1U, EX227.3-008LH is 2U, and EX240.3-008LH is Tower/4U.
In the model configurator, you can select the necessary parameters of memory, disk subsystem and additional devices. When sending a request for calculation, you must specify the promo code HABRAHABR .Thank you for your attention! I will wait for your comments and wishes on the tests.
Article writing and testing: Usikoff
Testing 1C: sarge74CPU performance table
1 256 CPU AMD Athlon X4 730 (AD730XO) 2.8 GHz/4core/ 4 Mb/65W/5 GT/s Socket FM2 9.4 1819 193.51 2 210 CPU AMD Athlon X4 845 (AD845XA) 3.5 GHz/4core/ 2 Mb/65W/5 GT/s Socket FM2+ 13.2 2658 201.36 3 224 CPU AMD Athlon X4 840 (AD840XY) 3. 1 GHz/4core/ 4 Mb/65W/5 GT/s Socket FM2+
12.5 2565 205.2 4 252 CPU Intel Celeron G3930 2.9 GHz/2core/SVGA HD Graphics 610/0.5+2Mb/51W/8GT/s LGA1151 9.9 2297 232.02 5 254 CPU Intel Celeron G3900 2.8 GHz/2core/SVGA HD Graphics 510/0.5+2Mb/51W/8GT/s LGA1151 9.7 2320 239.18 6 275 CPU AMD Athlon X2 370K (AD370KO) 4.0 GHz/2core/ 1 Mb/65W/5 GT/s Socket FM2 6 1487 247.83 7 228 CPU AMD Athlon X4 860K (AD860KX) 3.7 GHz/4core/ 4 Mb/95W/5 GT/s Socket FM2+ 12.4 3089 249.11 8 172 CPU AMD FX-6300 (FD6300W) 3. 5 GHz/6core/ 6+8Mb/95W/5200 MHz Socket AM3+
17.1 4605 269.3 9 197 CPU AMD Athlon X4 870K (AD870KX) 3.9GHz/4core/ 4Mb/95W/5 GT/s Socket FM2+ 13.8 3730 270.29 10 278 CPU AMD A4-6300 (AD6300O) 3.7 GHz/2core/SVGA Radeon HD 8370D/ 1 Mb/65W/5 GT/s Socket FM2 5.9 1609 272.71 11 223 CPU AMD FX-4300 (FD4300W) 3.8 GHz/4core/ 4+4Mb/95W/5200 MHz Socket AM3+ 12.6 3439 272.94 12 132 CPU AMD FX-8320 (FD8320F) 3.5 GHz/8core/ 8+8Mb/125W/5200 MHz Socket AM3+ 22.4 6120 273.21 13 206 CPU AMD FX-4330 (FD4330W) 4. 0 GHz/4core/ 4+8Mb/95W/5200 MHz Socket AM3+
13.3 3730 280.45 14 196 CPU AMD FX-4350 (FD4350F) 4.2 GHz/4core/ 4+8Mb/125W/5200 MHz Socket AM3+ 13.9 3905 280.94 15 148 CPU AMD FX-8320E (FD832EW) 3.2 GHz/8core/ 8+8Mb/95W/5200 MHz Socket AM3+ 20.7 5887 284.4 16 216 CPU AMD Athlon X4 950 (AD950XA) 3.5 GHz/4core/2 Mb/65W/5 GT/s Socket AM4 13.1 3730 284.73 17 285 CPU AMD A4-4000 (AD4000O) 3.0 GHz/2core/SVGA RADEON HD 7480D/ 1 Mb/65W/5 GT/s Socket FM2 5.2 1492 286.92 18 282 CPU AMD A4-5300 (AD5300O) 3. 4 GHz/2core/SVGA RADEON HD 7480D/ 1 Mb/65W/5 GT/s Socket FM2
5.6 1627 290.54 19 232 CPU AMD A8-7500 (AD7500Y) 3.0 GHz/4core/SVGA RADEON R7/ 4 Mb/65W/5 GT/s Socket FM2+ 12.3 3614 293.82 20 283 CPU AMD Athlon X2 340 (AD340XO) 3.2 GHz/2core/ 1 Mb/65W/5 GT/s Socket FM2 5.3 1562 294.72 21 187 CPU AMD FX-6100 (FD6100W) 3.3 GHz/6core/ 6+8Mb/95W/5200 MHz Socket AM3+ 15.1 4488 297.22 22 240 CPU Intel Pentium G4400 3.3 GHz/2core/SVGA HD Graphics 510/0.5+3Mb/54W/8 GT/s LGA1151 11.3 3381 299.2 23 144 CPU AMD FX-8300 (FD8300W) 3. 3 GHz/8core/ 8+8Mb/95W/5200 MHz Socket AM3+
21.2 6353 299.67 24 284 CPU AMD A4-4020 (AD4020O) 3.2 GHz/2core/SVGA RADEON HD 7480D/ 1 Mb/65W/5 GT/s Socket FM2 5.2 1574 302.69 25 110 CPU AMD FX-8350 (FD8350F) 4.0 GHz/8core/ 8+8Mb/125W/5200 MHz Socket AM3+ 25.2 7635 302.98 26 183 CPU Intel Pentium G4600 3.6 GHz/2core/SVGA HD Graphics 630/0.5+3Mb/51W/8GT/s LGA1151 15.4 4721 306.56 27 274 CPU AMD A4-6320 (AD6320O) 3.8 GHz/2core/SVGA Radeon HD 8370D/ 1 Mb/65W/5 GT/s Socket FM2 6.1 1895 310.66 28 157 CPU AMD FX-6350 (FD6350F) 3. 9 GHz/6core/ 6+8Mb/125W/5200 MHz Socket AM3+
18.9 5945 314.55 29 250 CPU Intel Celeron G3950 3.0 GHz/2core/SVGA HD Graphics 610/0.5+2Mb/51W/8GT/s LGA1151 10 3148 314.8 30 291 CPU AMD Athlon II X2 240 (ADX240O) 2.8 GHz/2core/ 2Mb/65W/ 4000MHz Socket AM3 4.5 1475 327.78 31 179 CPU Intel Pentium G4620 3.7 GHz/2core/SVGA HD Graphics 630/0.5+3Mb/51W/8GT/s LGA1151 15.8 5187 328.29 32 190 CPU Intel Pentium G4560 3.5 GHz/2core/SVGA HD Graphics 610/0.5+3Mb/54W/8GT/s LGA1151 15 5071 338.07 33 226 CPU AMD A8-7600 (AD7600Y) 3. 1 GHz/4core/SVGA RADEON R7/ 4 Mb/65W/5 GT/s Socket FM2+
12.4 4197 338.47 34 288 CPU AMD Athlon II X2 245 (ADX245O) 2.9 GHz/2core/ 2Mb/65W/ 4000MHz Socket AM3 4.6 1562 339.57 35 258 CPU Intel Celeron G3900T 2.6 GHz/2core/SVGA HD Graphics 510/0.5+2Mb/35W/8GT/s LGA1151 9 3089 343.22 36 122 CPU Intel Core i3-8100 3.6 GHz/4core/SVGA UHD Graphics 630/ 6Mb/65W/8 GT/s LGA1151 24 8393 349.71 37 231 CPU AMD A8 9600 (AD9600AG) 3.1 GHz/4core/SVGA RADEON R7/ 2 Mb/65W Socket AM4 12.3 4313 350.65 38 233 CPU AMD A8-7650K (AD765KX) 3. 3 GHz/4core/SVGA RADEON R7/ 4 Mb/95W/ Socket FM2+
12.3 4313 350.65 39 235 CPU Intel Pentium G4500 3.5 GHz/2core/SVGA HD Graphics 530/0.5+3Mb/51W/8 GT/s LGA1151 12.1 4255 351.65 40 279 CPU AMD A6-5400K (AD540KO) 3.6 GHz/2core/SVGA RADEON HD 7540D/ 1 Mb/65W/5 GT/s Socket FM2 5.8 2046 352.76 41 272 CPU AMD A4-7300 (AD7300O) 3.8 GHz/2core/SVGA Radeon HD 8470D/ 1 Mb/65W/5 GT/s Socket FM2 6.2 2203 355.32 42 289 CPU AMD Athlon II X2 250 (ADX250O) 3.0 GHz/2core/ 2Mb/65W/ 4000MHz Socket AM3 4.6 1644 357.39 43 53 CPU AMD Ryzen 5 1600 (YD1600B) 3. 2 GHz/6core/3+16Mb/65W Socket AM4
39.1 13988 357.75 44 112 CPU AMD FX-8370 (FD8370F) 4.0 GHz/8core/ 8+8Mb/125W/5200 MHz Socket AM3+ 25.2 9150 363.1 45 199 13.7 5071 370.15 46 260 CPU Intel Pentium G2030 3.0 GHz/2core/SVGA HD Graphics/0.5+3Mb/55W/5 GT/s LGA1155 8.8 3264 370.91 47 217 CPU AMD A8-7670K (AD767KX) 3.9 GHz/4core/SVGARADEON R7/4 Mb/95W/5 GT/s Socket FM2+ 13 4838 372.15 48 99 CPU AMD FX-9370 (FD9370F) 4.4 GHz/8core/ 8+8Mb/220W/5200 MHz Socket AM3+ 26.6 9966 374. 66
49 158 CPU AMD Ryzen 3 1200 (YD1200B) 3.1 GHz/4core/2+8Mb/65W Socket AM4 18.8 7052 375.11 50 263 CPU Intel Pentium G2020 2.9 GHz/2core/SVGA HD Graphics/0.5+3Mb/55W/5 GT/s LGA1155 8.5 3206 377.18 51 41 CPU AMD Ryzen 5 1600X (YD160XB) 3.6 GHz/6core/3+16Mb/95W socket AM4 42.6 16435 385.8 52 264 CPU Intel Pentium G2010 2.8 GHz/2core/SVGA HD Graphics/0.5+3Mb/55W/5 GT/s LGA1155 8.4 3322 395.48 53 103 CPU AMD Ryzen 5 1400 (YD1400B) 3.2 GHz/4core/2+8Mb/65W Socket AM4 25.9 10316 398.3 54 220 CPU AMD A10-7800 (AD7800Y) 3. 5 GHz/4core/SVGA RADEON R7/ 4Mb/65W/5 GT/s Socket FM2+
12.7 5071 399.29 55 267 CPU AMD A6-7400K (AD740KY) 3.5 GHz/2core/SVGA RADEON R5/ 1Mb/65W/5 GT/s Socket FM2+ 6.5 2629 404.46 56 244 CPU Intel Core 2 Quad Q8300 2.5 GHz/4core/ 4Mb/95W/ 1333MHz LGA775 10.8 4371 404.72 57 237 CPU Intel Pentium G4520 3.6 GHz/2core/SVGA HD Graphics 530/0.5+3Mb/51W/8 GT/s LGA1151 12 4896 408 58 84 CPU AMD Ryzen 5 1500X (YD150XB) 3.5 GHz/4core/2+16Mb/65W Socket AM4 29.7 12298 414.07 59 143 CPU AMD Ryzen 3 1300X (YD130XB) 3. 5 GHz/4core/2+8Mb/65W Socket AM4
21.5 8917 414.74 60 259 CPU Intel Core 2 Quad Q8200 2.33 GHz/4core/ 4Mb/95W/ 1333MHz LGA775 8.9 3730 419.1 61 270 CPU AMD A6-6400K (AD640KO) 3.9 GHz/2core/SVGA RADEON HD 8470D/ 1 Mb/65W/5 GT/s Socket FM2 6.3 2652 420.95 62 92 CPU AMD FX-9590 (FD9590F) 4.7 GHz/8core/ 8+8Mb/220W/5200 MHz Socket AM3+ 28.2 11890 421.63 63 202 CPU AMD A10-7870K (AD787KX) 3.9GHz/4core/SVGA RADEON R7/ 4 Mb/95W/5 GT/s Socket FM2+ 13.6 5945 437.13 64 215 CPU Intel Pentium G4600T 3. 0 GHz/2core/SVGA HD Graphics 630/0.5+3Mb/35W/8GT/s LGA1151
13.1 5770 440.46 65 31 CPU AMD Ryzen 7 1700 (YD1700B) 3.0 GHz/8core/4+16Mb/65W Socket AM4 46.9 20865 444.88 66 171 CPU Intel Core i3-7100 3.9 GHz/2core/SVGA HD Graphics 630/0.5+ 3Mb/51W/8 GT/s LGA1151 17.1 7693 449.88 67 211 CPU AMD A10-9700 (AD9700AG) 3.5 GHz/4core/SVGA RADEON R7/2 Mb/65W/Socket AM4 13.2 6003 454.77 68 219 CPU AMD A10-7860K (AD786KY) 3.6 GHz/4core/SVGA RADEON R7/ 4 Mb/65W/5 GT/s Socket FM2+ 12.8 5887 459.92 69 271 CPU AMD A6-7470K (AD747KY) 3. 7 GHz/2core/SVGA RADEON R5/ 1Mb/65W/5 GT/s Socket FM2+
6.3 2903 460.79 70 177 CPU Intel Core i3-6100 3.7 GHz/2core/SVGA HD Graphics 530/0.5+ 3Mb/51W/8 GT/s LGA1151 16.4 7635 465.55 71 249 CPU Intel Core 2 Quad Q8400 2.66 GHz/4core/ 4Mb/95W/ 1333MHz LGA775 10 4663 466.3 72 280 CPU Intel Core 2 Duo E8300 2.83 GHz/2core/ 6Mb/65W/ 1333MHz LGA775 5.8 2751 474.31 73 290 CPU Intel Core 2 Duo E7200 2.53 GHz/2core/ 3Mb/65W/ 1066MHz LGA775 4.6 2186 475.22 74 213 CPU AMD A10-7850K (AD785KX) 3. 7 GHz/4core/SVGA RADEON R7/ 4 Mb/95W/5 GT/s Socket FM2+
13.1 6236 476.03 75 97 CPU Intel Core i3-8350K 4.0 GHz/4core/SVGA UHD Graphics 630/ 8Mb/91W/8 GT/s LGA1151 26.7 12822 480.22 76 286 CPU Intel Core 2 Duo E8200 2.66 GHz/2core/ 6Mb/65W/ 1333MHz LGA775 5.1 2460 482.35 77 247 CPU Intel Pentium G4400T 2.9 GHz/2core/SVGA HD Graphics 510/0.5+3Mb/35W/8 GT/s LGA1151 10.1 4896 484.75 78 238 CPU AMD A10 9700E (AD9700AH) 3.0 GHz/4core/SVGA RADEON R7/2 Mb/35W Socket AM4 12 5828 485.67 79 245 CPU Intel Pentium G3260 3. 3 GHz/2core/SVGA HD Graphics/0.5+3Mb/53W/5 GT/s LGA1150
10.2 4954 485.69 80 115 CPU Intel Core i5-6400 2.7 GHz/4core/SVGA HD Graphics 530/1+6Mb/65W/ LGA1151 24.6 11948 485.69 81 261 CPU Intel Celeron G1840 2.8 GHz/2core/SVGA HD Graphics/0.5+2Mb/53W/5GT/s LGA1150 8.8 4371 496.7 82 194 CPU AMD A10-7890K (AD789KX) 4.1 GHz/4core/SVGA RADEON R7/4 Mb/95W/5 GT/s Socket FM2+ 13.9 7052 507.34 83 166 CPU Intel Core i3-7300 4 GHz/2core/SVGA HD Graphics 630/ 4Mb/ LGA1151 17.7 9092 513.67 84 277 CPU Intel Core 2 Duo E8400 3. 0 GHz/2core/ 6Mb/65W/ 1333MHz LGA775
5.9 3089 523.56 85 164 CPU Intel Core i3-7320 4.1 GHz/2core/SVGA HD Graphics 630/ 4Mb/ LGA1151 18.1 9500 524.86 86 51 CPU Intel Core i5-8600K 3.6 GHz/6core/SVGA UHD Graphics 630/1.5+9Mb/95W/8 GT/s LGA1151 39.3 20632 524.99 87 169 CPU Intel Core i3-6320 3.9 GHz/2core/SVGA HD Graphics 530/0.5+ 4Mb/51W/8 GT/s LGA1151 17.4 9209 529.25 88 135 CPU Intel Core i5-7400 3 GHz/4core/SVGA HD Graphics 630/1+6Mb/65W/8 GT/s LGA1151 22.3 11831 530.54 89 161 CPU Intel Core i3-7350K 4. 2 GHz/2core/SVGA HD Graphics 630/ 4Mb/60W/8 GT/s LGA1151
18.5 9908 535.57 90 269 CPU AMD A6-6420K (AD642KO) 4.0 GHz/2core/SVGA RADEON HD 8470D/ 1 Mb/65W/5 GT/s Socket FM2 6.4 3439 537.34 91 265 CPU Intel Celeron G1840T 2.5 GHz/2core/SVGA HD Graphics/0.5+2Mb/35W/5 GT/s LGA1150 8 4313 539.13 92 175 CPU Intel Core i3-6300 3.8 GHz/2core/SVGA HD Graphics 530/0.5+ 4Mb/51W/8 GT/s LGA1151 17 9267 545.12 93 201 CPU AMD A12 9800 (AD9800AU) 3.8 GHz/4core/SVGA RADEON R7/2 Mb/65W/Socket AM4 13.6 7460 548.53 94 121 CPU Intel Core i5-7500 3. 4 GHz/4core/SVGA HD Graphics 630/1+6Mb/65W/8 GT/s LGA1151
24.1 13521 561.04 95 234 CPU Intel Core i3-3240 3.4 GHz/2core/SVGA HD Graphics 2500/0.5+3Mb/55W/5 GT/s LGA1155 12.1 6819 563.55 96 268 CPU AMD A6 9500E (AD9500AH) 3.0 GHz/2core/SVGA RADEON R5/ 1 Mb/35W Socket AM4 6.4 3614 564.69 97 192 CPU Intel Core i3-4170 3.7 GHz/2core/SVGA HD Graphics 4400/0.5+3Mb/54W/5 GT/s LGA1150 14.4 8160 566.67 98 25 CPU Intel Core i7-8700K 3.7 GHz/6core/SVGA UHD Graphics 630/1.5+12Mb/95W/8 GT/s LGA1151 50.6 29257 578.2 99 189 CPU Intel Core i3-7100T 3. 4 GHz/2core/SVGA HD Graphics 630/0.5+ 3Mb/35W/8 GT/s LGA1151
15 8684 578.93 100 76 CPU Intel Xeon E3-1230 V6 3.5 GHz/4core/1+8Mb/72W/8 GT/s LGA1151 31.7 18417 580.98 101 146 CPU Intel Core i5-4570 3.2 GHz/4core/SVGA HD Graphics 4600/1+6Mb/84W/5 GT/s LGA1150 21.1 12414 588.34 102 102 CPU Intel Core i5-7600 3.5 GHz/4core/SVGA HD Graphics 630/1+6Mb/65W/8 GT/s LGA1151 26 15386 591.77 103 80 CPU Intel Xeon E3-1230 V5 3.4 GHz/4core/1+8Mb/80W/8 GT/s LGA1151 30.8 18300 594.16 104 71 CPU Intel Xeon E3-1240 V6 3. 7 GHz/4core/1+8Mb/72W/8 GT/s LGA1151
33.2 20107 605.63 105 151 CPU Intel Core i5-4460 3.2 GHz/4core/SVGA HD Graphics 4600/1+6Mb/84W/5 GT/s LGA1150 19.9 12064 606.23 106 155 CPU Intel Core i5-4440 3.1 GHz/4core/SVGA HD Graphics 4600/1+6Mb/84W/5 GT/s LGA1150 19.3 11715 606.99 107 257 CPU Intel Core 2 Quad Q9400 2.66 GHz/4core/ 6Mb/95W/ 1333MHz LGA775 9.1 5537 608.46 108 141 CPU Intel Core i5-6402P 2.8 GHz/4core/SVGA HD Graphics 510/1+6Mb/65W/8 GT/s LGA1151 21.6 13172 609.81 109 193 CPU Intel Core i3-6100T 3. 2 GHz/2core/SVGA HD Graphics 530/0.5+3Mb/35W/ LGA1151
14.3 8801 615.45 110 139 CPU Intel Core i5-6500 3.2 GHz/4core/SVGA HD Graphics 530/1+6Mb/65W/ LGA1151 22.1 13638 617.1 111 294 CPU Intel Pentium E6300 2.8 GHz/2core/ 2Mb/65W/ 1066MHz LGA775 3.9 2407 617.18 112 105 CPU Intel Core i5-6600K 3.5 GHz/4core/SVGA HD Graphics 530/1+6Mb/91W/ LGA1151 25.8 15969 618.95 113 118 CPU Intel Core i5-6600 3.3 GHz/4core/SVGA HD Graphics 530/1+6Mb/65W/ LGA1151 24.2 15095 623.76 114 73 CPU Intel Xeon E3-1240 V5 3. 5 GHz/4core/1+8Mb/80W/8 GT/s LGA1151
31.8 19991 628.65 115 96 CPU Intel Xeon E3-1230 V3 3.3 GHz/4core/1+8Mb/80W/5 GT/s LGA1150 26.9 16960 630.48 116 55 CPU Intel Core i7-5820K 3.3 GHz/6core/1.5+15Mb/140W/5 GT/s LGA2011-3 37.8 23895 632.14 117 242 CPU Intel Core 2 Quad Q9450 2.66 GHz/4core/ 12Mb/95W/ 1333MHz LGA775 10.9 6936 636.33 118 70 CPU Intel Xeon E3-1245 V6 3.7 GHz/4core/SVGA HD Graphics P630/1+8Mb/73W/8 GT/s LGA1151 33.2 21214 638.98 119 136 CPU Intel Xeon E3-1220 V6 3.0 GHz/4core/1+8Mb/72W/8 GT/s LGA1151 22. 3
14279 640.31 120 72 CPU Intel Xeon E5-2660 2.2 GHz/8core/2+20Mb/95W/8 GT/s LGA2011 33.2 21273 640.75 121 65 CPU Intel Core i7-7700 3.6 GHz/4core/SVGA HD Graphics 630/1+8Mb/65W/8 GT/s LGA1151 34 21797 641.09 122 137 CPU Intel Xeon E3-1220 V5 3.0 GHz/4core/1+8Mb/80W/8 GT/s LGA1151 22.3 14396 645.56 123 81 CPU Intel Xeon E5-2650 2.0 GHz/8core/2+20Mb/95W/8 GT/s LGA2011 29.7 19233 647.58 124 44 CPU Intel Core i7-6800K 3.4 GHz/6core/1.5+15Mb/140W LGA2011-3 41.6 27159 652. 86
125 101 CPU Intel Xeon E3-1231 V3 3.4 GHz/4core/1+8Mb/80W/5 GT/s LGA1150 26.4 17251 653.45 126 124 CPU Intel Xeon E3-1225 V6 3.3 GHz/4core/SVGA HD Graphics P630/1+8Mb/73W/8 GT/s LGA1151 23.8 15561 653.82 127 113 CPU Intel Xeon E5-2630 2.3 GHz/6core/1.5+15Mb/95W/7.2 GT/s LGA2011 24.8 16261 655.69 128 58 CPU Intel Xeon E5-2670 2.6 GHz/8core/2+20Mb/115W/8 GT/s LGA2011 36.9 24245 657.05 129 185 CPU Intel Core i3-4370 3.8 GHz/2core/SVGA HD Graphics4600/0.5+4Mb/54W/5 GT/s LGA1150 15.1 9966 660 130 59 CPU Intel Core i7-7700K 4. 2 GHz/4core/SVGA HD Graphics 630/1+8Mb/91W/8 GT/s LGA1151
36.7 24420 665.4 131 79 CPU Intel Xeon E3-1245 V5 3.5 GHz/4core/SVGA HD Graphics P530/1+8Mb/80W/8 GT/s LGA1151 30.9 20632 667.7 132 89 CPU Intel Core i7-4770 3.4 GHz/4core/SVGA HD Graphics 4600/1+8Mb/84W/5 GT/s LGA1150 28.3 18941 669.29 133 149 CPU Intel Xeon E3-1220 V3 3.1 GHz/4core/1+8Mb/80W/5 GT/s LGA1150 20.4 13696 671.37 134 188 CPU Intel Core i3-6300T 3.3 GHz/2core/SVGA HD Graphics 530/0.5+4Mb/35W/ LGA1151 15 10083 672.2 135 128 CPU Intel Core i5-4690 3. 5 GHz/4core/SVGA HD Graphics4600/1+6Mb/84W/5 GT/s LGA1150
22.8 15445 677.41 136 293 CPU Intel Core 2 Duo E6550 2.33 GHz/2core/ 4Mb/65W/ 1333MHz LGA775 3.9 2687 688.97 137 36 CPU Intel Core i7-8700 3.2 GHz/6core/SVGA UHD Graphics 630/1.5+12Mb/65W/8 GT/s LGA1151 44.7 30889 691.03 138 125 CPU Intel Xeon E3-1225 V5 3.3 GHz/4core/SVGA HD Graphics P530/1+8Mb/80W/8 GT/s LGA1151 23 15911 691.78 139 64 CPU Intel Core i7-6700K 4.0 GHz/4core/SVGA HD Graphics 530/1+8Mb/91W/8 GT/s LGA1151 34.2 24128 705.5 140 152 CPU Intel Core i5-3570 3. 4 GHz/4core/SVGA HD Graphics 2500/1+6Mb/77W/5 GT/s LGA1155
19.8 14163 715.3 141 156 CPU Intel Core i5-4460S 2.9 GHz/4core/ LGA1150 19 13638 717.79 142 140 CPU Intel Xeon E3-1226 V3 3.3 GHz/4core/SVGA HD Graphics P4600/1+8Mb/84W/5 GT/s LGA1150 21.9 15736 718.54 143 68 CPU Intel Xeon E3-1270 V6 3.8 GHz/4core/1+8Mb/72W/8 GT/s LGA1151 33.9 24420 720.35 144 170 CPU Intel Xeon E5-2603 V4 1.7 GHz/6core/1.5+15Mb/85W/6.4 GT/s LGA2011-3 17.3 12647 731.04 145 126 CPU Intel Core i5-7600K 3.8 GHz/4core/SVGA HD Graphics 630/1+6Mb/91W/8 GT/s LGA1151 22. 8
16669 731.1 146 38 CPU Intel Core i7-6850K 3.6 GHz/6core/1.5+15Mb/140W LGA2011-3 43.3 31880 736.26 147 109 CPU Intel Xeon E3-1241 V3 3.5 GHz/4core/1+8Mb/80W/5 GT/s LGA1150 25.5 18941 742.78 148 69 CPU Intel Xeon E3-1275 V6 3.8 GHz/4core/SVGA HD Graphics P630/1+8Mb/73W/8 GT/s LGA1151 33.9 25236 744.42 149 87 CPU Intel Core i7-6700 3.4 GHz/4core/SVGA HD Graphics 530/1+8Mb/65W/8 GT/s LGA1151 28.8 21739 754.83 150 83 CPU Intel Xeon E5-2620 V3 2.4 GHz/6core/1.5+15Mb/85W/8 GT/s LGA2011-3 29. 7
22497 757.47 151 160 CPU Intel Xeon E3-1220 V2 3.1 GHz/4core/69W LGA1155 18.6 14104 758.28 152 77 CPU Intel Xeon E3-1270 V5 3.6 GHz/4core/1+8Mb/80W/8 GT/s LGA1151 31.7 24070 759.31 153 62 CPU Intel Xeon E5-2620 V4 2.1 GHz/8core/+20Mb/85W/8 GT/s LGA2011-3 35.8 27683 773.27 154 90 CPU Intel Xeon E5-1620 V4 3.5 GHz/4core/1+10Mb/140W LGA2011-3 28.3 21914 774.35 155 78 CPU Intel Core i7-4790K 4.0 GHz/4core/SVGA HD Graphics 4600/1+8Mb/88W/5 GT/s LGA1150 31.4 24362 775. 86
156 243 CPU Intel Core 2 Quad Q9550 2.83 GHz/4core/ 12Mb/95W/ 1333MHz LGA775 10.8 8451 782.5 157 292 CPU Intel Core 2 Duo E8500 3.16 GHz/2core/ 6Mb/65W/ 1333MHz LGA775 4.3 3381 786.28 158 74 CPU Intel Xeon E3-1275 V5 3.6 GHz/4core/SVGA HD Graphics P530/1+8Mb/80W/8 GT/s LGA1151 31.7 25177 794.23 159 222 CPU Intel Core i3-4350T 3.1 GHz/2core/SVGA HD Graphics 4600/0.5+4Mb/35W/5 GT/s LGA1150 12.6 10141 804.84 160 108 CPU Intel Core i7-3770 3.4 GHz/4core/SVGA HD Graphics 4000/1+8Mb/77W/5 GT/s LGA1155 25.6 20748 810. 47
161 49 CPU Intel Core i7-5930K 3.5 GHz/6core/1.5+15Mb/140W/5 GT/s LGA2011-3 41.2 33745 819.05 162 295 CPU Intel Pentium E5500 2.8 GHz/2core/ 2Mb/65W/ 800MHz LGA775 2.8 2297 820.36 163 182 CPU Intel Xeon E5-2603 V3 1.6 GHz/6core/1.5+15Mb/85W/6.4 GT/s LGA2011-3 15.4 12997 843.96 164 241 CPU Intel Core 2 Quad Q9650 3.0 GHz/4core/ 12Mb/95W/ 1333MHz LGA775 10.9 9209 844.86 165 297 CPU Intel Pentium Dual-Core E5400 2.7 GHz/2core/ 2Mb/65W/ 800MHz LGA775 2.7 2308 854.81 166 116 CPU Intel Core i7-4790 3. 6 GHz/4core/SVGA HD Graphics 4600/1+8Mb/84W/5 GT/s LGA1150
24.3 21040 865.84 167 287 CPU Intel Core 2 Duo E8600 3.33 GHz/2core/ 6Mb/65W/ 1333MHz LGA775 4.9 4313 880.2 168 43 CPU Intel Xeon E5-2660 V2 2.2 GHz/10core/2.5+25Mb/95W/8 GT/s LGA2011 41.8 37300 892.34 169 248 CPU Intel Xeon E5-2603 V2 1.8 GHz/4core/1+10Mb/80W/6.4 GT/s LGA2011 10.1 9209 911.78 170 119 CPU Intel Xeon E5-2620 V2 2.1 GHz/6core/1.5+15Mb/80W/7.2 GT/s LGA2011 24.1 23312 967.3 171 131 CPU Intel Xeon E5-2609 V4 1.7 GHz/8core/2+20Mb/85W/6. 4 GT/s LGA2011-3
22.6 21914 969.65 172 35 CPU Intel Xeon E5-2630 V4 2.2 GHz/10core/+25Mb/85W/8 GT/s LGA2011-3 45.3 45575 1006.07 173 207 CPU Intel Core i5-4590 3.3 GHz/4core/SVGA HD Graphics 4600/1+6Mb/84W/5 GT/s LGA1150 13.3 13638 1025.41 174 85 CPU Intel Xeon E5-1630 V4 3.7 GHz/4core/1+10Mb/140W LGA2011-3 29 30364 1047.03 175 54 CPU Intel Xeon E5-2630 V3 2.4 GHz/8core/2+20Mb/85W/8 GT/s LGA2011-3 38.8 40971 1055.95 176 42 CPU Intel Xeon E5-1650 V4 3.6 GHz/6core/1.5+15Mb/140W/5 GT/s LGA2011-3 41. 9
44876 1071.03 177 18 CPU Intel Core i7-6900K 3.2 GHz/8core/2+20Mb/140W LGA2011-3 57.9 63467 1096.15 178 27 CPU Intel Core i7-5960X 3.0 GHz/8core/2+20Mb/140W/5 GT/s LGA2011-3 50.3 57406 1141.27 179 165 CPU Intel Xeon E5-2609 V3 1.9 GHz/6core/1.5+15Mb/85W/6.4 GT/s LGA2011-3 17.8 20690 1162.36 180 296 CPU Intel Pentium D 945 3.4GHz/2core/ 4Mb/95W/ 800MHz LGA775 2.7 3206 1187.41 181 88 CPU Intel Xeon E3-1281 V3 3.7 GHz/4core/1+8Mb/82W/5 GT/s LGA1150 28.4 35610 1253. 87
182 67 CPU Intel Xeon E3-1280 V6 3.9 GHz/4core/1+8Mb/72W/8 GT/s LGA1151 33.9 43477 1282.51 183 28 CPU Intel Xeon E5-2640 V4 2.4 GHz/10core/+25Mb/90W/8 GT/s LGA2011-3 48.5 62651 1291.77 184 75 CPU Intel Xeon E3-1280 V5 3.7 GHz/4core/1+8Mb/80W/8 GT/s LGA1151 31.7 43128 1360.5 185 29 CPU Intel Xeon E5-2650 V3 2.3 GHz/10core/2.5+25Mb/105W/9.6GT/s LGA2011-3 46.9 66032 1407.93 186 47 CPU Intel Xeon E5-2640 V3 2.6 GHz/8core/2+20Mb/90W/8 GT/s LGA2011-3 41.5 58922 1419.81 187 130 CPU Intel Xeon E5-2623 V4 2. 6 GHz/4core/1+10Mb/85W/8 GT/s LGA2011-3
22.8 32696 1434.04 188 20 CPU Intel Xeon E5-2650 V4 2.2 GHz/12core/3+30Mb/105W/9.6 GT/s LGA2011-3 53.2 80427 1511.79 189 14 CPU Intel Xeon E5-2680 V3 2.5 GHz/12core/3+30Mb/120W/9.6 GT/s LGA2011-3 58.4 88994 1523.87 190 16 CPU Intel Xeon E5-2660 V4 2.0 GHz/14core/3+35Mb/105W/9.6 GT/s LGA2011-3 58.2 1603.21 191 19 CPU Intel Xeon E5-2670 V3 2.3 GHz/12core/3+30Mb/120W/9.6 GT/s LGA2011-3 53.7 86605 1612.76 192 10 CPU Intel Xeon E5-2680 V4 2.4 GHz/14core/3+35Mb/120W/9. 6 GT/s LGA2011-3
67.9 116852 1720.94 193 11 CPU Intel Core i7-6950X 3.0 GHz/10core/2+25Mb/140W LGA2011-3 63.1 111607 1768.73 194 12 CPU Intel Xeon E5-2690 V3 2.6 GHz/12core/3+30Mb/135W/9.6 GT/s LGA2011-3 61.8 118950 1924.76 195 6 CPU Intel Xeon E5-2690 V4 2.6 GHz/14core/3+35Mb/135W/9.6 GT/s LGA2011-3 72.6 146108 2012.51 196 46 CPU Intel Xeon E5-2643 V4 3.4 GHz/6core/1.5+20Mb/135W/9.6 GT/s LGA2011-3 41.5 104904 2527.81 197 23 CPU Intel Xeon E5-2667 V4 3.2 GHz/8core/2+25Mb/135W/9.6 GT/s LGA2011-3 52. 2
143602 2751 Graphics: fast, slow and integrated
Part 24: Intel HD Graphics of the third and fourth generations
an article that studied Celeron, Pentium and Core i3 was published more than a year ago, so it was limited to Sandy Bridge and Ivy Bridge. From the point of view of a potential buyer, of course, this situation is wrong. After all, the integrated graphics core in a top desktop processor is usually used by those for whom its characteristics are not important, so, by and large, the HDG 2500 is enough. If not enough, then a discrete video card is usually purchased, especially since owners of computers on Core i7 or Core i5 can easily afford not to save on the latter. Yes, and in older models of laptops, manufacturers often put a discreet on the principle of «so that it is.» Let it often turn out to be a GPU, comparable in performance to the built-in one, but it is not always possible to fight off such a “concern”.
But in the budget segment, everything is completely different. Of course, Pentium (not to mention Core i3) can be used to assemble a good gaming computer. And if we limit ourselves to a single-user mode, then it’s not even “not bad”, but good (as we have already seen). However, with serious performance requirements, you usually have to purchase expensive video cards without saving on other systems, so here you can not save too much on the processor (especially since, as we have already written more than once, at the moment all processors in the consumer segment are very inexpensive ). Who needs the cheapest models? Mostly for those who have to save every dollar (and even more often — a ruble or hryvnia), so buying a decent discrete video card is not even considered (or is being considered, but somewhere in the future). «Indecent» now, as has been shown more than once, there is no point in acquiring it at all — thrown out money, which still will not allow you to get a qualitative advantage over the use of integrated graphics.
But in this case, the characteristics of the latter may begin to be of decisive importance — simply because in interactive applications (which include games), quantitative characteristics translate into quite qualitative differences. In other words, there is not much difference — in how many minutes it will eventually take to import into the database or process a large number of images: of course, 15 minutes is better than 30, but in the end the work will be done (even if you have to drink an extra cup of coffee or look for another some occupation). At the same time, 15 (and even 20-25) and 30 frames per second in the game are already qualitative differences: in the second case, the game can be played with the selected settings, but not yet in the first case. In general, the question is fundamental. So the answer to it is interesting to many. Today we will look for him.
Testing: goals and objectives, configurations, methodology
This relatively large section will be common and the same for all articles: unfortunately, it is not enough for all people to explain something once 🙂 Moreover, not all readers will carefully study all the articles in the cycle — the probability of “starting from the middle” or simply limiting ourselves to one or two materials is extremely high, of which we are fully aware.
Therefore, we immediately apologize to those who are against the constant repetition of the same truths. Which, however, as you know, is the mother of learning 🙂
So, first and foremost, it should be taken into account that within the framework of this testing, we are not dealing exclusively with components — we are testing systems that consist of them. Separately, the processors are tested within the framework of the «main line» articles. Always in a fixed configuration — with a powerful video card, a large amount of RAM, etc. We have on our website and directly test video cards in gaming applications, updated monthly. As part of i3D-Speed, all video cards (from a simple budget card to a multi-GPU) are tested on a powerful configuration, chosen based on the sufficiency for the graphics component of any power. That is, we believe that from the point of view of traditional «component» testing, these two lines of articles are quite enough.
But for the practical use of the results obtained within their framework, a certain link is needed.
The fact is that applications whose performance does not depend on the central processor do not exist in nature. There are, of course, cases when it is limited to other components, but this very often happens at different levels for different processors. Gaming and similar applications significantly depend on the performance of the GPU, but they also put a lot of load on the CPU. If the task is too “light” for graphics, only the processor begins to determine everything. If it is “heavy”, then the influence of the processor, on the contrary, becomes minimal, and sometimes it can even be ignored. Between these extreme cases, both components are important, and the degree of their importance can be reversed. A priori in an unknown way. That is, from the fact that one processor is faster than another using a powerful video card, it does not follow that the ratio will be maintained if it is replaced with a budget one. More precisely, in some modes it will remain, in some it will change, in some everything will simply be the same.
A similar problem is inherent in video cards — the level of «sufficiency» of the CPU varies depending on the GPU and its mode of operation.
It would seem that it would be enough to simply test all the «processor + video» bundles. The solution is obvious and correct in theory, but practically impracticable in practice, since the amount of work is growing exponentially. In other words, 40 video cards on one system — 40 test configurations. 40 processors with one video card — also 40 configurations. And if you combine this, you get 1600 test configurations. Although, of course, if all this work can be done, truly invaluable results will be obtained. But by the time they are received, they will no longer be needed by anyone, since they will become obsolete (looking ahead — even the “simplified” method we have chosen allows us to test no more than a dozen configurations in a working week, so 1600 is a task for three years when using one stand).
But you can also approach it from the other side: do not try to find exact answers to all questions, but confine yourself to qualitative assessments.
At least for some of the processors, you can try to «feel» the lower level of performance. Which is integrated graphics, since recently it has become an integral part of most modern processors. And there are younger models of discrete adapters that are at least as good. But it is many times simpler and slower than top-end solutions — on the graphics market, the spread of characteristics is still greater than on the processor one. With this choice of equipment, we can significantly reduce the list of test configurations and modes. Indeed, the most relevant results will be for buyers of budget computers, since with the price of a system unit of 1000 dollars, you can give 10% of this amount for a slightly more powerful video card than the lower level, and not mess with the same integrated video. Simply — to be. So processors of the middle class and higher often do not need to be tested with weak video. Sometimes, of course, we will also do this — in order to have the necessary guidelines, but only sometimes.
In addition, systems of this class do not require tests in some outstanding modes, such as 2560 x 1600 with older variations on the theme of full-screen anti-aliasing 🙂 In a word, the work can be significantly simplified.
The fact that 90% of applications of the standard processor technique do not depend on video performance at all reduces the amount of work. In the previous series, we used all the programs, so four parts of it are quite sufficient proof of this fact. For whom it’s still not enough — there’s nothing we can do about it 🙂 Be that as it may, GPGPU is still nothing more than a curious experiment, and all work in this direction shows that it is generally special for systems with weak GPUs does not differ in relevance: powerful video cards on “good” tasks are really capable of speeding up something, but when trying to squeeze something worthwhile out of an entry-level discrete, very often all the steam goes into the whistle — the complication of algorithms and unnecessary data transfers “eat up” all the potential gain.
From which, however, one should not conclude that we will pass by some curious and popular application that can actively use GPU resources. Of course, we will not go through and add it to this experimental technique. Only here while the main problem that anything similar does not come across. More precisely, there are already “curious” programs, but are popular they still do not become for one reason or another. The same video transcoding, around which a lot of copies were broken, in fact, few people need it regularly, and the quality of work developed by enthusiasts of programs leaves much to be desired (this is still very mildly speaking). And (here it is a grimace of fate) is most quickly performed using specialized hardware blocks available in integrated Intel GPUs, and not at all on general-purpose pipelines.
Thus, we have not so many programs left that it makes sense to «drive» on systems with poor graphics. In fact, the «standard» method is literally simplified to five groups, three of which are experimental in it.
These are: Interactive work in three-dimensional packages No changes Mathematical and engineering calculations MAPLE and MATLAB are thrown out, since nothing is displayed on the screen, but the remaining three applications are interesting to readers, judging by the reviews (it is clear that it is hardly advisable to save so much on the workplace, but suddenly you have to work on a weak computer). In fact, it turns out that the composition of these two groups is the same as a result, but in the previous case, the “graphic” score of the corresponding test is taken into account, and in this case, the “processor” one: as testing practice has shown, in fact, both of them depend on both the processor and video cards, which is what we needGames No changesGames with low resolution and quality settings Within the framework of the «main» method, this group is practically not used in any way and does not affect the overall score, but it was made just for systems with weak graphics. Primarily mobile, but not that different from what we’re testing in this series High-definition video playback Needs no special comment
Since we do not have many groups, and all of them are quite specific, we will not give a general assessment.
We are primarily interested in results. Which, as usual, will be fully compatible with those obtained on the configurations of the main testing line, since we already know for sure that video cards do not affect other applications in any way. So, if you wish, you can simply replace the corresponding piece in the “large” table, since we do not hide them in any way. However, it should be borne in mind that the scores of this test are in no way compatible with the main line: here we take a system with Celeron G540 and Radeon HD 6450 512 MB GDDR3 as a scale unit, so for independent fraud, you should download a table in Microsoft Excel format, in which all the results are given both in the converted into points and in the «natural» form. 953
55 54 55 54 Desktop Celerons based on the Haswell microarchitecture have been announced recently and have not yet reached our hands, and the Bay Trail is a completely different story: only BGA and W make these models maximally competitors of CULV processors, but by no means «standard desktop» platforms.
But Pentium and Core i3 of various modifications are massively available for both LGA1155 and the new LGA1150. Accordingly, three pairs of processors will take part in our testing — two Pentiums and four Core i3s. With Pentium, everything is simple — we took two processors with the same clock speed of computing cores: the old G2140 and the new G3430. Please note that the graphics core of lower-end models is still called HD Graphics, although this is already the fourth GPU with this name, and it differs from the previous two not only architecturally, but also the number of pipelines has increased from 6 to 10. That is, the difference with Ivy Bridge will be sure, but there is nothing to compare with the Pentium and Celeron on Sandy Bridge that are still on sale — the functionality is very different, which we already noted a little over a year ago.
There is no naming confusion in the Core i3 family. Moreover, there is more order in general — earlier the company offered both processors with the HDG 2500 core (the most popular in desktop Ivy Bridge), and several modifications with the HDG 4000.
This ensured the equality of selling prices, but the frequency of computing cores was always higher (with this condition) for models with a lower graphics core. The new generation was divided into two families. The heirs of the old Core i3 are models of the 41×0 line, similar to them in terms of frequencies and cache memory capacity and equipped with HDG 4440. The more expensive processors of the 43×0 line have become a relatively new product, where not only the oldest among the “socket” GPU HDG 4600 processors, but and all 4 MiB of L3 cache is used: as in the first generation Core i3 or mobile dual-core Core i7. In general, the positioning of new processors has become simpler and more logical: we pay more — we get more. In all respects. There are also intersections in clock frequency with the previous generation, which gave us two equal pairs 3245-4130 and 3250-4330.
Another guest from another world is a video card based on the GeForce GT 630. We already tested something with this name a year ago, but exactly what with the name: the old products were based on the GF108, and the new ones use the GK208 chip.
NVIDIA itself claims that this is a new development, but in fact the GPU is very similar to the cropped GK107 (previously used in the GT 640 and higher). Moreover, cropped in a software way — both have the same area and partially coinciding wiring. Why partially? Because the GK208 lacks one memory channel, and the bus interface is only PCIe x8, not x16. Thus, it is obvious that at comparable frequencies, the GT 630 is not a competitor to the old GT 640, despite the same number of GPUs. But compared to the old GT 630 DDR3, everything should not be so bad: the «narrow» memory bus is partially compensated by its higher clock frequency (1800 MHz against the official 1600 MHz, which in real products often dried up to 1400 MHz), and the arithmetic capabilities of the chip are much higher — at the level of GT 640. Another question is whether such a level is needed in a modern computer or is it better to use integrated video? 🙂 On the other hand, what is important, the cards based on the GK208 are compact and completely equipped with passive cooling (because the GPU does not heat up very well), and at the price they can compete with the GT 610 / 620, which differ by absolutely no performance.
In general, these solutions have a certain niche — at least an upgrade of old compact systems. Well, we will determine the exact performance level using a card from ASUS with 2 GB DDR3 (we did not test the modification with 1 GB because there is nothing to do — different volumes in video cards of this level will not affect in any way), working together with Core i3-4330 (so that certainly the processor did not interfere).
Interactive work in 3D packages
As we already wrote, in driver version 9.18.10.3257, Intel programmers fixed another batch of errors, which led to a curious effect: even Pentium on Ivy Bridge (adding 20% to last year’s results) is already reaching the level any AMD APUs (with the possible exception of Kaveri, but these models are just starting to hit the retail chains). Moreover, this is the level of junior NVIDIA discrete gaming chips, even paired with a faster processor. In general, you should no longer be afraid of integrated Intel graphics. Especially after the release of Haswell, this is an even higher level of performance.
Moreover, as you can see, installing a lower game discrete (which was almost mandatory for such programs in the days of Sandy Bridge) significantly reduces performance, i.e. it’s better not to do this anymore.
Math and Engineering
HD Graphics didn’t get in the way here before as the results were mostly dependent on single-threaded CPU performance, which put Intel devices in a winning position, and now the situation has only worsened. But, by the way, pay attention — a discrete graphics card can improve the results. Simply because it does not claim either the processor’s cache memory or the thermal package. However, the gain is extremely small, which, together with a decrease in the «graphics» score, does not allow changing the conclusion — if you buy a discrete video card for professional programs, then certainly not a junior gaming one.
Aliens vs. Predator
As expected, the 3rd Gen HDG and the HDG 2500 are identical, something we’ll see more than once, so we won’t dwell on this result in the future.
The 4400 is only slightly faster than the 4000, which is forgivable — one of the younger decisions against the once older one. The HDG 4600 almost reaches the A6 performance — a noticeable step forward because, as we have already said, the HDG 4000 was only enough to fight the A4. And the difference between the two HDGs is even greater. Although in practice in this mode everything breaks down that even the A8-6600K (faster than the GT 630, by the way) is still not enough to get a comfortable frame rate. Therefore, the settings will have to be lowered.
At a minimum, of course, everything flies. In addition to the younger graphics configuration Ivy Bridge — even in this mode, it was barely enough to cross the border at 30 FPS. So I’m glad that the new graphics at least don’t have such problems. And even only Pentium is already behind the discrete GT 630 level, and even then a little, and installing such cards in a computer based on any new Core i3 is definitely a bad idea. Well, APU is ahead by a wide margin from the others.
The result was not unexpected, although there are hopes for at least an approximate parity of the older Core i3 with at least much cheaper A6. We have seen the once lower results even in very old A8, of course, however, AMD engineers and programmers have not been idle for the last year either 🙂
Batman: Arkham Asylum GOTY Edition
The high-quality (in our testing) mode of this game «surrendered» to integrated graphics from Intel after the introduction of the HDG 4000, and newer GPUs from the company, of course, are even faster. And even the Pentium was not enough just a little to make it to 30 FPS. An achievement that, however, fades against the background of the fact that even the old A4-5300 or the very ancient A6-3500 is still faster — AMD set the bar high, you can’t say anything. Actually, there is nothing surprising in the fact that the company’s APUs are already pushing out even the lower discreet from the market. And Intel, despite rapid progress, the pipe is lower and the smoke is thinner 🙂 However, it is also already clear that it makes no sense to install solutions of the GT 630 class (especially lower) into systems based on its new processors — there will be no fundamental increase in performance.
With a low picture quality and an old graphics engine, you get a comparison of processors for the most part. With slight variations: after all, the HDG 2500 (and its relatives of low-end families) are too weak a solution, and the use of a discrete one prevents the processor component from working at full capacity. But in general, it was possible to play in this mode even on the Celeron G555, and progress since its appearance allows you not to limit yourself so much.
Crysis: Warhead x64
An example of the opposite situation — so far no integrated graphics solution can handle this game with the selected settings. Moreover, as we can see, despite the steady increase in productivity, next year is unlikely to change much. Which is not surprising, since even the discrete Radeon HD 7750 DDR5 is enough for this with almost no speed margin. But if we evaluate not only the absolute results themselves, but the dynamics of their growth, the assessment of the situation changes somewhat.
As you can see, modern Pentiums have already reached a level that only a year ago was available only to some modifications of the Core i3. And the older representatives of the latest in terms of performance of the graphics core are now at the level of APUs of the A6 family or … Discrete video cards of not so long ago, such as the Radeon HD 6670 DDR3. Or quite modern GeForce GT 630. That is, the boundary between older (and even not the oldest) models of integrated GPUs and younger discrete ones is increasingly blurred.
It is worth lowering the picture quality to the level of ten-year-old games, as it immediately turns out that anything is enough, which is quite correlated with “worldly wisdom”. But it also makes such modes not too revealing, of course, however, as we have already said more than once, they were chosen at one time in an attempt to force graphics of lower classes to provide acceptable performance — for example, integrated into three-year-old low-power Celerons. However, some interesting information can be “squeezed” out of them even now.
In particular, the progress of Intel drivers is quite visible — just over a year ago, the Pentium G2120 here produced less than 50 frames per second, and with the new drivers, the G2140 became one and a half times faster. However, this is not enough to keep up with at least the cheap AMD A6, but the new Pentiums in games with simple graphics (either initially simple or simplified settings) can already “wrestle” with the A8. And, again, the only plus of a weak discrete is that it does not prevent the processor part from giving all the best. Although the effect of this when using inexpensive video cards, as we see, cannot be called significant.
F1 2010
Although the game will soon be four years old, it is still a tough nut to crack for integrated graphics. But in a slightly different way than Crysis — if the whole load fell on the GPU, then the processor performance is already important here, and it is desirable that the latter support more than two computation threads.
As a result, most of the lower-end solutions keep at 12.5 FPS thanks to the engine itself — it tries to “not fall” as much as possible, further simplifying the picture. Here HDG 4000 and above, as well as integrated Radeon HD work «honestly», but still too slowly. And no wonder — as we already know, more or less only top-end A10s can cope with this mode. And even better, as before, use discrete. Preferably at least Radeon HD 7730 DDR5 or higher.
In light mode, even with weak graphics, the shortcomings of dual-threaded processors are already visible. However, once again this is most noticeable when using AMD processors, but for Intel, the difference between Pentium and Core i3 is small (and the new Pentium may overtake the old i3). Therefore, the minimum should be considered something of class A8. Or buy a discrete graphics card — the specificity of the EGO engines (used in the entire Formula One series) is such that even a decrease in the graphics quality does not make it useless.
Far Cry 2
Far Cry 2 is even older, so only Intel and AMD A4/A6 processors can’t cope with the task even in high-quality mode. In general, the qualitative difference between Intel HD Graphics and an APU or a lower-end discrete — as you can see, it still persists, despite a very noticeable increase in performance in the new generation of GPUs.
But for the light mode, only Sandy Bridge was missing, and in the case of more modern devices, we get almost a test of the performance of the processors themselves. With quite predictable results.
Metro 2033
In fact, another stress test for integrated graphics — getting something more or less acceptable from it will not work for a long time. But for evaluating the performance itself, the GPU fits well. However, there is almost nothing new for us here, with the exception of perhaps the most noticeable difference between the two generations of Intel IGPs — Haswell really became a big step forward, allowing the company to almost catch up with the integrated Radeon.
More precisely, the HDG 4000 could already compete with the A4, which, however, did not pull on the achievement — too low a level for relatively expensive solutions. But the approximate parity with the A8 is all right. In theory, of course — in practice, as we already know, even $100 discs are too few.
Actually, even with the low quality mode (it’s not that low in this game, it should be noted that the minimum supported resolution of 1024 x 768 was often used in practice only recently), the integrated graphics «learned» to cope not so long ago. And not every one — the A6 based on Llano was the first to break the border, and the transition to Trinity turned out to be even a step backwards in this family (because the game can fully use multi-core processors), but, in general, there are enough of them. And there are no slower solutions. However, we again observe that within the new Intel platform, even Pentium is “enough”, but most of the products for the previous one could not cope due to the weakness of the mass HDG 2500.
That is, we actually have a transition from quantity to quality — something that “couldn’t” a year ago many Core i5, today «may» Pentium. Or any Core i3, not individual models of this family. Well, that’s good too.
Summary results
What do we have in the bottom line? If you remember that 100 points is a Radeon HD 6450 paired with a Celeron, then a lot. Indeed, mass graphics for LGA1155 (and this is the HDG 2500 and its analogue in Celeron / Pentium or generally weak, even functionally IGP Sandy Bridge) failed to even reach this level. The new Pentiums surpass it, i.e. the integrated GPU easily overtakes discrete products such as the aforementioned Radeon HD 6450 or GeForce GT 610/620. It is clear that all of them can only be called gaming solutions out of politeness, but they still exist and are still on sale (not to mention older video cards of a comparable level that continue to be used by many economical computer users). In addition, A4 for the FM1 platform was also left behind — also a base level, of course, and even for an outdated platform two years ago, but a couple of years ago, few believed that Intel would even be able to catch up with AMD in the foreseeable future: Sandy Bridge graphics in any variant could not be compared with desktop APUs of all modifications.
Core i3 at first glance «grew up» weaker — HDG 4400 is faster than HDG 4000 only by 20%, not one and a half times. Which is easily explained — if in the budget segment the number of pipelines increased from 6 to 10, then only from 16 to 20 «on the floor above». and the 4400 is the lower end of the new desktop Cores: most already use the HDG 4600, which has slightly better performance. In fact, we can even talk about the transition of quantity into quality — just a year ago, only the HDG 4000 (the very rare variant) could provide frame rates in games at the level of AMD APUs of the A4 line, but now parity has already formed with faster A6. Naturally, this does not look like a victory in any way — after all, in terms of price, even the A8 keep at the Pentium level, and the Core i3 are faster, but also noticeably more expensive processors, but the fact of gradually equalizing positions takes place. However, the release of APUs based on Kaveri may well be able to restore the status quo, but the mass distribution of these devices (and their promotion to the lower segments of the AMD range) will have to wait.
And the replacement of Trinity with Richland, as we already wrote, was only a cosmetic update. Not at all like switching from Ivy Bridge to Haswell.
Of course, the «building of integrated muscles» in the products of both vendors more and more narrows the potential scope of junior discrete solutions. The new GT 630 is only marginally faster than the old one (memory is the bottleneck) and still lags behind the A8/A10. And the gap from the junior solutions from AMD and Intel has already decreased so much that the purchase of a discrete video adapter of this level has ceased to be a justified undertaking at all — the performance gain does not compensate for the extra costs and other shortcomings of the approach. In general, the only thing that video cards of this segment can claim is the modernization of old computers. And here, in most cases, a more attractive solution will either be buying a faster discrete, or simply replacing the platform.
Well, you can gradually stop paying attention to the modes of minimum settings — all modern solutions already cope with them.
In any case, desktop — surrogate systems still cannot boast of comfortable results even with the simplification of graphics to the level of a decade ago.
OpenCL
Despite the active talk about heterogeneous computing, their scope remains very limited. Especially if we talk about those areas that are applicable to integrated graphics — the use of discrete GPUs for some «heavy» calculations in the HPC field began several years ago, but this has little relevance to the mass market. And the main problem for the latter was, it seems to us, that OpenCL is not at all as “open” as it was declared. In fact, programmers are forced to take into account the peculiarities of the implementation of specifications by all three vendors, i.e. work at too low a level. WinZip turned out to be a typical example of the immaturity of the technology at one time — behind the victorious reports about the release of an application of at least some general purpose with OpenCL support, not everyone noticed that we were talking about support only for the AMD implementation, but not for Intel and NVIDIA.
Curiously, these features are still showing up even in synthetic benchmarks, many of which simply execute different code branches on different solutions. In particular, such is the Basemark CL, which we started using some time ago as part of the tests of this line. What this leads to in practice is clearly seen in our study of the programs themselves: this utility is clearly not indifferent to AMD GPUs. And if you also remember that not so long ago, Intel processors executed OCL code only on the main cores, but without using the GPU, it becomes clear why this particular program became AMD’s favorite benchmark, the use of which was recommended to all testers. Recently, however, they stopped recommending it. Let’s try to understand why, considering, of course, that Basemark CL for cross-platform comparison must be used very carefully.
In the diagram, we have collected the results of all the processors tested in this program, which painted an extremely interesting picture.
First, as we can see, the HDG 2500 or the “numberless” relative of this GPU provide performance only at the level of junior mobile solutions. It is clear why — the code is well parallelized, so six pipelines are six pipelines, at least in the CULV Celeron, at least in the desktop Core i3. But the Pentium on Haswell is already much faster. However, it is still not possible to consider it as a serious OpenCL accelerator: up to A6, it still does not reach processors with HDG 4000 (again, it doesn’t matter: mobile or desktop). But certain preferences when using OpenCL can also be obtained with its help — at least more than the buyer of any processors based on the AMD Kabini core will receive. But the HDG 4400 is a much more attractive option: as you can see, only the new generation Core i3 turned out to be equal to the top-end Core i7 of the previous one! And compared to competing products, this is not so bad — the level of some A8. It is clear that they are cheaper, but the difference in price with the younger Core i3 is still much less than with the older Core i7 🙂 And the HDG 4600 is already the A10 level.
Moreover, it is easy to see that all economical buyers, and not only those who choose AMD products, can get big benefits from the implementation of OpenCL: the difference between i3 and i7 is less than 10%. In general, the victorious reports only spoil the results of Kaveri — AMD managed to jump above its head once again. But there are not enough of these APUs yet, unlike the Core i3 lying on every corner. In addition, cheaper and more productive on the classic x86 code, which is extremely important in the current state of affairs with the implementation of OpenCL (a processor that is faster in a large number of programs and slower in a small number of programs looks more attractive than one that wins only in an exotic selected environment).
You don’t have to comment on the results of GT 630 — as it has been noted more than once, this benchmark of NVIDIA’s solution does not like it (moreover, OpenCL 1.1 code is used in this case, not 1.2). On the other hand, no one is immune from the repetition of such a situation in real programs.
Well, in this case, as we can see, the lower discrete can easily lag behind even inexpensive integrated graphics. What is an additional nail in its coffin 🙂
Total
If, when choosing a high-level processor (and even assuming the use of a discrete video card), no one managed to find Haswell’s special advantages over Ivy Bridge, then in the budget segment and when using an integrated graphs, the situation is the opposite: there is no point in buying “old” processors. Perhaps to upgrade the system to Sandy Bridge while maintaining the motherboard, but here it’s better to just buy a video card — cheaper and more efficient. And the new system is exclusively on the LGA1150. In that case, of course, if you choose from Intel solutions — as you can see, the lag behind AMD APUs has greatly decreased, but has not completely disappeared. Thus, if you want to save money and focus primarily on the performance of the graphics core, the FM2/FM2+ platform is still a good choice: the same A8-6600K is cheaper than any Core i3, and the A8-5600K can compete in price with Pentium.
Naturally, in this case, you should not forget that this saving is not at all free — the processor part is very different, which is often very important (at least in this segment), and in the case of a subsequent purchase of a discrete video card, an additional payment for a «good» the integrated GPU will disappear entirely. In addition, the “appetite” of AMD APUs is somewhat higher than typical for dual-core Intel processors. In general, they are not direct competitors, but, we repeat, if the performance of integrated graphics is in the first place, then it is better to still pay attention to AMD developments — the new generation of devices from Intel has reduced the gap in this matter, but far from zero, even if we ignore the price difference.
Well, in a global sense, progress certainly makes us happy. Especially if we talk about the basic level of performance. You can, of course, once again scold Intel for some confusion — after all, this is the fourth graphics core with the faceless name «HD Graphics», but more importantly, its performance has increased by the traditional one and a half times.
This does not make HDG a gaming solution, but the very fact of “raising the bar” is already a good signal for programmers. Yes, even higher order has been added — after all, up to and including Ivy Bridge, the “main” level of Intel graphics in the desktop segment coincided with the “basic” one: the most massive GPU was the HDG 2500. Now, Core i3 is distinguished from Pentium not only by Hyper-Threading support, but also more powerful graphics: at least HDG 4400, and already this video core is better than any Ivy Bridge GPU. Even if not one and a half times already, but this (and higher) level of graphics capabilities is now available to every buyer — there is no need to chase after special processor models. Which, again, allows us to count on its more complete utilization by programmers.
And, of course, such an increase in the graphics capabilities of junior processors is another nail in the coffin of budget discrete video cards. While there is still a performance advantage even in the «$60» segment, it’s already too small to buy a standalone device rather than using a «free» IGP.