|
Intel Xeon E7-4880 v2
2.5 GHz (15 cores) |
7209 |
|
|
Intel Xeon E5-2697 v2
2.7 GHz (12 cores) |
6992 |
|
|
Intel Xeon E5-1680 v2
3.0 GHz (8 cores) |
6914 |
|
|
Intel Xeon E7-8895 v2
2.8 GHz (15 cores) |
6381 |
|
|
Intel Xeon E5-2687W v2
3.4 GHz (8 cores) |
6114 |
|
|
Intel Xeon E5-1650 v2
3.5 GHz (6 cores) |
4786 |
|
|
Intel Core i7-3770K
3.5 GHz (4 cores) |
3338 |
|
|
Intel Xeon E3-1290 v2
3.7 GHz (4 cores) |
3207 |
|
|
Intel Xeon E3-1280 V2
3.6 GHz (4 cores) |
3122 |
|
|
Intel Xeon E5-1620 v2
3. |
3116 |
|
|
Intel Xeon E3-1270 V2
3.5 GHz (4 cores) |
3092 |
|
|
Intel Core i7-3770
3.4 GHz (4 cores) |
3070 |
|
|
Intel Xeon E3-1245 V2
3.4 GHz (4 cores) |
3030 |
|
|
Intel Xeon E3-1240 v2
3.4 GHz (4 cores) |
3009 |
|
|
Intel Core i7-3940XM
3.0 GHz (4 cores) |
2987 |
|
|
Intel Xeon E3-1275 v2
3.5 GHz (4 cores) |
2970 |
|
|
Intel Xeon E3-1230V2
3.3 GHz (4 cores) |
2944 |
|
|
Intel Core i7-3840QM
2.8 GHz (4 cores) |
2907 |
|
|
Intel Core i7-3770S
3.1 GHz (4 cores) |
2890 |
|
|
Intel Core i5-3570K
3.4 GHz (4 cores) |
2808 |
|
|
Intel Core i7-3820QM
2. |
2709 |
|
|
Intel Core i7-3720QM
2.6 GHz (4 cores) |
2678 |
|
|
Intel Core i7-3610QE
2.3 GHz (4 cores) |
2620 |
|
|
Intel Core i7-3740QM
2.7 GHz (4 cores) |
2605 |
|
|
Intel Core i7-3770T
2.5 GHz (4 cores) |
2596 |
|
|
Intel Core i7-3615QM
2.3 GHz (4 cores) |
2555 |
|
|
Intel Core i5-3570
3.4 GHz (4 cores) |
2529 |
|
|
Intel Core i5-3550
3.3 GHz (4 cores) |
2525 |
|
|
Intel Core i7-3630QM
2.4 GHz (4 cores) |
2494 |
|
|
Intel Core i7-3610QM
2.3 GHz (4 cores) |
2465 |
|
|
Intel Xeon E3-1225 V2
3.2 GHz (4 cores) |
2450 |
|
|
Intel Core i7-3635QM
2. |
2440 |
|
|
Intel Core i5-3470
3.2 GHz (4 cores) |
2414 |
|
|
Intel Core i5-3570S
3.1 GHz (4 cores) |
2407 |
|
|
Intel Core i5-3550S
3.0 GHz (4 cores) |
2383 |
|
|
Intel Core i5-3450
3.1 GHz (4 cores) |
2349 |
|
|
Intel Xeon E3-1220 v2
3.1 GHz (4 cores) |
2344 |
|
|
Intel Core i7-3632QM
2.2 GHz (4 cores) |
2321 |
|
|
Intel Core i5-3475S
2.9 GHz (4 cores) |
2318 |
|
|
Intel Xeon E3-1265L v2
2.5 GHz (4 cores) |
2307 |
|
|
Intel Core i7-3612QM
2.1 GHz (4 cores) |
2304 |
|
|
Intel Core i5-3470S
2.9 GHz (4 cores) |
2267 |
|
|
Intel Core i5-3350P
3. |
2253 |
|
|
Intel Core i5-3340
3.1 GHz (4 cores) |
2229 |
|
|
Intel Core i5-3450S
2.8 GHz (4 cores) |
2216 |
|
|
Intel Core i5-3570T
2.3 GHz (4 cores) |
2166 |
|
|
Intel Core i5-3330
3.0 GHz (4 cores) |
2163 |
|
|
Intel Core i5-3335S
2.7 GHz (4 cores) |
2121 |
|
|
Intel Core i5-3340S
2.8 GHz (4 cores) |
2068 |
|
|
Intel Core i5-3330S
2.7 GHz (4 cores) |
2061 |
|
|
Intel Xeon E5-2609 v2
2.5 GHz (4 cores) |
1537 |
|
|
Intel Core i7-3520M
2.9 GHz (2 cores) |
1438 |
|
|
Intel Core i5-3380M
2.9 GHz (2 cores) |
1436 |
|
|
Intel Core i7-3540M
3. |
1422 |
|
|
Intel Core i3-3250
3.5 GHz (2 cores) |
1409 |
|
|
Intel Core i5-3470T
2.9 GHz (2 cores) |
1396 |
|
|
Intel Core i3-3225
3.3 GHz (2 cores) |
1387 |
|
|
Intel Core i5-3360M
2.8 GHz (2 cores) |
1374 |
|
|
Intel Core i3-3240
3.4 GHz (2 cores) |
1368 |
|
|
Intel Xeon E3-1220L v2
2.3 GHz (2 cores) |
1341 |
|
|
Intel Core i3-3245
3.4 GHz (2 cores) |
1339 |
|
|
Intel Core i3-3220
3.3 GHz (2 cores) |
1330 |
|
|
Intel Core i5-3320M
2.6 GHz (2 cores) |
1304 |
|
|
Intel Core i5-3340M
2.7 GHz (2 cores) |
1300 |
|
|
Intel Core i3-3210
3. |
1294 |
|
|
Intel Core i7-3517UE
1.7 GHz (2 cores) |
1275 |
|
|
Intel Core i5-3230M
2.6 GHz (2 cores) |
1261 |
|
|
Intel Core i5-3210M
2.5 GHz (2 cores) |
1237 |
|
|
Intel Core i7-3667U
2.0 GHz (2 cores) |
1230 |
|
|
Intel Core i7-3537U
2.0 GHz (2 cores) |
1225 |
|
|
Intel Core i3-3220T
2.8 GHz (2 cores) |
1186 |
|
|
Intel Pentium G2140
3.3 GHz (2 cores) |
1173 |
|
|
Intel Core i3-3240T
2.9 GHz (2 cores) |
1159 |
|
|
Intel Core i7-3687U
2.1 GHz (2 cores) |
1141 |
|
|
Intel Core i7-3517U
1.9 GHz (2 cores) |
1115 |
|
|
Intel Core i3-3130M
2. |
1105 |
|
|
Intel Pentium G2130
3.2 GHz (2 cores) |
1093 |
|
|
Intel Core i5-3427U
1.8 GHz (2 cores) |
1082 |
|
|
Intel Core i5-3437U
1.9 GHz (2 cores) |
1072 |
|
|
Intel Core i5-3337U
1.8 GHz (2 cores) |
1057 |
|
|
Intel Pentium G2120
3.1 GHz (2 cores) |
1051 |
|
|
Intel Core i3-3120M
2.5 GHz (2 cores) |
1032 |
|
|
Intel Core i5-3317U
1.7 GHz (2 cores) |
1016 |
|
|
Intel Pentium G2030
3.0 GHz (2 cores) |
1004 |
|
|
Intel Core i3-3110M
2.4 GHz (2 cores) |
972 |
|
|
Intel Pentium G2020
2.9 GHz (2 cores) |
969 |
|
|
Intel Pentium G2010
2. |
958 |
|
|
Intel Celeron G1630
2.8 GHz (2 cores) |
937 |
|
|
Intel Celeron G1620
2.7 GHz (2 cores) |
914 |
|
|
Intel Celeron G1610
2.6 GHz (2 cores) |
883 |
|
|
Intel Pentium G2030T
2.6 GHz (2 cores) |
880 |
|
|
Intel Pentium 2030M
2.5 GHz (2 cores) |
876 |
|
|
Intel Pentium G2020T
2.5 GHz (2 cores) |
835 |
|
|
Intel Pentium 2020M
2.4 GHz (2 cores) |
814 |
|
|
Intel Core i5-3339Y
1.5 GHz (2 cores) |
807 |
|
|
Intel Core i3-3227U
1.9 GHz (2 cores) |
776 |
|
|
Intel Core i3-3217U
1.8 GHz (2 cores) |
756 |
|
|
Intel Pentium 2127U
1. |
668 |
|
|
Intel Celeron G1610T
2.3 GHz (2 cores) |
668 |
|
|
Intel Celeron 1005M
1.9 GHz (2 cores) |
655 |
|
|
Intel Celeron 1037U
1.8 GHz (2 cores) |
637 |
|
|
Intel Celeron 1000M
1.8 GHz (2 cores) |
632 |
|
|
Intel Pentium 2117U
1.8 GHz (2 cores) |
623 |
|
|
Intel Celeron 1017U
1.6 GHz (2 cores) |
561 |
|
|
Intel Core i3-3229Y
1.4 GHz (2 cores) |
546 |
|
|
Intel Celeron 1007U
1.5 GHz (2 cores) |
534 |
|
|
Intel Pentium 2129Y
1.1 GHz (2 cores) |
402 |
|
|
Intel Celeron 1019Y
1.0 GHz (2 cores) |
304 |
|
 7 GHz (4 cores)
 4 GHz (4 cores)
 1 GHz (4 cores)
 0 GHz (2 cores)
 2 GHz (2 cores)
 6 GHz (2 cores)
 8 GHz (2 cores)
 9 GHz (2 cores)
Celeron 1017U [in 16 benchmarks]
Intel
Celeron 1017U
Buy
- Interface
- Core clock speed
- Max video memory
- Memory type
- Memory clock speed
- Maximum resolution
Summary
Intel started Intel Celeron 1017U sales 1 July 2013. This is Ivy Bridge architecture notebook processor primarily aimed at office systems. It has 2 cores and 2 threads, and is based on 22 nm manufacturing technology, with a maximum frequency of 1600 MHz and a locked multiplier.
Compatibility-wise, this is FCBGA1023 processor with a TDP of 17 Watt. It supports DDR3 memory.
It provides poor benchmark performance at
1.50%
of a leader’s which is AMD EPYC 7h22.
Celeron
1017U
vs
EPYC
7h22
General info
Celeron 1017U processor market type (desktop or notebook), architecture, sales start time and pricing.
| Place in performance rating | 2167 | |
| Market segment | Laptop | |
| Series | Intel Celeron | |
| Architecture codename | Ivy Bridge (2012−2013) | |
| Release date | 1 July 2013 (9 years ago) | |
| Current price | $299 | of 25332 (Xeon Platinum 8276L) |
Technical specs
Basic microprocessor parameters such as number of cores, number of threads, base frequency and turbo boost clock, lithography, cache size and multiplier lock state. These parameters can generally indicate CPU performance, but to be more precise you have to review its test results.
| Physical cores | 2 (Dual-core) | |
| Threads | 2 | |
| Base clock speed | 1.6 GHz | of 4.7 (Ryzen 9 7900X) |
| Boost clock speed | 1.6 GHz | of 5.8 (Core i9-13900KF) |
| L1 cache | 128 KB | of 1536 (EPYC Embedded 3401) |
| L2 cache | 512 KB | of 12288 (Core 2 Quad Q9550) |
| L3 cache | 2 MB | of 32 (Ryzen Threadripper 1998) |
| Chip lithography | 22 nm | of 5 (Ryzen 9 7950X) |
| Die size | 94 mm2 | |
| Maximum core temperature | 105 °C | of 110 (Atom x7-E3950) |
| 64 bit support | + | |
| Windows 11 compatibility | — | |
| Unlocked multiplier | — |
Compatibility
Information on Celeron 1017U compatibility with other computer components and devices: motherboard (look for socket type), power supply unit (look for power consumption) etc. Useful when planning a future computer configuration or upgrading an existing one.
Note that power consumption of some processors can well exceed their nominal TDP, even without overclocking. Some can even double their declared thermals given that the motherboard allows to tune the CPU power parameters.
| Number of CPUs in a configuration | 1 | of 8 (Xeon Platinum 8160M) |
| Socket | FCBGA1023 | |
| Thermal design power (TDP) | 17 Watt | of 400 (Xeon Platinum 9282) |
Technologies and extensions
Technological capabilities and additional instructions supported by Celeron 1017U. You’ll probably need this information if you require some particular technology.
| Instruction set extensions | Intel® SSE4.1, Intel® SSE4.2 | |
| AES-NI | — | |
| Enhanced SpeedStep (EIST) | + | |
| My WiFi | — | |
| Turbo Boost Technology | — | |
| Hyper-Threading Technology | — | |
| Idle States | + | |
| Thermal Monitoring | + | |
| Flex Memory Access | + | |
| Demand Based Switching | — | |
| FDI | + | |
| Fast Memory Access | + |
Security technologies
Processor technologies aimed at improving security, for example, by protecting against hacks.
| TXT | — | |
| EDB | + | |
| Anti-Theft | — |
virtualization technologies
Supported virtual machine optimization technologies. Some are specific to Intel only, some to AMD.
| VT-d | — | |
| VT-x | + | |
| EPT | + |
Memory specs
Types, maximum amount and channel number of RAM supported by Celeron 1017U’s memory controller. Depending on the motherboard, higher memory frequency may be supported.
| Supported memory types | DDR3 | of 5200 (Ryzen 9 7950X) |
| Maximum memory size | 32 GB | of 786 (Xeon E5-2670 v3) |
| Max memory channels | 2 | of 12 (Xeon Platinum 9221) |
| Maximum memory bandwidth | 25. 6 GB/s 6 GB/s |
of 281.6 (Xeon Platinum 9221) |
| ECC memory support | — |
Graphics specifications
General parameters of GPU integrated into Celeron 1017U.
| Integrated graphics card | Intel® HD Graphics for 3rd Generation Intel® Processors | |
| Quick Sync Video | — | |
| Clear Video | — | |
| Clear Video HD | — | |
| Graphics max frequency | 1 GHz | |
| InTru 3D | — |
Graphics interfaces
Available interfaces and connections of Celeron 1017U’s integrated GPU.
| Number of displays supported | 3 | |
| eDP | + | |
| DisplayPort | + | |
| HDMI | + | |
| SDVO | + | |
| CRT | + |
Peripherals
Specifications and connection types of supported peripherals.
| PCIe version | 2.0 | of 5 (Ryzen 9 7950X) |
| PCI Express lanes | 16 | of 128 (EPYC 7401) |
Benchmark performance
Single-core and multi-core benchmark results of Celeron 1017U. Overall benchmark performance is measured in points in 0-100 range, higher is better.
Overall score
This is our combined benchmark performance rating. We are regularly improving our combining algorithms, but if you find some perceived inconsistencies, feel free to speak up in comments section, we usually fix problems quickly.
Celeron 1017U
1.50
- Passmark
- GeekBench 5 Single-Core
- GeekBench 5 Multi-Core
- Cinebench 10 32-bit single-core
- Cinebench 10 32-bit multi-core
- 3DMark06 CPU
- Cinebench 11.
 5 64-bit multi-core
 - Cinebench 11.5 64-bit single-core
- TrueCrypt AES
- WinRAR 4.0
- x264 encoding pass 2
- x264 encoding pass 1
- Geekbench 3 32-bit multi-core
- Geekbench 3 32-bit single-core
- Geekbench 2
Passmark
Passmark CPU Mark is a widespread benchmark, consisting of 8 different types of workload, including integer and floating point math, extended instructions, compression, encryption and physics calculation. There is also one separate single-threaded scenario measuring single-core performance.
Benchmark coverage: 69%
Celeron 1017U
1508
GeekBench 5 Single-Core
GeekBench 5 Single-Core is a cross-platform application developed in the form of CPU tests that independently recreate certain real-world tasks with which to accurately measure performance. This version uses only a single CPU core.
Benchmark coverage: 38%
Celeron 1017U
298
GeekBench 5 Multi-Core
GeekBench 5 Multi-Core is a cross-platform application developed in the form of CPU tests that independently recreate certain real-world tasks with which to accurately measure performance. This version uses all available CPU cores.
Benchmark coverage: 38%
Celeron 1017U
561
Cinebench 10 32-bit single-core
Cinebench R10 is an ancient ray tracing benchmark for processors by Maxon, authors of Cinema 4D. Its single core version uses just one CPU thread to render a futuristic looking motorcycle.
Benchmark coverage: 20%
Celeron 1017U
2201
Cinebench 10 32-bit multi-core
Cinebench Release 10 Multi Core is a variant of Cinebench R10 using all the processor threads. Possible number of threads is limited by 16 in this version.
Benchmark coverage: 20%
Celeron 1017U
4155
3DMark06 CPU
3DMark06 is a discontinued DirectX 9 benchmark suite from Futuremark. Its CPU part contains two scenarios, one dedicated to artificial intelligence pathfinding, another to game physics using PhysX package.
Benchmark coverage: 19%
Celeron 1017U
1719
Cinebench 11.5 64-bit multi-core
Cinebench Release 11.5 Multi Core is a variant of Cinebench R11.5 which uses all the processor threads. A maximum of 64 threads is supported in this version.
Benchmark coverage: 17%
Celeron 1017U
1
Cinebench 11.5 64-bit single-core
Cinebench R11.5 is an old benchmark by Maxon, authors of Cinema 4D. It was superseded by later versions of Cinebench, which use more modern variants of Cinema 4D engine. The Single Core version loads a single thread with ray tracing to render a glossy room full of crystal spheres and light sources.
Benchmark coverage: 14%
Celeron 1017U
0.6
TrueCrypt AES
TrueCrypt is a discontinued piece of software that was widely used for on-the-fly-encryption of disk partitions, now superseded by VeraCrypt. It contains several embedded performance tests, one of them being TrueCrypt AES, which measures data encryption speed using AES algorithm. Result is encryption speed in gigabytes per second.
Benchmark coverage: 13%
Celeron 1017U
0
WinRAR 4.0
WinRAR 4.0 is an outdated version of a popular file archiver. It contains an internal speed test, using ‘Best’ setting of RAR compression on large chunks of randomly generated data. Its results are measured in kilobytes per second.
Benchmark coverage: 13%
Celeron 1017U
1150
x264 encoding pass 2
x264 Pass 2 is a slower variant of x264 video compression that produces a variable bit rate output file, which results in better quality since the higher bit rate is used when it is needed more. Benchmark result is still measured in frames per second.
Benchmark coverage: 13%
Celeron 1017U
8
x264 encoding pass 1
x264 version 4.0 is a video encoding benchmark uses MPEG 4 x264 compression method to compress a sample HD (720p) video. Pass 1 is a faster variant that produces a constant bit rate output file. Its result is measured in frames per second, which means how many frames of the source video file were encoded per second.
Benchmark coverage: 13%
Celeron 1017U
42
Geekbench 3 32-bit multi-core
Benchmark coverage: 6%
Celeron 1017U
2308
Geekbench 3 32-bit single-core
Benchmark coverage: 6%
Celeron 1017U
1367
Geekbench 2
Benchmark coverage: 5%
Celeron 1017U
2892
Relative perfomance
Overall Celeron 1017U performance compared to nearest competitors among notebook CPUs./data/Celeron-800.jpg)
Intel Pentium 4405Y
100.67
AMD A9-9420
100
Intel Core i7-640LM
100
Intel Celeron 1017U
100
Intel Celeron 2970M
99.33
AMD A4-6210
98.67
Intel Celeron 3955U
98.67
AMD equivalent
We believe that the nearest equivalent to Celeron 1017U by AMD is A9-9420, which is nearly equal in speed and higher by 4 positions in our rating.
A9
9420
Compare
Here are some closest AMD rivals to Celeron 1017U:
AMD A8 Pro-7150B
103. 33
33
AMD A9-9410
101.33
AMD A9-9420
100
Intel Celeron 1017U
100
AMD A4-6210
98.67
AMD A6-8500P
97.33
AMD A6-3430MX
96
Similar processors
Here is our recommendation of several processors that are more or less close in performance to the one reviewed.
A9
9420
Compare
A9
9410
Compare
Celeron
3955U
Compare
A8 Pro
7150B
Compare
A8
3530MX
Compare
Core i3
4020Y
Compare
Best GPUs for Celeron 1017U
These graphics cards are most commonly used with Celeron 1017U according to our statistics, based on user self-reported PC configurations.
UHD
Graphics
22.8%
HD
Graphics
15.2%
HD
Graphics 4000
9.7%
HD
Graphics 520
7.6%
HD
Graphics 2500
6.2%
HD
Graphics 620
4.8%
HD
Graphics (Ivy Bridge)
4.1%
HD
Graphics 3000
3. 4%
4%
UHD
Graphics 630
2.8%
HD
Graphics 500
2.1%
These are the fastest GPUs paired with Celeron 1017U in our user configurations.
There is a total of 145 configurations based on Celeron 1017U in our database.
GeForce RTX
3060
0.7% (1/145)
GeForce GTX
1060 6 GB
1.4% (2/145)
GeForce GTX
1060 3 GB
0.7% (1/145)
Radeon RX
580
0. 7% (1/145)
GeForce GTX
660
0.7% (1/145)
GeForce GT
1030
0.7% (1/145)
Radeon RX
Vega 8
2.1% (3/145)
UHD
Graphics 750
0.7% (1/145)
GeForce
MX110
0.7% (1/145)
HD
Graphics 630
0.7% (1/145)
User rating
Here is the rating given to the reviewed processor by our users. Let others know your opinion by rating it yourself.
Questions and comments
Here you can ask a question about Celeron 1017U, agree or disagree with our judgements, or report an error or mismatch.
Please enable JavaScript to view the comments powered by Disqus.
Celeron 1017U processor [in 16 benchmarks]
Intel
Celeron 1017U
- Interface
- Core frequency
- Video memory size
- Memory type
- Memory frequency
- Maximum resolution
Description
Intel started Intel Celeron 1017U sales 1 July 2013. This is Ivy Bridge architecture notebook processor primarily aimed at office systems. It has 2 cores and 2 threads and is manufactured using 22nm process technology, the maximum frequency is 1600MHz, the multiplier is locked. nine0005
In terms of compatibility, this is a processor for the FCBGA1023 socket with a TDP of 17W. It supports DDR3 memory.
It provides poor benchmark performance at
1. 50%
50%
from the leader, which is AMD EPYC 7h22.
Celeron
1017U
vs
EPYC
nine0040 7h22
General information
Information about the type (desktop or laptop) and architecture of Celeron 1017U, as well as sales start time and cost at that time.
| place in performance rating | 2167 | |
| 0060 |
Compatible
Information on Celeron 1017U compatibility with other computer components. Useful, for example, when choosing the configuration of a future computer or to upgrade an existing one.
Please note that the power consumption of some processors can significantly exceed their nominal TDP even without overclocking. Some may even double their claims if the motherboard allows you to adjust the power settings of the processor. nine0060
Security Technology
9000 9000 9
Technologies embedded in the Celeron 1017U that enhance system security, such as tamper resistance.
| TXT | — | |
| EDB | + | |
| Anti-Theft | — |
Virtualization technologies 9002 9002
Technologies supported by Celeron 1017U that speed up virtual machines are listed.
| VT-D | — | |
| VT-X | + | EPT 9005 +0041 |
RAM support
Types, maximum size and channels of RAM supported by Celeron 1017U. Higher memory frequency may be supported depending on the motherboard. Ryzen 9 7950X0040 32 GB
2
WE0060
90AM
Interfaces and connections supported by Celeron 1017U integrated video card.
| Maximum number of monitors | 3 | |
| eDP | + | |
| DisplayPort | + | |
| HDMI | + | |
| SDVO | + | |
| CRT | + |
Peripherals
Celeron 1017U supported peripherals and how to connect them. nine0005
Overall performance in tests
This is our overall performance rating. We regularly improve our algorithms, but if you find any inconsistencies, feel free to speak up in the comments section, we usually fix problems quickly.
Celeron 1017U
1.50
- Passmark
- GeekBench 5 Single-Core
- GeekBench 5 Multi-Core
- Cinebench 10 32-bit single-core
- Cinebench 10 32-bit multi-core
- 3DMark06 CPU
- Cinebench 11.
 5 64-bit multi-core
 - Cinebench 11.5 64-bit single-core
- TrueCrypt AES
- WinRAR 4.0
- x264 encoding pass 2
- x264 encoding pass 1
- Geekbench 3 32-bit multi-core
- Geekbench 3 32-bit single-core
- Geekbench 2
Passmark
Passmark CPU Mark is a widely used benchmark that consists of 8 different tests, including integer and floating point calculations, extended instruction tests, compression, encryption, and game physics calculations. Also includes a separate single-threaded test. nine0005
Benchmark coverage: 69%
Celeron 1017U
1508
GeekBench 5 Single-Core
GeekBench 5 Single-Core is a cross-platform application designed as CPU benchmarks that independently recreate certain real world tasks that can accurately measure performance. This version uses only one processor core.
Benchmark coverage: 38%
nine0003 Celeron 1017U
298
GeekBench 5 Multi-Core
GeekBench 5 Multi-Core is a cross-platform application designed as CPU benchmarks that independently recreate certain real world tasks that can accurately measure performance.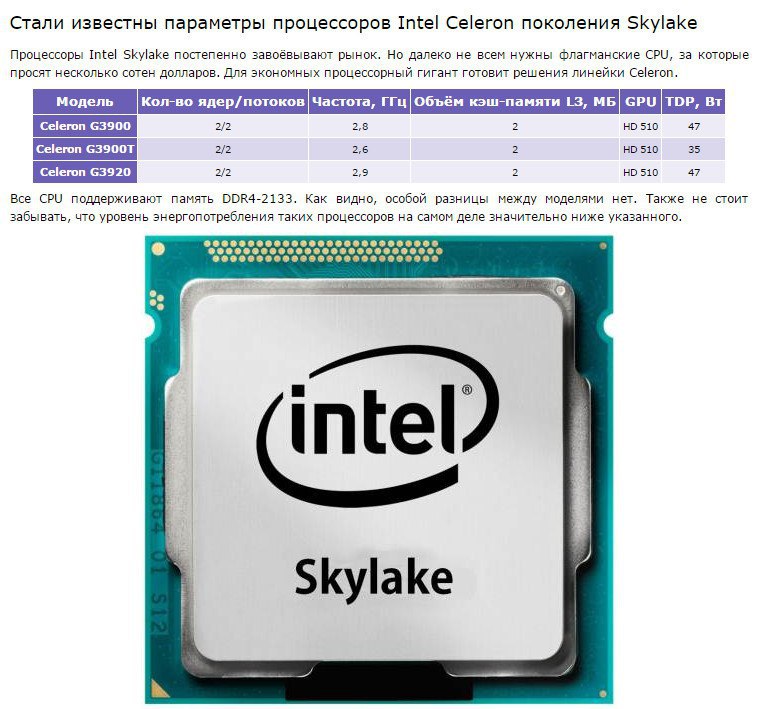 This version uses all available processor cores.
Benchmark coverage: 38%
Celeron 1017U
561
nine0005
Cinebench 10 32-bit single-core
Cinebench R10 is a very outdated ray tracing benchmark for processors developed by the authors of Cinema 4D, Maxon. The Single-Core version uses a single CPU thread to render a futuristic motorcycle model.
Benchmark coverage: 20%
Celeron 1017U
2201
Cinebench 10 32-bit multi-core
Cinebench Release 10 Multi Core is a variant of Cinebench R10 that uses all processor threads. The possible number of threads in this version is limited to 16.
Benchmark coverage: 20%
Celeron 1017U
4155
3DMark06 CPU
3DMark06 is an outdated set of benchmarks based on DirectX 9 by Futuremark. Its processor part contains two tests, one of which calculates the pathfinding of game AI, the other emulates game physics using the PhysX package.
Benchmark coverage: 19%
Celeron 1017U
nine0040 1719
Cinebench 11.5 64-bit multi-core
Cinebench Release 11.5 Multi Core is a variant of Cinebench R11.5 that uses all processor threads. This version supports a maximum of 64 threads.
Benchmark coverage: 17%
Celeron 1017U
1
Cinebench 11.5 64-bit single-core
Cinebench R11.5 is an old Maxon development benchmark. authors of Cinema 4D. It has been superseded by later versions of Cinebench, which use more modern variants of the Cinema 4D engine. The Single Core version loads one CPU thread with ray tracing, rendering a glossy room full of crystal spheres and lights. nine0005
Benchmark coverage: 14%
Celeron 1017U
0.6
TrueCrypt AES
TrueCrypt is a deprecated program that was widely used to encrypt disk partitions on the fly. It contains several built-in benchmarks, one of which is TrueCrypt AES. It measures the speed of data encryption using the AES algorithm. The result of the test is the encryption speed in gigabytes per second. nine0005
Benchmark coverage: 13%
Celeron 1017U
0
WinRAR 4.0
WinRAR 4.0 is an outdated version of the popular archiver. It contains an internal speed test using maximum compression by the RAR algorithm on large amounts of randomly generated data. Results are measured in kilobytes per second.
Benchmark coverage: 13%
Celeron 1017U
nine0040 1150
x264 encoding pass 2
x264 Pass 2 is a slower MPEG4 x264 video compression benchmark, resulting in a variable bit rate output file. This results in a better quality of the resulting video file, as a higher bit rate is used when it is needed more. The benchmark result is still measured in frames per second.
Benchmark coverage: 13%
nine0003 Celeron 1017U
8
x264 encoding pass 1
The x264 benchmark uses the MPEG 4 x264 compression method to encode the sample video in HD (720p). Pass 1 is a faster option that produces an output file at a constant bit rate. Its result is measured in frames per second, that is, how many frames of the source video file were encoded in one second on average.
Benchmark coverage: 13%
nine0003 Celeron 1017U
42
Geekbench 3 32-bit multi-core
Benchmark coverage: 6%
Celeron 1017U
2308
Geekbench 3 32-bit single-core
Benchmark coverage: 6%
Celeron 1017U
1367
Geekbench 2
Benchmark coverage: 5%
Celeron 1017U
2892
Relative capacity
Celeron 1017U overall performance compared to its nearest competitor in notebook processors.
Intel Pentium 4405Y
100.67
AMD A9-9420
100
Intel Core i7-640LM
100
nine0003 Intel Celeron 1017U
100
Intel Celeron 2970M
99. 33
33
AMD A4-6210
98.67
Intel Celeron 3955U
98.67
Competitor from AMD
We believe that the nearest equivalent to Celeron 1017U from AMD is A9-9420, which is approximately equal in speed and lower by 4 positions in our rating. nine0005
A9
9420
Compare
Here are some of AMD’s Celeron 1017U closest competitors:
AMD A8 Pro-7150B
103.33
AMD A9-9410
101.33
AMD A9-9420
100
nine0003 Intel Celeron 1017U
100
AMD A4-6210
98.67
AMD A6-8500P
97.33
AMD A6-3430MX
96
Other processors
Here we recommend several processors that are more or less similar in performance to the reviewed one.
A9
9420
Compare
A9
9410
Compare
Celeron
3955U
Compare
A4
6210
Compare
A8 Pro
nine0040 7150B
Compare
A8
3530MX
Compare
Recommended graphics cards
According to our statistics, these graphics cards are most often used with Celeron 1017U:
UHD
Graphics
22. 8%
8%
HD
Graphics
15.2%
HD
Graphics 4000
9.7%
HD
Graphics 520
7.6%
HD
Graphics 2500
6.2%
HD
Graphics 620
nine0004
4.8%
HD
Graphics (Ivy Bridge)
4.1%
HD
Graphics 3000
3.4%
UHD
Graphics 630
2.8%
HD
Graphics 500
nine0004
2.1%
Here are 145 configurations based on Celeron 1017U in our database.
GeForce RTX
3060
0.7% (1/145)
GeForce GTX
1060 6GB
1.4% (2/145)
GeForce GTX
1060 3GB
nine0002 0.7% (1/145)
Radeon RX
580
0.7% (1/145)
GeForce GTX
660
0.7% (1/145)
GeForce GT
1030
0.7% (1/145)
Radeon RX
Vega 8
nine0004
2.1% (3/145)
UHD
Graphics 750
0.7% (1/145)
GeForce
MX110
0.