What are The Key Differences?
AMD was expected to launch new CPUs in response to the 10th generation Intel ‘Comet Lake‘ lineup in order to keep the performance crown and that’s exactly what they did. Introducing the Matisse Zen 2 refresh processors, the Ryzen 5 3600XT, Ryzen 7 3800XT and Ryzen 9 3900XT are 6, 8 and 12 core alternatives to the outgoing Zen 2 Ryzen 5 3600X, Ryzen 7 3800X and Ryzen 9 3900X CPUs respectively. For this article, we will be focusing on the mighty 12 core / 24 threads Ryzen 9 3900XT but you can see spec reviews on the other two as well; go ahead and check our guides for those, too!
We have formulated a spec comparison sheet in order to be easier to understand what you’ll be getting with this Ryzen refresh. Even if the hardware is similar, in fact, its almost identical, AMD has made a few tweaks to these processors in order to extract even more performance out of them. The improvements are much due to TSMC’s optimizations of the manufacturing process; as it matures, the 7nm dies that all Ryzen processors are using become better and better performance-wise and yield wise. A refresh is what this really is; AMD claims a 4% increase in single-core performance on average over the existing Zen 2 CPUs coming from the increased boost clock and other architectural tweaks. IPC (instructions per clock) remains the same with this refresh generation but AMD claims 40% better efficiency when compared to the 10th Generation Intel parts which is rather significant and will matter for a lot of people.
1
Ryzen 9 3900X vs 3900XT: Specification Comparison
3
Featured Builds
3.1
Related
Ryzen 9 3900X vs 3900XT: Specification Comparison
| Processor | AMD Ryzen 9 3900X | AMD Ryzen 9 3900XT |
|---|---|---|
| Design | ||
| Cores / Threads | 12 / 24 | 12 / 24 |
| Base Clock | 3.8 GHz | 3.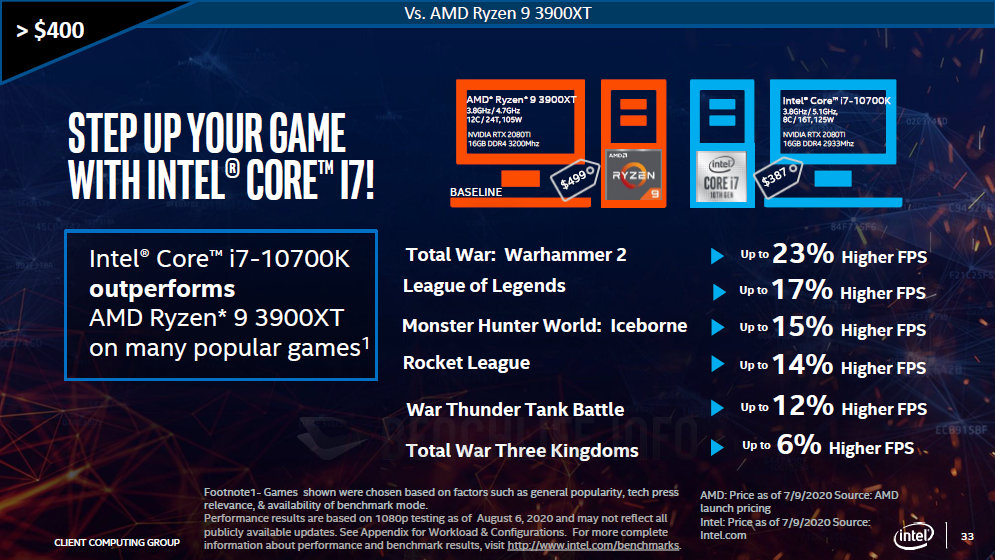 9 GHz 9 GHz |
| Max Boost Clock | 4.6 GHz | 4.7 GHz |
| L3 Cache | 32 MB | 32 MB |
| TDP | 105 W | 105 W |
| Architecture | Zen 2 | Zen 2 |
| Process | 7 nm | 7 nm |
| Socket | AM4 | AM4 |
| FP32 Performance | 2,649.6 GFLOPS | 2,707.2 GFLOPS |
| Die Size | 74 mm² | 74 mm² |
| Transistors | 3,800 million | |
| Launch Date | July 7th 2019 | July 7th 2020 |
| Launch Price | 499 | 499 |
| Availability | Amazon | Amazon |
As the Ryzen 4000 processors are getting closer and closer, being expected to launch before the end of the year, AMD also felt the need to launch this XT generation of the optimized Zen 2 architecture in order to combat Intel until Zen 3. Good yields and manufacturing costs are allowing AMD to easily select high performance dies in order to provide CPUs that clock higher at the same power consumption with the Ryzen XT refresh.
The hardware on the new Ryzen 9 3900XT is identical to last year’s Ryzen 9 3900X but the base clock is up to 3.9 GHz from 3.8 GHz and boost clock up to 4.7 GHz from 4.6 GHz. Overall, nothing exciting but AMD promises these new XT CPUs will be able to maintain their boost clocks more consistently than the outgoing Zen 2 generation. This mid-life refresh is also bringing improvements to the Infinity Fabric mesh which AMD is using for communication between cores. This is both an advantage and a nuisance for the Ryzen CPUs; it allows AMD to have a very scalable architecture and build processors with as many cores as they want without having the cost ramp up exponentially due to bad yields but it also introduces some core to core latency that mildly affects performance. The XT refresh will feature the Infinity Fabric speed at an out of the box value of 2,000 MHz which is a 10% increase over the previous max 1,800 MHz. This will definitely help in latency bound applications and we can hardly wait to test how this improvement will translate to gaming performance.
The rest is the same as the Ryzen 9 3900XT still sports 12 cores and 24 threads, the same amount of 64 MB L3 cache, same die size and same TDP / power consumption. TSMC’s 7nm process is maturing better and better and this is why AMD pushed this refresh, because they can release these new CPUs as a decent step up in performance at the same price point as the previous Matisse Zen 2 CPUs. The 3900X was already the highest clocked Ryzen 3000 CPU and the 3900XT brings a 100 MHz leap in clock speed over it, pegging it at 4.7 GHz. Intel needs to find performance improvements elsewhere because with this refresh generation, a 4.7 GHz Ryzen beats the single core performance of a 5.2 GHz Intel Core CPU and Intel is starting to remain without any notable advantages.
We don’t believe Intel will lose the gaming performance crown at the high end because that is likely going to happen with the Ryzen 4000 series but this Ryzen 9 3900XT processor together with the Ryzen 7 3800XT with the updated max boost speeds and Infinity Fabric improvements might take the ball so close in Intel’s court that the difference will be too subtle to notice. AMD is innovating with bleeding edge technology and manufacturing process and this is why they can do high core counts at a reasonable price; they have a highly scalable architecture that responds very well to our current market.
The closest Intel competitor price-wise would be the mighty Intel Core i9 10900K and we see the Ryzen 9 3900XT having better single-core and multi-core performance at the same price point; not a good place to be in for Intel. These CPUs are really here to improve on the previous year’s performance per dollar mark. This refresh really is a scary sight for AMD’s competitor, Intel; it shows how Intel’s 10th gen generation can be closely matched with a minimal effort from AMD’s part and at lower prices.
The upcoming Zen 3 architecture hasn’t been leaked yet but it seems that its enough of a performance jump in order to look good even when compared to this intermediate generation, the Zen 2 refresh. Don’t get us wrong though, the Ryzen 9 3900XT together with the other two are great options today both value and performance wise and if you can’t find a good offer on the outgoing models, getting one of these will still provide you with amazing performance for years to come.
Ryzen 9
3900XT vs 3900X: Benchmarks Comparison
Can this new CPU use its clock speed advantage in order to beat the previous Ryzen CPUs with considerable margins?
We’ve compiled gaming results at 1080p with an RTX 2080 Ti GPU in order to stress the CPU as much as we could. The games that are tested include CoD: Modern Warfare, Jedi: Fallen Order, Counter Strike: Global Offensive, DOOM: Eternal and Red Dead Redemption 2. All CPUs are tested with the same GPU and with the same graphics settings across the board. We’ve specifically looked at both Average FPS and 1% Low FPS numbers in order to better understand how smooth the gaming experience would feel on these processors.
Lets get to it!
Call of Duty: Modern Warfare
| CPU | Resolution | Settings | Average FPS | 1% Low FPS | Percentile Average | Percentile 1% Low |
|---|---|---|---|---|---|---|
| Intel Core i9 10900K | 1080p | Ultra, SMAA T2x | 188. 6 6 |
167.6 | 100% | 100% |
| Intel Core i5 10600K | 1080p | Ultra, SMAA T2x | 182.8 | 146.1 | 96.92% | 87.17% |
| Ryzen 9 3900X | 1080p | Ultra, SMAA T2x | 181.8 | 156.7 | 96.39% | 93.50% |
| Ryzen 5 3600X | 1080p | Ultra, SMAA T2x | 180.7 | 152.7 | 95.81% | 91.11% |
| Ryzen 9 3900XT | 1080p | Ultra, SMAA T2x | 180.6 | 158.2 | 95.76% | 94.39% |
| Ryzen 7 3800X | 1080p | Ultra, SMAA T2x | 180 | 152.9 | 95.44% | 91.23% |
| Ryzen 7 3700X | 1080p | Ultra, SMAA T2x | 179.1 | 152.3 | 94.96% | 90.87% |
Counter Strike: Global Offensive
| CPU | Resolution | Settings | Average FPS | 1% Low FPS | Percentile Average | Percentile 1% Low |
|---|---|---|---|---|---|---|
| Intel Core i9 10900K | 1080p | Highest Details, 8xMSAA | 383.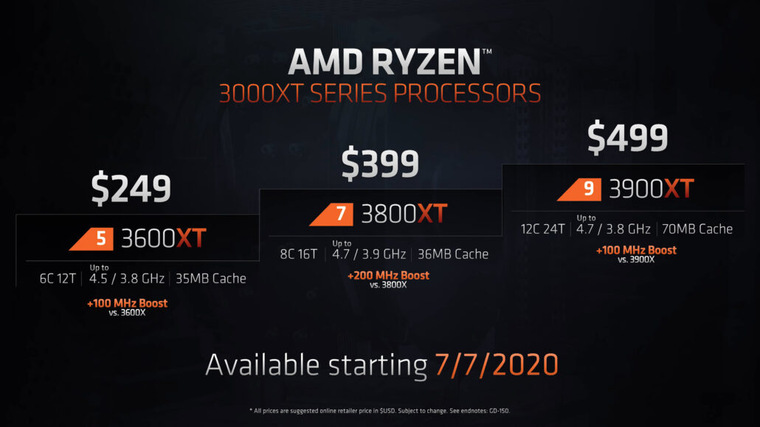 2 2 |
260.7 | 100% | 100% |
| Intel Core i5 10600K | 1080p | Highest Details, 8xMSAA | 380.7 | 242.7 | 99.35% | 93.10% |
| Ryzen 9 3900XT | 1080p | Highest Details, 8xMSAA | 380.1 | 240 | 99.19% | 92.06% |
| Ryzen 9 3900X | 1080p | Highest Details, 8xMSAA | 377.5 | 237.4 | 98.51% | 91.06% |
| Ryzen 5 3600X | 1080p | Highest Details, 8xMSAA | 376.1 | 241.5 | 98.15% | 92.64% |
| Ryzen 7 3800X | 1080p | Highest Details, 8xMSAA | 375.6 | 240.5 | 98.02% | 92.25% |
| Ryzen 7 3700X | 1080p | Highest Details, 8xMSAA | 374.4 | 240.2 | 97.70% | 92.14% |
Red Dead Redemption 2
| CPU | Resolution | Settings | Average FPS | 1% Low FPS | Percentile Average | Percentile 1% Low |
|---|---|---|---|---|---|---|
| Intel Core i9 10900K | 1080p | Vulkan, Ultra, TAA High | 99 | 80. 3 3 |
100% | 100% |
| Intel Core i5 10600K | 1080p | Vulkan, Ultra, TAA High | 97.8 | 79.5 | 98.79% | 99.00% |
| Ryzen 9 3900XT | 1080p | Vulkan, Ultra, TAA High | 94 | 74.9 | 94.95% | 93.28% |
| Ryzen 9 3900X | 1080p | Vulkan, Ultra, TAA High | 93.1 | 72.6 | 94.04% | 90.41% |
| Ryzen 7 3800X | 1080p | Vulkan, Ultra, TAA High | 91.9 | 73.7 | 92.83% | 91.78% |
| Ryzen 7 3700X | 1080p | Vulkan, Ultra, TAA High | 91.4 | 73.2 | 92.32% | 91.16% |
| Ryzen 5 3600X | 1080p | Vulkan, Ultra, TAA High | 91.2 | 72.7 | 92.12% | 90.54% |
Jedi: Fallen Order
| CPU | Resolution | Settings | Average FPS | 1% Low FPS | Percentile Average | Percentile 1% Low |
|---|---|---|---|---|---|---|
| Intel Core i9 10900K | 1080p | Epic Preset | 115 | 74. 7 7 |
100% | 100% |
| Ryzen 9 3900XT | 1080p | Epic Preset | 104.7 | 67.1 | 91.04% | 89.83% |
| Ryzen 9 3900X | 1080p | Epic Preset | 104.2 | 67.6 | 90.61% | 90.50% |
| Ryzen 7 3800X | 1080p | Epic Preset | 103.5 | 67.6 | 90.00% | 90.50% |
| Ryzen 7 3700X | 1080p | Epic Preset | 103.2 | 67 | 89.74% | 89.69% |
| Ryzen 5 3600X | 1080p | Epic Preset | 102.9 | 66.2 | 89.48% | 88.62% |
| Intel Core i5 10600K | 1080p | Epic Preset | 93 | 70.1 | 80.87% | 93.84% |
DOOM: Eternal
| CPU | Resolution | Settings | Average FPS | 1% Low FPS | Percentile Average | Percentile 1% Low |
|---|---|---|---|---|---|---|
| Intel Core i9 10900K | 1080p | Ultra Nightmare, HDR Off | 285. 7 7 |
230.5 | 100% | 100% |
| Ryzen 9 3900XT | 1080p | Ultra Nightmare, HDR Off | 277.5 | 235.7 | 97.13% | 102.26% |
| Intel Core i5 10600K | 1080p | Ultra Nightmare, HDR Off | 276.2 | 208.7 | 96.67% | 90.54% |
| Ryzen 9 3900X | 1080p | Ultra Nightmare, HDR Off | 273.8 | 229.9 | 95.83% | 99.74% |
| Ryzen 5 3600X | 1080p | Ultra Nightmare, HDR Off | 271.2 | 226 | 94.92% | 98.05% |
| Ryzen 7 3800X | 1080p | Ultra Nightmare, HDR Off | 271 | 230.5 | 94.85% | 100.00% |
| Ryzen 7 3700X | 1080p | Ultra Nightmare, HDR Off | 270.7 | 229.2 | 94.75% | 99.44% |
The 3900XT scores very well on gaming when compared to other top gaming CPUs from the likes of both Intel and AMD. Its actually close to the top, trailing only the 10900K in our batch of CPUs tested. The 10900K is 5% faster in average FPS while being 6% faster in 1% Low FPS. Needless to say that its almost impossible to feel this small difference in FPS, especially at 1080p with a RTX 2080Ti graphics card where FPS numbers were above 100 almost all the time.
We can also see that the 3900XT is just 1% better in average FPS than the previous generation Ryzen 9 3900X and 2% better in Low FPS. So not a lot of difference, especially when considering that the 3900X is now retailing at around $420 and comes with an included stock cooler when compared to the $499 Ryzen 9 3900XT.
Average FPS & 1% Low FPS results (higher is better)
| Percentile Avg FPS | Percentile 1% Low FPS | |
|---|---|---|
| Intel Core i9 10900K | 100.00% | 100.00% |
| Ryzen 9 3900XT | 95.61% | 94.36% |
| Ryzen 9 3900X | 95. 08% 08% |
93.04% |
| Ryzen 7 3800XT | 94.70% | 93.68% |
| Intel Core i5 10600K | 94.52% | 92.73% |
| Ryzen 7 3800X | 94.23% | 93.15% |
| Ryzen 5 3600XT | 94.10% | 92.53% |
| Ryzen 5 3600X | 93.96% | 92.19% |
| Ryzen 7 3700X | 93.90% | 92.66% |
We’ve also compared the ‘Cost per frame’ of the 3900XT to the other CPUs tested and there’s no surprise that it scores pretty low here. The 3900XT is not a good value for your system if you only plan to game with your PC but it’s an amazing offer if you’re using your system as both a workstation and gaming machine. If you’re looking for the best overall gaming CPU on the market right now, then your best choices are the Ryzen 5 3600X or the Ryzen 5 3600 which are around 7-8% slower than the $500 10900K but cost almost a third of its price.
It’s very important that besides the price of the CPU, to always take into consideration the cost of the motherboard and CPU cooler. This way, you’ll better understand what best fits for you. For example, both the Ryzen 9 3900XT and the Ryzen 7 3800XT don’t come with a stock cooler and we need to factor in the price of them in order to have a working system and do the cost per frame analysis. Another example is how the 3700X is a more valuable gaming CPU than the gaming-focused i5-10600K because of motherboard + cooler pricing even though the i5-10600K is 2% better on average than the Ryzen 7 3700X.
Overall though, these CPUs can all do gaming very well and you can’t go wrong with either if you closely watch the pricing on each platform.
Cost per frame & value (lower is better)
| Cost per Frame with Motherboard & Cooler | Cost per Frame CPU Only | |
|---|---|---|
| Ryzen 5 3600X | $1.61 | $1.07 |
| Ryzen 5 3600XT | $1.75 | $1.21 |
| Ryzen 7 3700X | $1.91 | $1. 37 37 |
| Intel Core i5 10600K | $2.08 | $1.38 |
| Ryzen 7 3800X | $2.1 | $1.56 |
| Ryzen 9 3900X | $2.85 | $2.03 |
| Ryzen 7 3800XT | $3.05 | $1.94 |
| Ryzen 9 3900XT | $3.8 | $2.4 |
| Intel Core i9 10900K | $3.97 | $2.47 |
Multicore workstation performance (higher is better)
| Cinebench R20 Multicore | Performance Percentile | |
|---|---|---|
| Ryzen 9 3900XT | 7215 | 100.00% |
| Ryzen 9 3900X | 7122 | 98.71% |
| Intel Core i9 10900K | 6160 | 85.38% |
| Ryzen 7 3800XT | 5108 | 70.80% |
| Ryzen 7 3800X | 5075 | 70.34% |
| Ryzen 7 3700X | 4734 | 65.61% |
| Ryzen 5 3600XT | 3778 | 52. 36% 36% |
| Ryzen 5 3600X | 3703 | 51.32% |
| Intel Core i5 10600K | 3598 | 49.87% |
There’s no secret that Ryzen does very well in multi-core performance and the numbers below show that. In well-threaded applications like rendering, 3D modeling and ML software, the Ryzen 9 3900XT CPU is the king thanks to its 12 core and 24 threads. With almost 2% better performance compared to the outgoing Ryzen 9 3900X and 17% better than the Intel’s top consumer CPU, the 10900K, the 3900XT is one of the best multi-core CPUs that you can buy. We’d also take a look at the Ryzen 9 3900X which may be one year old now but still provides leading multicore performance at a more accessible price points thanks to offers and retail price cuts.
View the Ryzen 9 3900XT on Amazon
Related:
- Best B550 Motherboards for Ryzen Matisse Builds
- Best X570 Motherboards for Ryzen Matisse Builds
Featured Builds
AMD Ryzen 9 3900XT vs Ryzen 9 3900X: performance comparison
VS
AMD Ryzen 9 3900XT
AMD Ryzen 9 3900X
We compared two 12-core desktop CPUs: the 3. 8 GHz AMD Ryzen 9 3900XT against the 3.8 GHz Ryzen 9 3900X. On this page, you’ll find out which processor has better performance in benchmarks, games and other useful information.
- Review
- Differences
- Performance
- Specs
- Comments (1)
Review
General overview and comparison of the processors
Single-Core Performance
Performance in single-threaded apps and benchmarks
Ryzen 9 3900XT
61
Ryzen 9 3900X
60
Performance
Measure performance when all cores are involved
Ryzen 9 3900XT
69
Ryzen 9 3900X
69
Power Efficiency
The efficiency score of electricity consumption
Ryzen 9 3900XT
67
Ryzen 9 3900X
62
NanoReview Final Score
Generic CPU rating
Ryzen 9 3900XT
66
Ryzen 9 3900X
65
Key Differences
What are the key differences between 3900X and 3900XT
Advantages of AMD Ryzen 9 3900XT
- Newer — released 1-year later
- 2% higher Turbo Boost frequency (4.
 7 GHz vs 4.6 GHz)
Benchmarks
Comparing the performance of CPUs in benchmarks
Cinebench R23 (Single-Core)
Ryzen 9 3900XT
+3%
1361
Ryzen 9 3900X
1324
Cinebench R23 (Multi-Core)
Ryzen 9 3900XT
18517
Ryzen 9 3900X
+1%
18694
Passmark CPU (Single-Core)
Ryzen 9 3900XT
+2%
2765
Ryzen 9 3900X
2708
Passmark CPU (Multi-Core)
Ryzen 9 3900XT
+1%
33109
Ryzen 9 3900X
32895
Geekbench 5 (Single-Core)
Ryzen 9 3900XT
1327
Ryzen 9 3900X
1329
Geekbench 5 (Multi-Core)
Ryzen 9 3900XT
+1%
12331
Ryzen 9 3900X
12175
Submit your Cinebench R23 result
By purchasing through links on this site, we may receive a commission from Amazon. This does not affect our assessment methodology.
Specifications
Full technical specification of AMD Ryzen 9 3900XT and Ryzen 9 3900X
General
| Vendor | AMD | AMD |
| Released | July 7, 2020 | July 7, 2019 |
| Type | Desktop | Desktop |
| instruction set | x86-64 | x86-64 |
| Codename | Zen 2 (Matisse) | — |
| Integrated GPU | No | No |
| P-Cores | 12 | 12 |
| P-Threads | 24 | 24 |
| Base Frequency (P) | 3. 8 GHz 8 GHz |
3.8 GHz |
| Turbo Boost Frequency (P) | 4.7 GHz | 4.6 GHz |
| Total Cores | 12 | 12 |
| Total Threads | 24 | 24 |
| Bus Frequency | 100 MHz | 100 MHz |
| Multiplier | 38x | 38x |
| L1 Cache | 64K (per core) | 64K (per core) |
| L2 Cache | 512K (per core) | 512K (per core) |
| L3 Cache | 64MB (shared) | 64MB (shared) |
| Unlocked Multiplier | Yes | Yes |
Package
| Transistors | 3. 8 billions 8 billions |
3.8 billions |
| Fabrication process | 7 nm | 7 nm |
| Socket | AM4 | AM4 |
| TDP | 105 W | 105 W |
| Peak temperature | 95°C | 95°C |
Memory Support
| Memory types | DDR4-3200 | DDR4-3200 |
| Memory Size | 128 GB | 128 GB |
| Max. Memory Channels | 2 | 2 |
| Max. Memory Bandwidth | 47.68 GB/s | 47.68 GB/s |
| ECC Support | Yes | Yes |
| Official site | AMD Ryzen 9 3900XT official page | AMD Ryzen 9 3900X official page |
| PCI Express Version | 4.
|