Meet the new, tougher Cinebench R20 benchmark: We test it on Xeon and Threadripper
Maxon’s popular Cinebench CPU benchmarking program just got a long-overdue update to bring it up to parity with modern PCs. We’ve already tried it, on two of the most powerful CPUs you can buy today, and have results to share, along with some historical context and tips for using it with your own CPU.
A little Cinebench history
The free Cinebench R20 app is intended to replace Cinebench R15, which first saw service in 2013. To give you an idea of how far we’ve come in hardware, the top-end desktop CPU in 2013 was a quad-core, 4th-gen Haswell Core i7, while an enthusiast-level chip was a six-core 3rd-gen Ivy Bridge-E Core i7.
Today, Intel’s top-cat consumer CPU is the Core i9-9980XE (available on Amazon) with 18 cores. And although not really intended for consumers without the bank account of Bill Gates, the company also just pushed a 28-core Xeon W-3175X.
AMD, meanwhile, is making 8-core CPUs rain and offers a 32-core Threadripper 2990WX for high-end consumers at a crazy-reasonable price.
IDG
Maxon’s new Cinebench R20 running through its paces on a 28-core Xeon W-3175X.
To keep Cinebench R20 more relevant, the company has increased the workload complexity, increased memory use, and adopted the latest rendering engine from the product it’s based on: Cinema 4D R20. The engine itself features support for Intel’s Embree raytracing technology, which has also been adopted by Valve, AutoDesk, UbiSoft, V-ray, Blender, and Corona, among others. Under the hood, the R20 engine supports AVX, AVX2, and AVX512 instruction sets. Because we can never have enough, the benchmark now supports up to 256 render threads.
Benchmark politics
Maxon’s Cinebench refresh arrives with some historical baggage. At one point, previous versions of Cinebench had been tainted by accusations that it hobbled AMD performance by using the Intel compiler, which favored Intel’s CPUs over AMD’s. Maxon, however, denied this and told PCWorld in 2017 that despite what the FTC maintained, it didn’t use the infamous “CPU ID” options that favored Intel chips.
It’s all water under the bridge now, as AMD itself used Cinebench R15 to demonstrate just how fast its Ryzen CPUs were. Maxon claims all is peace and harmony. “Maxon also works very closely with Intel and AMD to test Cinebench on not only the most recent CPUs but the next generation as well. This allows Maxon and Cinema 4D to stay on the cutting edge and deliver the performance required to satisfy the top production companies,” Maxon officials told us.
IDG
Cinebench R20 was originally intended to be on official Microsoft and Apple stores only but after an outcry, Maxon will release it as a standalone. (Hooray!)
Windows Store only (no more)
Maxon originally offered PC users Cinebench R20 on the Windows store only which raised hackles across the Internet. The company went so far as to force third-party sites from hosting stand alone versions they had extracted.
Company officials even told PCWorld: “It’s doubtful Maxon will be releasing a standalone Win32 installer version at this time. Cineware is a derivative of Maxon’s flagship product Cinema 4D, used to create ‘high-end’ 3D animation,” Maxon officials told PCWorld. “Cineware is meant to test the hardware and OS artists will actually be using in production. Creatives are constantly pushing the boundaries of hardware and OS performance. Therefore, Cinebench too must push those boundaries in order to provide accurate comparisons.”
Apparently you can push boundaries too far, as the company will offer Cinebench R20 on the Windows Store, Apple Store (for MacOS users), and as a standalone available here. Still, props should go to Maxon for making it available rather than digging in.
Cinebench R20 on 28-core Xeon W-3175X and 32-core Threadripper 2990WX
Make no mistake, Cinebench R20 is a big change–a tougher test for today’s faster CPUs. To see how big a difference it makes, we fired up a 28-core Xeon W-3175X and a 32-core Threadripper 2990WX to test on both Cinebench R15 and Cinebench R20.
Like Cinebench R15, Cinebench R20 features a single static scene that is rendered out. In the chart below, you see the performance of the 32-core Threadripper 2990WX and the performance in red, and Intel’s Xeon W-3175X in blue. The shorter bars are Cinebench R15 (also freshly run on the machines), while the longer bars are Cinebench R20.
With Cinebench R15, the Xeon W-3175X clocks in just under 3.6 percent faster. We’d call that a tie mostly. With Cinebench R20, the margin increases to just under 10 percent in favor of the 28-core Xeon W-3175X. That’s a decent uptick in performance for the Xeon over Threadripper. When you remember that the Xeon has 28 cores vs. the Threadripper’s 32, it’s not a great look for Threadripper.
IDG
The 32 cores of the Threadripper 2990WX make it damn near even with the higher-clocked 28-core Xeon W-3175X in the much older Cinebench R15. Move to Cinebench R20, and the gap opens considerably.
That’s just the default test, using all of the CPU cores available. We also ran the test’s optional single-threaded test. Cinebench R20 surprisingly puts the Threadripper 2990WX slightly ahead by about 2 percent—which again—is well within the margin of error, and what we’d consider a tie. Still, that’s a decent swing from Cinebench R15, which put the Xeon W-3175X ahead by just under 10 percent.
IDG
Single-threaded performance of the Xeon W-3175X drops back a bit with Cinebench R20, which doesn’t make sense, so we re-ran it.
We’re actually surprised by the score here, as we thought the higher clock speeds of the Xeon W-3175X would easily put it ahead. It’s possible the Xeon’s performance actually loses some ground in single-threaded tests when AVX, AVX2 or AVX512 is used, as Intel allows the CPU to shift down for the more difficult AVX workloads.
Update: After running our original story, Intel officials contacted us about our oddly low single-threaded scores from the Xeon W-3175X as the company’s own scores for the CPU were higher.
We went ahead and reset our system’s UEFI and let the thermal paste set longer (we had removed the cold plate for photography at the end of our review of the chip). Our results after the reset actually made more sense, as the score went from 418 to 444. That’s only about a 6 percent swing from the old score to the new score, but enough to put the Xeon W-3175X where we originally expected it: slightly faster than the Ryzen Threadripper 2990WX.
IDG
After resetting the UEFI on our Xeon W-3175X, the scores for single-threaded performance actually made a lot more sense.
Maxon said the test increases the computational workload eight fold. In casual observation, we noted about 5GB of RAM being used during runs on both machines. Power consumption didn’t seem to change much: Both systems hit similar peaks between Cinebench R15 and Cinebench R20.
Total time to run on the 28-core Xeon W-3175X was about 29 seconds, while the 32-core Threadripper 2990WX took about 32 seconds. For comparison, Cinebench R15 runs on the Xeon and Threadripper took about 9 seconds, respectively.
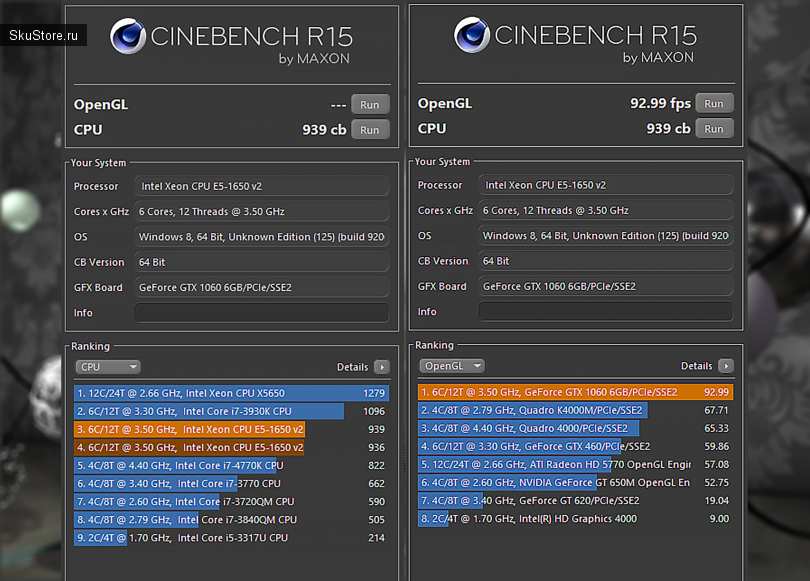
Goodbye, OpenGL
One last thing we should note is how the new version jettisons OpenGL performance testing. That’s a small loss, as OpenGL on consumer-level graphics cards in Windows has always been lackluster. For those who want to measure OpenGL GPU performance, other tests will do a better job.
IDG
You can essentially loop Cinebench by selecting a minimum run time for the test and selecting a custom number of cores to test.
How to run Cinebench R20
If you’re ready to dip your toes into the testing waters, Cinebench R20 is a great start. To install it, simply go to the Windows Store and search for “Cinebench,” and install it.
Once installed, you should reboot your machine, and disconnect it from the network to prevent it from updating in the background. It’s also recommended that you disable or pause virus testing, and shut down other applications to prevent them from influencing the score.
When ready, fire up Cinebench from the Start menu and push the Run button. You should run the test at least three times and average all three if you’re looking for more reliable results. If you’re looking for pure performance runs, give the machine a minute or two between runs (consider even longer rest periods on a laptop.)
To measure single-core performance, select File > Advanced benchmark, which will reveal a button for CPU (Single Core).
To stress-test your system, go into File > Preferences and set a Minimum Test Duration. Set, say, 3,600 seconds, and Cinebench R20 will loop the workload on the given amount of threads for an hour.
Gordon Mah Ung
Interpreting Cinebench R20 results
When talking about the results you get from a 3D rendering test, you should put it in the proper perspective. Cinebench R20 is a test to measure how a computer (Windows 10 or MacOS) renders 3D using the latest CPU instruction sets. It’s not a GPU test. It’s not an SSD test. It’s almost purely a CPU test that tells you how a PC will perform rendering 3D models.
That doesn’t necessarily tell you how a PC will operate in Microsoft Office or Google Chrome or even Photoshop, because very few consumer-level applications will actually scale to the number of cores available today.
Still, as a tool to measure approximate levels of performance under multi-threaded loads (and single-threaded loads) it’s a repeatable, reliable test and a welcome update from Cinebench R15.
IDG
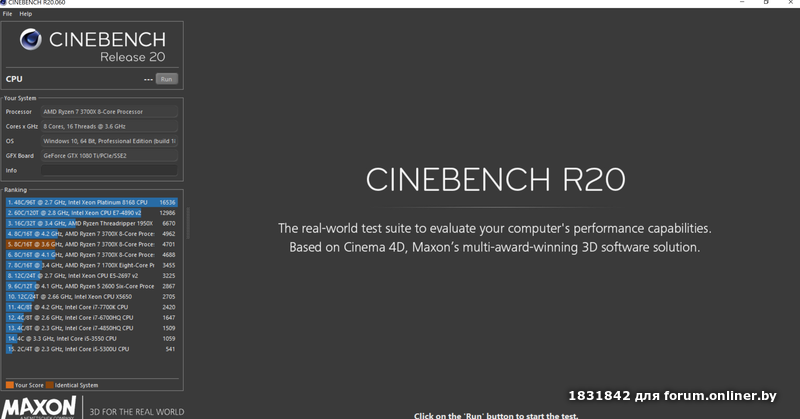
We like to use Cinebench R15 (and probably now R20) to give us an idea of performance across different amount of CPU cores.
Cinebench R20 processor performance rankings, specifications CPU and scores
Cinebench R20 is a high load CPU test for long tasks on a desktop or notebook PC, using a multi-core and hyperthreading. Unleashes the processor’s potential to handle demanding 3D tasks. The benchmark is based on Cinema 4D 20 Suite.
Processor
AMD Ryzen Threadripper 3990X
Score1
24763
Score2
495
Cores
64
Hertz
2.90 GHz
TDP (PL1)
280 W
Release date
Q1/2020
Processor
AMD Ryzen Threadripper Pro 3995WX
Score1
24463
Score2
477
Cores
64
Hertz
2. 70 GHz
TDP (PL1)
280 W
Release date
Q1/2021
Processor
AMD Epyc 7742
Score1
20644
Score2
398
Cores
64
Hertz
2.25 GHz
TDP (PL1)
225 W
Release date
Q3/2019
Processor
AMD Epyc 7702P
Score1
18857
Score2
391
Cores
64
Hertz
2.00 GHz
TDP (PL1)
200 W
Release date
Q3/2019
Processor
AMD Epyc 7702
Score1
18857
Score2
391
Cores
64
Hertz
2. 00 GHz
TDP (PL1)
200 W
Release date
Q3/2019
Processor
AMD Epyc 7662
Score1
18203
Score2
386
Cores
64
Hertz
2.00 GHz
TDP (PL1)
225 W
Release date
Q1/2020
Processor
AMD Epyc 7662
Score1
18203
Score2
386
Cores
64
Hertz
2.00 GHz
TDP (PL1)
225 W
Release date
Q1/2020
Processor
AMD Ryzen Threadripper 3970X
Score1
17105
Score2
509
Cores
32
Hertz
3. 70 GHz
TDP (PL1)
280 W
Release date
Q4/2019
Processor
AMD Ryzen Threadripper PRO 3975WX
Score1
16740
Score2
509
Cores
32
Hertz
3.50 GHz
TDP (PL1)
280 W
Release date
Q3/2020
Processor
Intel Core i9-13900K
Score1
15350
Score2
877
Cores
24
Hertz
3.80 GHz
TDP (PL1)
125 W
Release date
Q4/2022
Processor
Intel Core i9-13900KF
Score1
15350
Score2
877
Cores
24 / 32
Hertz
3. 00 GHz (5.80 GHz)
TDP (PL1)
125 W
Release date
Q4/2022
Processor
AMD Ryzen 9 7950X
Score1
15120
Score2
793
Cores
16 / 32
Hertz
4.50 GHz
TDP (PL1)
170 W
Release date
Q4/2022
Processor
AMD Ryzen Threadripper 3960X
Score1
13552
Score2
509
Cores
24
Hertz
3.80 GHz
TDP (PL1)
280 W
Release date
Q4/2019
Processor
Intel Xeon W-3175X
Score1
12975
Score2
417
Cores
28
Hertz
3. 10 GHz
TDP (PL1)
255 W
Release date
Q4/2018
Processor
Intel Core i9-13900
Score1
12375
Score2
872
Cores
24 / 32
Hertz
2.00 GHz (5.60 GHz)
TDP (PL1)
65 W
Release date
Q1/2023
Processor
Intel Core i9-13900F
Score1
12375
Score2
872
Cores
24 / 32
Hertz
2.00 GHz (5.60 GHz)
TDP (PL1)
65 W
Release date
Q1/2023
Processor
Intel Core i7-13700KF
Score1
11831
Score2
815
Cores
16 / 24
Hertz
3. 40 GHz (5.40 GHz)
TDP (PL1)
125 W
Release date
Q4/2022
Processor
Intel Core i7-13700K
Score1
11831
Score2
815
Cores
16
Hertz
3.40 GHz
TDP (PL1)
125 W
Release date
Q4/2022
Processor
AMD Ryzen 9 7900X
Score1
11572
Score2
781
Cores
12 / 24
Hertz
4.70 GHz
TDP (PL1)
170 W
Release date
Q4/2022
Processor
AMD Ryzen Threadripper 2990WX
Score1
11463
Score2
398
Cores
32
Hertz
3. 00 GHz
TDP (PL1)
250 W
Release date
Q3/2018
AMD Ryzen 3 PRO 2300U
Intel Core i5-8250U
KFA2 GeForce GTX 1650 EX (1-Click OC) GDDR6
Palit GeForce GTX 1650 StormX
AMD Ryzen 7 5700X
AMD Ryzen 7 5800
MSI GeForce RTX 2080 SUPER Ventus OC
NVIDIA GeForce RTX 3070 Founders Edition
ASUS TUF Gaming GeForce RTX 3070 OC
GIGABYTE GeForce GTX 1050 Ti G1 Gaming 4G
Intel Core i5-1145G7
Intel Core i5-3437U
Intel Pentium G2030
Intel Core2 Duo E7500
Intel Core i7-11700K
AMD Ryzen 7 5800H
Intel Pentium B950
Intel Core i9-12900K
Intel Pentium B950
Intel Core i3-11100
Intel Pentium B950
Intel Core i7-12700
Intel Pentium B950
Intel Core i5-12600K
Intel Pentium 7505
Intel Core i3-12100
Palit GeForce GTX 1650 StormX
MSI GeForce GTX 1650 D6 VENTUS XS OCV1
|
|