Intel Core i5-5200U benchmarks (vs Core i5-4200U and i5-4210U)
A few days ago I posted an article on the Intel Core i7-5500U processor, a higher-tier CPU part of Intel’s Broadwell U hardware platform, one that should make it into most top-configured ultrabooks that will be available in the next few months.
This time is the Intel Core i5-5200U’s turn, a main-stream, more affordable and only marginally slower processor, as proven in this side by side comparison between the i5-5200U and the i7-5500U. This post is here however to tell you a few more things about this mid-range Broadwell U CPU and show how it compares with the Haswell Core i5 offers, namely the i5-4200U and the later updated i5-4210U. This way, if you have to choose between one of the new Broadwell configurations and an older Haswell one, which should be BTW somewhat cheaper, you’d know what to expect and what to pick.
First though, a few words on this processor.
Broadwell U is only a Tick step in Intel’s Tick-Tock strategy, which means it’s a manufacturing process shrinkage. If we’re to get a bit technical, while the Haswell platform was based on a 22 nm lithography, the Broadwell is a 14 nm process. In simple words, that equals that more “components” can be placed on a similar sized processor, or, that the new processors are physically smaller and require less energy to operate than their predecessors. The latter is mostly the case here.
Of course, there are a handful on subtle differences and updates between a Haswell U and a Broadwell U processor, but as a large picture, you should not expect major performance boosts from the Broadwell platform when compared to last years’ offer (especially performance-per-clock).
With that in mind, let’s have a look at the specs.
| Intel Core i5-5200U (Ark) |
Intel Core i5-4200U (Ark) |
Intel Core i5-4210U (Ark) |
|
| Processor Base Frequency | 2.2 GHz | 1. 6 GHz 6 GHz |
1.7 GHz |
| TurboBoost Max Frequency | 2.7 GHz | 2.6 GHz | 2.7 GHz |
| Cache | 3 MB | 3 MB | 3 MB |
| TDP | 15 W | 15 W | 15 W |
| Memory Size | up to 16 GB DDR3, dual-channel | up to 16 GB DDR3, dual-channel | up to 16 GB DDR3, dual-channel |
| Graphics | Intel HD 5500 | Intel HD 4400 | Intel HD 4400 |
| Graphics Frequency | 300 – 900 MHz | 200 – 1000 MHz | 200 – 1000 MHz |
| Graphic Execution Units | 24 | 20 | 20 |
Ok, so there are two major differences between the Core i5-5200U and the other processors above: base CPU frequency and the Integrated graphics embedded.
Due to the 14nm manufacturing processing, Intel were able to create a higher clocked processor and that will have some impact on everyday performance. Besides this, the differences between the graphics solutions might not seem that much on paper, but in reality they are significant, as proven by both the benchmarks and the actual gaming results that we’ll be mentioning below.
So for starters, here are some raw CPU benchmark results.
| Benchmark | i5-5200U (2.2 GHz. 2.7 GHz TB) | i5-4200U (1.6 GHz, 2.6 TB) | i5-4210U (1.7 GHz, 2.7 GHz TB) |
| Cinebench R15 CPU | 259 cb | 229 cb | 237 cb |
| Cinebench R15 CPU – Single Core | 100 cb | 99 cb | 102 cb |
| Cinebench R11.5 CPU | 2.84 pts | 2.5 pts | 2.6 pts |
| Cinebench R11.5 CPU – Single Core | 1.18 pts | 1.1 pts | 1.2 pts |
x264 HD Benchmark 4. 0 – Pass 1 0 – Pass 1 |
86.66 fps | 77.5 fps | 79.5 fps |
The data pool for the i5-5200U is still very limited and the numbers above are based on my XPS 13 2015 edition (with 4 GB of RAM and SSD) and that’s why you should be aware these results might vary within reasonable limits, based on the tested configuration. For the i5-4200U and the i5-4210U I used Notebookcheck.net’s median results, as they have a larger range of tested products over the years (available here and here).
With that in mind, we can draw a few conclusions:
- Single Core performance between the two generations is within a 5% margin and that’s because when running these benchmarks, the CPUs should run at their maximum Turbo Boost frequencies, which are almost identical across the board (somewhat lower for the i5-4200U, visible in the results).
- The Broadwell option steps in front when it comes to multi-core benchmarks, due to its higher base clock.
 Even so, the numbers are only withing 5-15% better when compared to the Haswell CPUs. SO while in reality you won’t really feel the difference between the two generations in casual everyday use, the i5-5200U and other Broadwell i5s will be somewhat snappier under more demanding tasks and multitasking.
| Benchmark | i5-5200U normalized | i5-4200U normalized | i5-4210U normalized |
| Cinebench R15 CPU | 117 cb | 143 cb | 139 cb |
| Cinebench R11.5 CPU | 1.29 pts | 1.56 pts | 1.52 pts |
| x264 HD Benchmark 4.0 – Pass 1 | 39.4 fps | 48.4 fps | 46.7 fps |
| x264 HD Benchmark 4.0 – Pass 2 | 7.55 fps | 9.05 fps | 7.2 fps |
However, if we normalize the multi-core results to 1GHz in order to determine each CPU’s performance per clock, we’d see that the i5-5200U actually trails behind the Haswell options. And that for me means one thing: immature drivers, as the platform was just recently released, which in time should translate to somewhat improved results and overall performance. It could also mean that the Broadwell U platform’s performance-per-clock is just designed to sit beneath Haswell’s.
However, keep in mind that this “normalization” is far from accurate, as I’ve considered that each CPU runs at its base frequency. However, the processors aren’t running at the exact base frequency during the tests, they might run higher (due to Turbo Boost) or lower (due to overheating, throttling, etc), depending on the implementation. So take these particular results as a general reference ONLY.
Broadwell U vs Haswell U
Still, that should not matter much to end users. What you should know is that the i5-5200U is overall 5-15% faster than the Haswell based 15W Core i5 processors and it should also be 10-20% more efficient, based on Intel’s press-releases and my limited experience with the platform so far. But we’ll talk more about that in a future article, once I get to test more Broadwell U configurations.
As for the graphics, I also plan on analyzing the Intel HD 5500 chip in a separate and more detailed article. But I’ll give you some spoilers here as well.
| Benchmark | i5-5200U (HD 5500) | i5-4200U (HD 44000) |
i5-4210U (HD 4400) |
| Cinebench R15 GPU | 30.22 fps | ~20 fps | ~20 fps |
| Cinebench R11.5 GPU | 24.63 fps | ~18 fps | ~18 fps |
| 3DMark 1 | P1147 | ~P900 | ~P920 |
| 3DMark Cloud Gate | 5057 | ~3400 | ~3500 |
Again, the i5-5200U results are based on the Dell XPS 13 2015, while the Haswell CPUs’ numbers are based on several different reviews I did over the years. Thus, you should only take them as a general reference, they will vary from product to product, from configuration to configuration.
The bigger picture is that the Intel HD 5500 chip is actually significantly faster then the Intel HD 4400 solutions. And that’s noticeable both in benchmarks, but especially if you plan to run some light games on your ultraportables. Still, like I said, you should read my latest reviews for more updates or wait for the in-depth post about the HD 5500 graphics chip, should be available here on the site in a few weeks, as I gather more data.
At the end of the day, I’d say Intel did a fine job with the mid-range Core i5-5200U processor and if paired with 8 GB of RAM and a proper SSD, such a configuration should do well for most of you, as long as you plan on using your computer for everyday activities such as browsing, editing texts, chatting, listening to music, watching all sorts of video contents and even play some casual games.
Compared to the previous Haswell i5 processors, this one offers slightly better results in RAW CPU benchmarks (and it’s actually really close to the Haswell i7 processors) and significantly better results in anything graphics related. On top of these, it should be more efficient, which translates in longer runtimes, cooler laptops and potentially new and more compact form factors.
Time will tell.
If you want to know how the i5-5200U compares to the i7-5500U, you should follow this link. And if I get to test any of the Broadwell i3 configurations, I’ll have a dedicated post about it as well.
For now, we’ll wrap it up here. This post should show you what to expect from the Intel Core i5-5200U CPU and whether it’s a good buy or not. In my opinion it is, but if you’re on a tight budget or just find a very good deal on a Haswell configuration, that could prove to be a smarter pick. Just get in touch if you have any questions or anything to add and I’ll get back to you.
Intel Core i5-4200U vs Intel Core i5-5200U
|
|
|
|
|
Intel Core i5-4200U vs Intel Core i5-5200U
Comparison of the technical characteristics between the processors, with the Intel Core i5-4200U on one side and the Intel Core i5-5200U on the other side.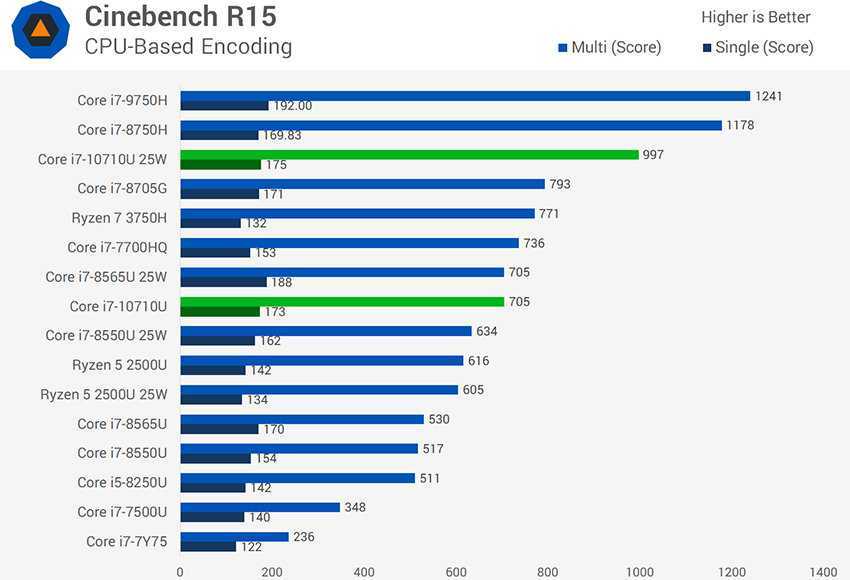 The first is dedicated to the ultrabook sector, It has 2 cores, 4 threads, a maximum frequency of 2,6GHz. The second is used on the laptop segment, it has a total of 2 cores, 4 threads, its turbo frequency is set to 2,7 GHz. The following table also compares the lithography, the number of transistors (if indicated), the amount of cache memory, the maximum RAM memory capacity, the type of memory accepted, the release date, the maximum number of PCIe lanes, the values obtained in Geekbench 4 and Cinebench R15.
Note: Commissions may be earned from the links above.
This page contains references to products from one or more of our advertisers. We may receive compensation when you click on links to those products. For an explanation of our advertising policy, please visit this page.
Specifications:
| Processor | Intel Core i5-4200U | Intel Core i5-5200U | ||||||
| Market (main) | Ultrabook | Laptop | ||||||
| ISA | x86-64 (64 bit) | x86-64 (64 bit) | ||||||
| Microarchitecture | Haswell | Broadwell | ||||||
| Core name | Haswell-ULT | Broadwell-U | ||||||
| Family | Core i5-4000 | Core i5-5000 | ||||||
| Part number(s), S-Spec |
CL8064701477702, |
FH8065801620204, |
||||||
| Release date | Q3 2013 | Q1 2015 | ||||||
| Lithography | 22 nm | 14 nm | ||||||
| Transistors | 1. 400.000.000 400.000.000 |
1.300.000.000 | ||||||
| Cores | 2 | 2 | ||||||
| Threads | 4 | 4 | ||||||
| Base frequency | 1,6 GHz | 2,2 GHz | ||||||
| Turbo frequency | 2,6 GHz | 2,7 GHz | ||||||
| Bus speed | 5 GT/s | 5 GT/s | ||||||
| Cache memory | 3 MB | 3 MB | ||||||
| Max memory capacity | 16 GB | 16 GB | ||||||
| Memory types |
DDR3L 1333/1600, |
DDR3L 1333/1600, |
||||||
| Max # of memory channels | 2 | 2 | ||||||
| Max memory bandwidth | 25,6 GB/s | 25,6 GB/s | ||||||
| Max PCIe lanes | 12 | 12 | ||||||
| TDP | 15 W | 15 W | ||||||
| GPU integrated graphics | Intel HD Graphics 4400 Mobile | Intel HD Graphics 5500 | ||||||
| GPU execution units | 20 | 24 | ||||||
| GPU shading units | 160 | 192 | ||||||
| GPU base clock | 200 MHz | 300 MHz | ||||||
| GPU boost clock | 1000 MHz | 900 MHz | ||||||
| GPU FP32 floating point | 304 GFLOPS | 364,8 GFLOPS | ||||||
| Socket | BGA1168 | BGA1168 | ||||||
| Maximum temperature | 100°C | 105°C | ||||||
| CPU-Z single thread | 220 | 224 | ||||||
| CPU-Z multi thread | 617 | 761 | ||||||
| Cinebench R15 single thread | 99 | 110 | ||||||
| Cinebench R15 multi-thread | 232 | 260 | ||||||
| Cinebench R23 single thread | 506 | 610 | ||||||
| Cinebench R23 multi-thread | 1. 224 224 |
1.174 | ||||||
| PassMark single thread | 1.313 | 1.506 | ||||||
| PassMark CPU Mark | 2.181 | 2.499 | ||||||
| (Windows 64-bit) Geekbench 4 single core |
2.436 | 2.818 | ||||||
| (Windows 64-bit) Geekbench 4 multi-core |
4.576 | 5.175 | ||||||
| (SGEMM) GFLOPS performance |
65,2 GFLOPS | 54,5 GFLOPS | ||||||
| (Multi-core / watt performance) Performance / watt ratio |
305 pts / W | 345 pts / W | ||||||
| Amazon | ||||||||
| eBay |
Note: Commissions may be earned from the links above.
We can better compare what are the technical differences between the two processors.
Price: For technical reasons, we cannot currently display a price less than 24 hours, or a real-time price. This is why we prefer for the moment not to show a price. You should refer to the respective online stores for the latest price, as well as availability.
We see that the two processors have an equivalent number of cores, the turbo frequency of Intel Core i5-5200U is bigger, that their respective TDP are of the same order. The Intel Core i5-5200U was started more recently.
Performances :
Performance comparison between the two processors, for this we consider the results generated on benchmark software such as Geekbench 4.
| CPU-Z — Multi-thread & single thread score | |
|---|---|
| Intel Core i5-5200U |
224 761 |
| Intel Core i5-4200U |
220 617 |
In single core, the difference is 2%. In multi-core, the difference in terms of gap is 23%.
Note: Commissions may be earned from the links above. These scores are only an
average of the performances got with these processors, you may get different results.
CPU-Z is a system information software that provides the name of the processor, its model number, the codename, the cache levels, the package, the process. It can also gives data about the mainboard, the memory. It makes real time measurement, with finally a benchmark for the single thread, as well as for the multi thread.
| Cinebench R15 — Multi-thread & single thread score | |
|---|---|
| Intel Core i5-5200U |
110 260 |
| Intel Core i5-4200U |
99 232 |
In single core, the difference is 11%. In multi-core, the difference in terms of gap is 12%.
Note: Commissions may be earned from the links above. These scores are only an
average of the performances got with these processors, you may get different results.
Cinebench R15 evaluates the performance of CPU calculations by restoring a photorealistic 3D scene. The scene has 2,000 objects, 300,000 polygons, uses sharp and fuzzy reflections, bright areas, shadows, procedural shaders, antialiasing, and so on. The faster the rendering of the scene is created, the more powerful the PC is, with a high number of points.
| Cinebench R23 — Multi-thread & single thread score | |
|---|---|
| Intel Core i5-4200U |
506 1.224 |
| Intel Core i5-5200U |
610 1.174 |
In single core, the difference is -17%. In multi-core, the differential gap is 4%.
Note: Commissions may be earned from the links above. These scores are only an
average of the performances got with these processors, you may get different results.
Cinebench R23 is cross-platform testing software that allows you to assess the hardware capabilities of a device such as a computer, tablet, server. This version of Cinebench takes into account recent developments in processors with multiple cores and the latest improvements in rendering techniques. The evaluation is ultimately even more relevant. The test scene contains no less than 2,000 objects and more than 300,000 polygons in total.
| PassMark — CPU Mark & single thread | |
|---|---|
| Intel Core i5-5200U |
1.506 2.499 |
| Intel Core i5-4200U |
1.313 2.181 |
In single core, the difference is 15%. In multi-core, the difference in terms of gap is 15%.
Note: Commissions may be earned from the links above. These scores are only an
average of the performances got with these processors, you may get different results.
PassMark is a benchmarking software that performs several performance tests including prime numbers, integers, floating point, compression, physics, extended instructions, encoding, sorting. The higher the score is, the higher is the device capacity.
On Windows 64-bit:
| Geekbench 4 — Multi-core & single core score — Windows 64-bit | |
|---|---|
| Intel Core i5-5200U |
2.818 5.175 |
| Intel Core i5-4200U |
2.436 4.576 |
In single core, the difference is 16%. In multi-core, the difference in terms of gap is 13%.
On Linux 64-bit:
| Geekbench 4 — Multi-core & single core score — Linux 64-bit | |
|---|---|
| Intel Core i5-5200U |
2.931 5.074 |
| Intel Core i5-4200U |
2.411 3.997 |
In single core, the difference is 22%. In multi-core, the difference in terms of gap is 27%.
On Android 64-bit:
| Geekbench 4 — Multi-core & single core score — Android 64-bit | |
|---|---|
| Intel Core i5-5200U |
2.436 4.184 |
| Intel Core i5-4200U |
2.128 3.422 |
In single core, the difference is 14%. In multi-core, the difference in terms of gap is 22%.
On Mac OS X 64-bit:
| Geekbench 4 — Multi-core & single core score — Mac OS X 64-bit | |
|---|---|
| Intel Core i5-5200U |
3. 
|