Intel Core i5-1035G1 vs Intel Core i5-10210U
|
|
|
|
|
Intel Core i5-1035G1 vs Intel Core i5-10210U
Comparison of the technical characteristics between the processors, with the Intel Core i5-1035G1 on one side and the Intel Core i5-10210U on the other side. The first is dedicated to the ultrabook sector, It has 4 cores, 8 threads, a maximum frequency of 3,6GHz. The second is used on the laptop segment, it has a total of 4 cores, 8 threads, its turbo frequency is set to 4,2 GHz. The following table also compares the lithography, the number of transistors (if indicated), the amount of cache memory, the maximum RAM memory capacity, the type of memory accepted, the release date, the maximum number of PCIe lanes, the values obtained in Geekbench 4 and Cinebench R15.
Note: Commissions may be earned from the links above.
This page contains references to products from one or more of our advertisers. We may receive compensation when you click on links to those products. For an explanation of our advertising policy, please visit this page.
Specifications:
| Processor | Intel Core i5-1035G1 | Intel Core i5-10210U | ||||||
| Market (main) | Ultrabook | Laptop | ||||||
| ISA | x86-64 (64 bit) | x86-64 (64 bit) | ||||||
| Microarchitecture | Ice Lake | Comet Lake | ||||||
| Core name | Ice Lake-U | Comet Lake-U | ||||||
| Family | Core i5-1000 | Core i5-10000 | ||||||
| Part number(s), S-Spec |
FJ8068904368700, |
FJ8070104307504, |
||||||
| Release date | Q3 2019 | Q3 2019 | ||||||
| Lithography | 10 nm+ | 14 nm++ | ||||||
| Cores | 4 | 4 | ||||||
| Threads | 8 | 8 | ||||||
| Base frequency | 1,0 GHz | 1,6 GHz | ||||||
| Turbo frequency | 3,6 GHz | 4,2 GHz | ||||||
| Bus speed | 4 GT/s | 4 GT/s | ||||||
| Cache memory | 6 MB | 6 MB | ||||||
| Max memory capacity | 64 GB | 64 GB | ||||||
| Memory types |
DDR4-3200, LPDDR4-3733 |
DDR4-2666, LPDDR3-2133, LPDDR4-2933 |
||||||
| Max # of memory channels | 2 | 2 | ||||||
| Max memory bandwidth | 59,7 GB/s | 45,8 GB/s | ||||||
| Max PCIe lanes | 16 | 16 | ||||||
| TDP | 15 W | 15 W | ||||||
| GPU integrated graphics | Intel UHD Graphics G1 (Ice Lake) | Intel UHD Graphics (Comet Lake) | ||||||
| GPU execution units | 32 | 24 | ||||||
| GPU shading units | 256 | 192 | ||||||
| GPU base clock | 300 MHz | 300 MHz | ||||||
| GPU boost clock | 1050 MHz | 1100 MHz | ||||||
| GPU FP32 floating point | 460,8 GFLOPS | 422,4 GFLOPS | ||||||
| Socket | BGA1526 | BGA1528 | ||||||
| Maximum temperature | 100°C | 100°C | ||||||
| AI accelerator |
Gaussian & Neural Accelerator, |
— |
||||||
| Crypto engine |
AES New Instructions, |
AES New Instructions, |
||||||
| Security |
Software Guard Extensions, |
Software Guard Extensions, |
||||||
| Max display resolution |
5120 x 3200@60Hz |
4096 x 2304@60Hz |
||||||
| CPU-Z single thread | 419 | 467 | ||||||
| CPU-Z multi thread | 2. 155 155 |
2.281 | ||||||
| Cinebench R15 single thread | 167 | 166 | ||||||
| Cinebench R15 multi-thread | 573 | 575 | ||||||
| Cinebench R20 single thread | 428 | 409 | ||||||
| Cinebench R20 multi-thread | 1.236 | 1.181 | ||||||
| Cinebench R23 single thread | 1.103 | 1.042 | ||||||
| Cinebench R23 multi-thread | 3.353 | 4.023 | ||||||
| PassMark single thread | 2.358 | 2.270 | ||||||
| PassMark CPU Mark | 7. 996 996 |
6.524 | ||||||
| (Windows 64-bit) Geekbench 4 single core |
5.335 | 4.600 | ||||||
| (Windows 64-bit) Geekbench 4 multi-core |
16.790 | 13.872 | ||||||
| (Windows) Geekbench 5 single core |
1.018 | 906 | ||||||
| (Windows) Geekbench 5 multi-core |
3.229 | 2.970 | ||||||
| (SGEMM) GFLOPS performance |
148,84 GFLOPS | 243,9 GFLOPS | ||||||
| (Multi-core / watt performance) Performance / watt ratio |
1.119 pts / W | 925 pts / W | ||||||
| Amazon | ||||||||
| eBay |
Note: Commissions may be earned from the links above.
We can better compare what are the technical differences between the two processors.
Price: For technical reasons, we cannot currently display a price less than 24 hours, or a real-time price. This is why we prefer for the moment not to show a price. You should refer to the respective online stores for the latest price, as well as availability.
We see that the two processors have an equivalent number of cores, the turbo frequency of Intel Core i5-10210U is bigger, that their respective TDP are of the same order. Both were produced in the same year.
Performances :
Performance comparison between the two processors, for this we consider the results generated on benchmark software such as Geekbench 4.
| CPU-Z — Multi-thread & single thread score | |
|---|---|
| Intel Core i5-10210U |
467 2.  281 281 |
| Intel Core i5-1035G1 |
419 2.155 |
In single core, the difference is 11%. In multi-core, the difference in terms of gap is 6%.
Note: Commissions may be earned from the links above. These scores are only an
average of the performances got with these processors, you may get different results.
CPU-Z is a system information software that provides the name of the processor, its model number, the codename, the cache levels, the package, the process. It can also gives data about the mainboard, the memory. It makes real time measurement, with finally a benchmark for the single thread, as well as for the multi thread.
| Cinebench R15 — Multi-thread & single thread score | |
|---|---|
| Intel Core i5-10210U |
166 575 |
| Intel Core i5-1035G1 |
167 573 |
In single core, the difference is 1%. In multi-core, the difference in terms of gap is 0%.
Note: Commissions may be earned from the links above. These scores are only an
average of the performances got with these processors, you may get different results.
Cinebench R15 evaluates the performance of CPU calculations by restoring a photorealistic 3D scene. The scene has 2,000 objects, 300,000 polygons, uses sharp and fuzzy reflections, bright areas, shadows, procedural shaders, antialiasing, and so on. The faster the rendering of the scene is created, the more powerful the PC is, with a high number of points.
| Cinebench R20 — Multi-thread & single thread score | |
|---|---|
| Intel Core i5-1035G1 |
428 1.236 |
| Intel Core i5-10210U |
409 1.181 |
In single core, the difference is 5%. In multi-core, the differential gap is 5%.
Note: Commissions may be earned from the links above. These scores are only an
average of the performances got with these processors, you may get different results.
Cinebench R20 is a multi-platform test software which allows to evaluate the hardware capacities of a device such as a computer, a tablet, a server. This version of Cinebench takes into account recent developments in processors with multiple cores and the latest improvements in rendering techniques. The evaluation is ultimately even more relevant.
| Cinebench R23 — Multi-thread & single thread score | |
|---|---|
| Intel Core i5-10210U |
1.042 4.023 |
| Intel Core i5-1035G1 |
1.103 3.353 |
In single core, the difference is 6%.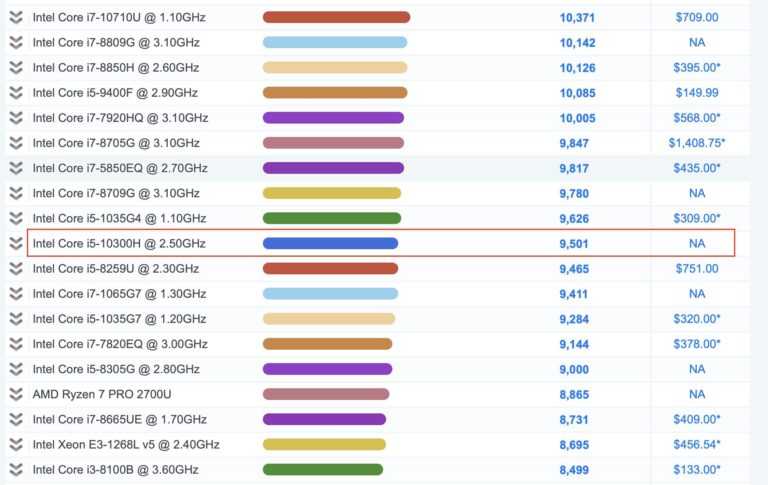 In multi-core, the difference in terms of gap is 20%.
Note: Commissions may be earned from the links above. These scores are only an
average of the performances got with these processors, you may get different results.
Cinebench R23 is cross-platform testing software that allows you to assess the hardware capabilities of a device such as a computer, tablet, server. This version of Cinebench takes into account recent developments in processors with multiple cores and the latest improvements in rendering techniques. The evaluation is ultimately even more relevant. The test scene contains no less than 2,000 objects and more than 300,000 polygons in total.
| PassMark — CPU Mark & single thread | |
|---|---|
| Intel Core i5-1035G1 |
2.358 7.996 |
| Intel Core i5-10210U |
2.  270 2706.524 |
In single core, the difference is 4%. In multi-core, the differential gap is 23%.
Note: Commissions may be earned from the links above. These scores are only an
average of the performances got with these processors, you may get different results.
PassMark is a benchmarking software that performs several performance tests including prime numbers, integers, floating point, compression, physics, extended instructions, encoding, sorting. The higher the score is, the higher is the device capacity.
On Windows 64-bit:
| Geekbench 4 — Multi-core & single core score — Windows 64-bit | |
|---|---|
| Intel Core i5-1035G1 |
5.335 16.790 |
| Intel Core i5-10210U |
4.600 13.  872 872 |
In single core, the difference is 16%. In multi-core, the differential gap is 21%.
On Linux 64-bit:
| Geekbench 4 — Multi-core & single core score — Linux 64-bit | |
|---|---|
| Intel Core i5-1035G1 |
5.049 13.762 |
| Intel Core i5-10210U |
2.134 8.303 |
In single core, the difference is 137%. In multi-core, the differential gap is 66%.
On Android 64-bit:
| Geekbench 4 — Multi-core & single core score — Android 64-bit | |
|---|---|
| Intel Core i5-10210U |
4.797 15.184 |
| Intel Core i5-1035G1 |
4.648 10.897 |
In single core, the difference is 3%. In multi-core, the difference in terms of gap is 39%.
On Mac OS X 64-bit:
| Geekbench 4 — Multi-core & single core score — Mac OS X 64-bit | |
|---|---|
| Intel Core i5-1035G1 |
5.265 16.096 |
| Intel Core i5-10210U |
4.154 14.151 |
In single core, the difference is 27%. In multi-core, the differential gap is 14%.
Note: Commissions may be earned from the links above. These scores are only an
average of the performances got with these processors, you may get different results.
Geekbench 4 is a complete benchmark platform with several types of tests, including data compression, images, AES encryption, SQL encoding, HTML, PDF file rendering, matrix computation, Fast Fourier Transform, 3D object simulation, photo editing, memory testing. This allows us to better visualize the respective power of these devices. For each result, we took an average of 250 values on the famous benchmark software.
On Windows:
| Geekbench 5 — Multi-core & single core score — Windows | |
|---|---|
| Intel Core i5-1035G1 |
1.018 3.229 |
| Intel Core i5-10210U |
906 2.970 |
In single core, the difference is 12%. In multi-core, the differential gap is 9%.
On Linux:
| Geekbench 5 — Multi-core & single core score — Linux | |
|---|---|
| Intel Core i5-1035G1 |
1.157 3.484 |
| Intel Core i5-10210U |
976 3.429 |
In single core, the difference is 19%.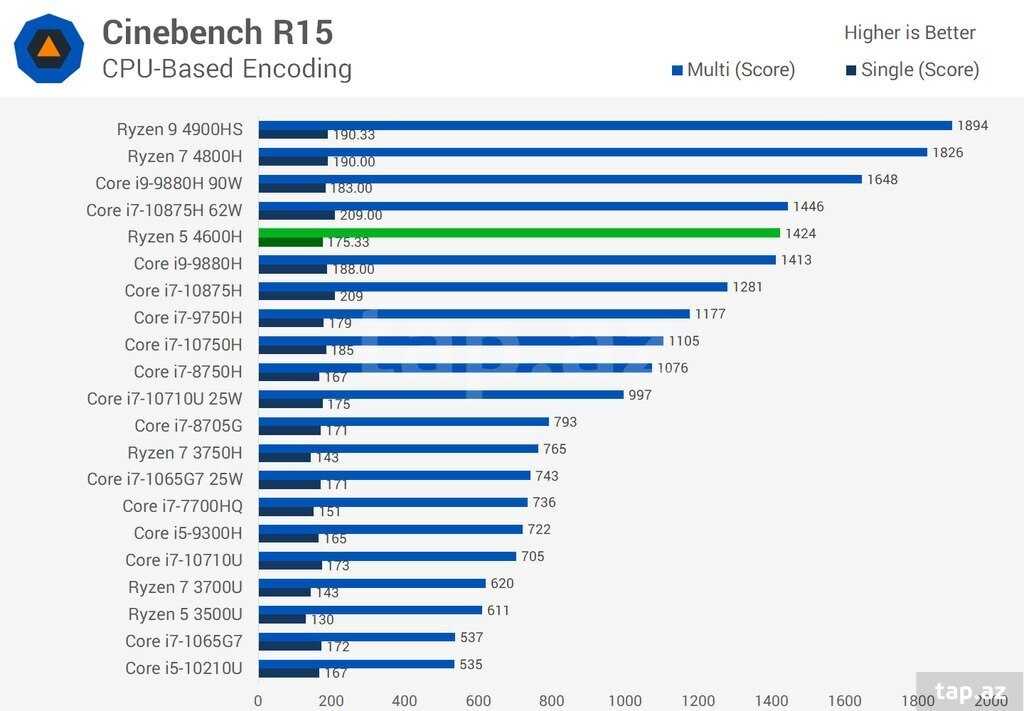 In multi-core, the differential gap is 2%.
On Android:
| Geekbench 5 — Multi-core & single core score — Android | |
|---|---|
| Intel Core i5-1035G1 |
1.110 3.928 |
| Intel Core i5-10210U |
931 3.195 |
In single core, the difference is 19%. In multi-core, the differential gap is 23%.
On macOS:
| Geekbench 5 — Multi-core & single core score — macOS | |
|---|---|
| Intel Core i5-10210U |
972 3.566 |
| Intel Core i5-1035G1 |
1.052 3.148 |
In single core, the difference is 8%. In multi-core, the difference in terms of gap is 13%.
Note: Commissions may be earned from the links above. These scores are only an
average of the performances got with these processors, you may get different results.
Geekbench 5 is a software for measuring the performance of a computer system, for fixed devices, mobile devices, servers. This platform makes it possible to better compare the power of the CPU, the computing power and to compare it with similar or totally different systems. Geekbench 5 includes new workloads that represent work tasks and applications that we can find in reality.
Equivalence:
Intel Core i5-1035G1 AMD equivalentIntel Core i5-10210U AMD equivalent
See also:
Intel Core i5-1035G4Intel Core i5-1035G7
Intel Core i5-10210Y
Intel Core i5-1035G1 vs. Intel Core i5-10210U
Intel Core i5-1035G1
The Intel Core i5-1035G1 operates with 4 cores and 8 CPU threads. It run at 3.60 GHz base 3.20 GHz all cores while the TDP is set at 15 W. The processor is attached to the BGA 1526 CPU socket. This version includes 6.00 MB of L3 cache on one chip, supports 2 memory channels to support DDR4-3200LPDDR4-3733 RAM and features 3.0 PCIe Gen 16 lanes. Tjunction keeps below 100 °C degrees C. In particular, Ice Lake U Architecture is enhanced with 10 nm technology and supports VT-x, VT-x EPT, VT-d. The product was launched on Q3/2019
Intel Core i5-10210U
The Intel Core i5-10210U operates with 4 cores and 8 CPU threads. It run at 4.20 GHz base 3.80 GHz all cores while the TDP is set at 15 W.The processor is attached to the BGA 1526 CPU socket. This version includes 6.00 MB of L3 cache on one chip, supports 2 memory channels to support DDR4-2666LPDDR3-2133LPDDR4-2933 RAM and features 3.0 PCIe Gen 16 lanes. Tjunction keeps below 100 °C degrees C. In particular, Comet Lake U Architecture is enhanced with 14 nm technology and supports VT-x, VT-x EPT, VT-d. The product was launched on Q3/2019
Intel Core i5-1035G1
Intel Core i5-10210U
Compare Detail
1. 00 GHz 00 GHz |
Frequency | 1.60 GHz |
| 4 | Cores | 4 |
| 3.60 GHz | Turbo (1 Core) | 4.20 GHz |
| 3.20 GHz | Turbo (All Cores) | 3.80 GHz |
| Yes | Hyperthreading | Yes |
| No | Overclocking | No |
| normal | Core Architecture | normal |
|
Intel UHD Graphics (Ice Lake G1) |
GPU |
Intel UHD Graphics (Comet Lake) |
| 1.05 GHz | GPU (Turbo) | 1.10 GHz |
| 10 nm | Technology | 14 nm |
| 1.05 GHz | GPU (Turbo) | 1.10 GHz |
| 12 | DirectX Version | 12 |
| 3 | Max. displays | 3 |
| DDR4-3200LPDDR4-3733 | Memory | DDR4-2666LPDDR3-2133LPDDR4-2933 |
| 2 | Memory channels | 2 |
| Max memory | ||
| No | ECC | No |
| — | L2 Cache | — |
6. 00 MB 00 MB |
L3 Cache | 6.00 MB |
| 3.0 | PCIe version | 3.0 |
| 16 | PCIe lanes | 16 |
| 10 nm | Technology | 14 nm |
| BGA 1526 | Socket | BGA 1526 |
| 15 W | TDP | 15 W |
| VT-x, VT-x EPT, VT-d | Virtualization | VT-x, VT-x EPT, VT-d |
| Q3/2019 | Release date | Q3/2019 |
|
Show more data |
Show more data |
Cinebench R23 (Single-Core)
Cinebench R23 is the successor of Cinebench R20 and is also based on the Cinema 4 Suite. Cinema 4 is a worldwide used software to create 3D forms. The single-core test only uses one CPU core, the amount of cores or hyperthreading ability doesn’t count.
Cinebench R23 (Multi-Core)
Cinebench R23 is the successor of Cinebench R20 and is also based on the Cinema 4 Suite. Cinema 4 is a worldwide used software to create 3D forms. The multi-core test involves all CPU cores and taks a big advantage of hyperthreading.
Cinebench R20 (Single-Core)
Cinebench R20 is the successor of Cinebench R15 and is also based on the Cinema 4 Suite. Cinema 4 is a worldwide used software to create 3D forms. The single-core test only uses one CPU core, the amount of cores or hyperthreading ability doesn’t count.
Cinebench R20 (Multi-Core)
Cinebench R20 is the successor of Cinebench R15 and is also based on the Cinema 4 Suite. Cinema 4 is a worldwide used software to create 3D forms. The multi-core test involves all CPU cores and taks a big advantage of hyperthreading.
Cinebench R15 (Single-Core)
Cinebench R15 is the successor of Cinebench 11.5 and is also based on the Cinema 4 Suite. Cinema 4 is a worldwide used software to create 3D forms. The single-core test only uses one CPU core, the amount of cores or hyperthreading ability doesn’t count.
Cinebench R15 (Multi-Core)
Cinebench R15 is the successor of Cinebench 11.5 and is also based on the Cinema 4 Suite. Cinema 4 is a worldwide used software to create 3D forms. The multi-core test involves all CPU cores and taks a big advantage of hyperthreading.
Geekbench 5, 64bit (Single-Core)
Geekbench 5 is a cross plattform benchmark that heavily uses the systems memory. A fast memory will push the result a lot. The single-core test only uses one CPU core, the amount of cores or hyperthreading ability doesn’t count.
Geekbench 5, 64bit (Multi-Core)
Geekbench 5 is a cross plattform benchmark that heavily uses the systems memory. A fast memory will push the result a lot. The multi-core test involves all CPU cores and taks a big advantage of hyperthreading.
iGPU — FP32 Performance (Single-precision GFLOPS)
The theoretical computing performance of the internal graphics unit of the processor with simple accuracy (32 bit) in GFLOPS. GFLOPS indicates how many billion floating point operations the iGPU can perform per second.
Estimated results for PassMark CPU Mark
Some of the CPUs listed below have been benchmarked by CPU-Comparison. However the majority of CPUs have not been tested and the results have been estimated by a CPU-Comparison’s secret proprietary formula. As such they do not accurately reflect the actual Passmark CPU mark values and are not endorsed by PassMark Software Pty Ltd.
Electric Usage Estimate
Average hours of use per day
Average CPU Utilization (0-100%)
Power cost, dollar per kWh
Electric Usage Estimate
Average hours of use per day
Average CPU Utilization (0-100%)
Power cost, dollar per kWh
| Intel Core i5-1035G1 | Intel Core i5-10210U | |
| 15 W | Max TDP | 15 W |
| NA | Power consumption per day (kWh) | NA |
| NA | Running cost per day | NA |
| NA | Power consumption per year (kWh) | NA |
| NA | Running cost per year | NA |
Popular Comparision
Comments
Intel Core i5-10210U VS Intel Core i5-1035g1: Comparison
Intel Core i5-10210U
Intel Core i5-1035g1 9000 9000
000 PASMARK and seek time when testing SSD performance.
Show all
6262
max 89379
Average: 6033.5
7447
max 89379
Average: 6033.5
Geekbench 5 (Multi-Core)
3086.005
max 23628.202
Average: 5219.2
max 23628.202
Average: 5219.2
Geekbench score 5
971.21
max 1600.56
Average: 936.8
max 1600.56
Average: 936.8
nine0005
3DMark06 score
6026
max 18628
Average: 3892. 6
6
max 18628
Average: 3892.6
Cinebench R11.5 /64bit (Multi-Core) test score
7.3875
max 45.3622
Average: 5.3
5.713
max 45.3622
Average: 5.3
Cinebench R15 test score (Multi-Core)
591
max 4614
Average: 638.4
579
max 4614
Average: 638.4
Cinebench R15 score (Single-Core)
156
max 276
Average: 128.5
161
max 276
Average: 128. 5
5
AES
Yes
Yes
Support for INTEL OPTANE
Yes
Yes
Technologies of thermal control
Yes
9000 9000
Function Execute Cancel Bit
Yes
Yes
Intel Trusted Execution Technology
No
No
Intel Boot Guard
Yes
Yes
Number of threads
The more threads, the faster the processor will be able to perform multiple tasks simultaneously.
Show all
8
max 256
Average: 10.7
8
max 256
Average: 10.7
L1 cache size
A large amount of L1 memory accelerates results in the CPU and system performance settings
Show all
256KB
max 4608
Average: 299. 3 KB
3 KB
320KB
max 4608
Average: 299.3 KB
L2 Cache Size
L2 cache with large scratchpad memory to increase processor speed and overall system performance.
Show all
1MB
max 512
Average: 4.5 MB
2MB
max 512
Average: 4.5 MB
L3 cache size
A large amount of L3 memory accelerates results in the CPU and system performance settings
Show all
6MB
max 768
Average: 16.3 MB
6MB
max 768
Average: 16. 3 MB
3 MB
Maximum Turbo Clock Speed
When the processor’s speed drops below its limit, it can jump to a higher clock speed to improve performance.
Show all
4.2GHz
max 5.5
Average: 3.2 GHz
3.6GHz
max 5.5
Average: 3.2 GHz
nine0005
Number of cores
four
max 72
Mean: 5.8
four
max 72
Mean: 5.8
Processor base clock speed
1.6GHz
max 4.7
Average: 2.5 GHz
1GHz
max 4. 7
7
Average: 2.5 GHz
Max. number of PCI Express lanes
sixteen
max 64
Average: 22.7
max 64
Average: 22.7
PCI Express configurations
1×4. 2×2. 1×2+2×1 and 4×1
N/A
Idle states
Yes
Yes
Turbo Boost technology
This increases its productivity (including when performing complex tasks)
Show all
2
Mean: 1.9
2
Mean: 1.9
Max. graphics system frequency
1.1GHz
max 1.55
Average: 1. 1 GHz
1 GHz
1.05GHz
max 1.55
Average: 1.1 GHz
Number of PCI-Express lanes
16
n/a
Max. number of processors in configuration
1
Mean: 1.3
1
Mean: 1.3
DDR version
four
Mean: 3.5
four
Mean: 3.5
Max. memory bandwidth
This is the speed at which the device stores or reads information. nine0005
45.8GB/s
max 352
Average: 41. 4 GB/s
58.3GB/s
max 352
Average: 41.4 GB/s
Memory frequency
RAM can be faster to improve system performance.
Show all
2666MHz
max 4800
Average: 2106.2 MHz
3733MHz
max 4800
Average: 2106.2 MHz
Max. number of memory channels
2
max 16
Mean: 2.9
2
max 16
Mean: 2.9
Max. memory size
The largest amount of RAM memory.
64 GB
max 6000
Average: 404.4 GB
64 GB
max 6000
Average: 404.4 GB
System bus frequency
Data between computer components and other devices is transferred via the bus.
Show all
4 GT/s
max 1600
Average: 156.1 GT/s
4 GT/s
max 1600
Average: 156.1 GT/s
nine0005
ECC memory support
Memory error recovery code is used when it is necessary to avoid data corruption during scientific computing or server startup. It finds possible errors and repairs data corruption.
Full text
No
No
Processor RAM
32GB
max 128
Average: 34.8 GB
GB
max 128
Average: 34.8 GB
Max. Resolution (DP)
4096 x [email Protected]
5120 x [email Protected]
VPRO
No
ENHANCED SPEEDSTEDP (EIST)
9000. OpenCL
4.5
max 4.6
Average: 4.1
4.6
max 4.6
Average: 4.1
Intel® AES-NI Commands
AES is needed to speed up encryption and decryption.
Yes
Yes
Hyper-Threading Technology
Many Intel processors use state-of-the-art hyper-threading technology. Thus, each processor core works simultaneously on two threads, which significantly increases performance. Most processors work on the principle: one thread per core, therefore, their performance is lower.
Show all
Yes
Yes
OpenGL
Later versions provide better game graphics
4.5
max 4.6
Mean: 4.4
4.5
max 4.6
Mean: 4.4
AVX
AVX allows you to increase the speed of calculations in multimedia, financial and scientific applications, it also improves the performance of Linux RAID.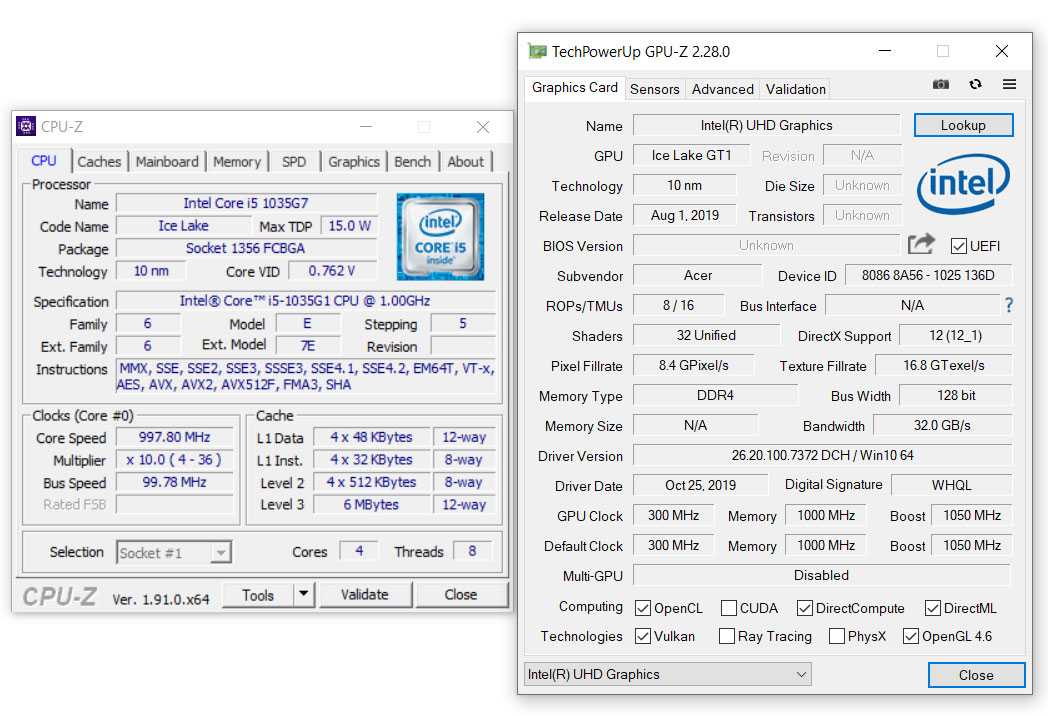
Show all
Yes
Yes
sse version
Allows you to speed up multimedia tasks (such as volume control). Each subsequent version has a number of improvements
Show all
4.2
max 4.2
Average: 4.1
4.2
max 4.2
Average: 4.1
4K support
You can view images in the highest quality
TSX
no
no
txt
is
no
is
is
Secure
Yes
yes
yes 9000 yes 9000 yes 9000 Yes
Yes
n.a.0002 OS Guard
Yes
Yes
Yes
Yes
VT-X
Yes
is
Virtualization technology AMD
is
No data
Quick Sync Video
Yes
Yes
Clear Video
Yes
No data
005
Clear Video HD
Yes
No data
EDP
is
There are
DisplayPort
DVI
Yes
N/A
Process
The small size of the semiconductor means it is a new generation chip. nine0005
14 nm
Average: 36.8 nm
10 nm
Average: 36.8 nm
Heat dissipation (TDP)
Heat dissipation requirement (TDP) is the maximum amount of energy that can be dissipated by the cooling system. The lower the TDP, the less power will be consumed.
Show all
15W
Average: 67.6W
15W
Average: 67.6W
PCI Express Edition
3
Mean: 2.9
3
Mean: 2.9
condition
Launched
Launched
Release date
01/01/2019
01. 07.2019
9000 46mm x 24mm
50mm x 25mm
Device ID
0x9B21/0x9B41/0x9BAC/0x9BCA/0x9BCC
0x8A56
300MHz
max 2400
Average: 535.8 MHz
300MHz
max 2400
Average: 535.8 MHz
Supports 64-bit system
A 64-bit system, unlike a 32-bit system, can support more than 4 GB of RAM. This increases productivity. It also allows you to run 64-bit applications.
Show all
Yes
Yes
DirectX
Used in demanding games, providing improved graphics
12
max 12.1
Average: 12
12
max 12. 1
1
Average: 12
Maximum processor temperature
Reset may occur if the maximum temperature at which the processor operates is exceeded.
Show all
100°C
max 110
Average value: 96 °C
100°C
max 110
Average value: 96 °C
OpenGL
Later versions provide better game graphics
4.5
max 4.6
Mean: 4.4
4.5
max 4.6
Mean: 4.4
Turbo GPU
If the speed of the GPU drops below its limit, then to improve performance, it can go to a high clock speed.