2nd-Gen Core i7 vs. 8th-Gen Core i7
Today we’re dusting off our old Sandy Bridge Core i7-2600K test system and pairing it up with a GTX 1080 Ti to see how well the seven-year-old processor holds up in the latest and greatest PC games compared to Intel’s new Core i7-8700K. We know that the 2600K still has some fight left in it, but next year could finally be time for those equipped with the aging quad-core to make their long-awaited upgrade.
By the end of 2018, the GTX 1080 Ti is likely to be ousted by an even faster flagship GPU and as a result mid-range GPUs are expected to be speedie as well, which is likely to require more processing power than the 2600K can provide.
For today’s testing we have almost a dozen titles on hand for benching the 2600K and we tested each game using three different quality presets. The focus will be on the 1080p resolution but we also have some 1440p results as well, though of course these are more GPU bound but many of you seem interested in those figures so I’ve included them.
Last month we tested the fourth-generation Core i7-4770K under the same test conditions and found it was still hanging in there remarkably well, even with the mighty GTX 1080 Ti.
Can Intel’s much older second-gen 2600K prove just as impressive? Let’s jump into the benchmarks to find out…
First up we have Ashes of the Singularity and out of the box the 2600K delivered a 69fps minimum and 77fps average, making it a little over 40% slower than the 8700K. Surprisingly, overclocking the 2600K to 4.8GHz only placed it on par with the stock 4770K and while it did allow for very playable performance it was still around 30% slower than the 8700K.
Increasing the visual quality settings with the extreme preset didn’t change much, here the 2600K was 28% slower than the 8700K, so it still trailed by a rather large margin.
Using the crazy preset we’re mostly GPU bound though out of the box the 2600K takes a beating for the average frame rate. Overclocked performance was boosted by 22% to 88fps and now the 2600K is only around 9% slower than the majority of the seventh and eighth-gen CPUs.
The finally the last Ashes of the Singularity test was conducted at 1440p and here the margins close up a little more but even once overclocked the 2600K was around 6% slower than the more modern Intel processors.
Next up we have Battlefield 1 and boy has the Core i7-2600K aged in this one, at least when using medium quality settings at 1080p with a mighty powerful graphics card. Under those conditions it looks pretty slow, but then it is seven years old now so that in mind it’s bloody impressive really. Anyway, here it was again, roughly 40% slower than the 8700K and even overclocked struggles to match the stock 4770K.
Increasing the visual quality settings with the high preset doesn’t change much, the 2600K is still almost 40% slower than the 8700K and once overclocked again falls just short of the stock 4770K which was the most surprising result for me.
Even with the ultra quality settings enabled, the 2600K still gets trampled — here it was 35% slower than the stock 8700K. With both CPUs overclocked the margin is reduced to 22% for the average though I should note the 8700K is GPU limited in this test. The 1% low result is a better indicator of true performance and here the 2600K was 34% slower.
It’s worth pointing out though that most GTX 1080 Ti owners probably aren’t interested in playing Battlefield 1 at such a low resolution — 1440p seems more appropriate. Here we’re even more GPU limited and as a result the 2600K was just 9% slower than the 8700K when comparing the average frame rate once both CPUs were overclocked. Of course it’s the 1% low that we should really focus on and in BF1 the 2600K was still 21% slower, which is certainly a noteworthy deficit.
Intel Core i7-2600k Review 2nd Generation Core Processor
Intel’s tick-tock clock work like release schedule has given its main rivals quiet a lot of headaches. Intel’s clock is running on time (mostly) and despite a scare (the p67 sata bug) or two its keeping time.
Earlier this year Intel unleashed a salvo of new processor based on a new(ish) architecture called the 2nd generation core architecture (nee: Sandy Bridge). This builds on the success of the core design and adds several desirable features, including a highly revamped graphics core.
A little later we will look at the performance characteristics of the current flagship processor, the Core i7 2600K.
What Has Changed With 2nd Generation Core Architecture (Read: What Will Matter To You)
Intel made several changes to the processor as well as the graphics core that makes these processors so blindingly fast. The numbers will speak for this. But to the end users the most important changes are:
- The processors naming convention
- The over-clocking specifics
- The motherboard compatibility
1 & 2. The Naming Convention & Over Clocking Specifics
All new Intel 2nd Generation core architecture based processors will use the following naming convention.
|
BRAND |
SERIES |
GENERATION |
MODEL |
MODIFIER |
|
INTEL CORE |
i3/i5/i7 |
2 |
xxx |
K/T/S |
|
INTEL CORE |
i7 |
2 |
600 |
K |
The last row shows how the processor to be reviewed today is named.
The ‘K’ series processors have an unlocked multiplier, just like the Extreme Edition processors or AMD black editions. This is important as for all of these processors; this is the only way to over-clock. By making the clock generator a part of the chipset (the x67), Intel has effectively locked all the bus speeds together. Changing the base clock will change the PCI and PCI-e clocks as well making things rather impossible to over-clock via this route. The only way to effectively over-clock is by changing the multiplier. And these are only unlocked on the K series of processors. Thankfully Intel is not charging a exuberant price premium for the “K” series.
A welcome side effect of this is that now the processor and memory clocks are independent of one another. Gone are the days of paying tons for high speed memory to run it synchronously with the processor (1:1 ratio for nerds!). Your processor might be after-burning at 5ghz, while your memory will cruise at a leisurely 1066mhz without breaking a sweat!
The “T” modifier is for 45 Watt TDP processors, while the “S” modifier is for 65 Watt TDP processors.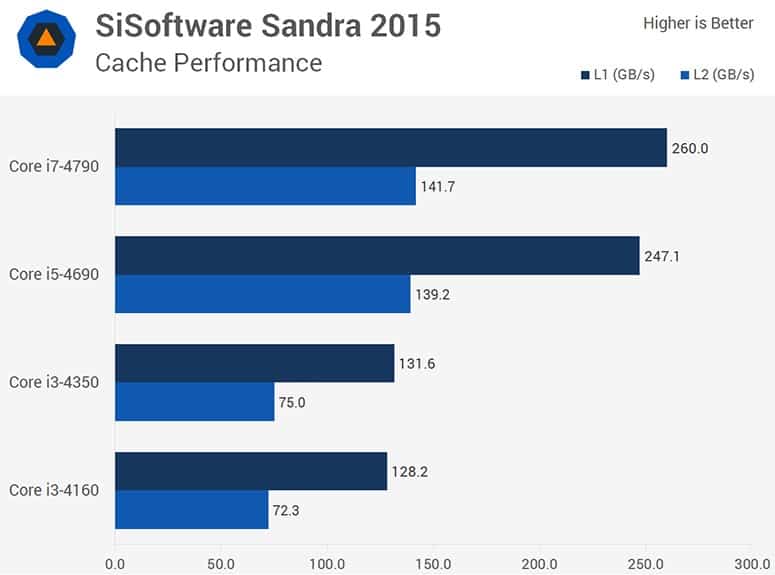 Neither the T or S series processors are available for sale right now.
Lastly processors that do not carry any modifiers are the standard multiplier locked variants of the “K” series.
Intel has also improved the turbo technology. The turbo works for processor as well as the graphics core and has the ability to work beyond the boundary set by the processor’s TDP.
3. Motherboard Compatibility
While AMD has given the AM2+ socket an extended life cycle, Intel seems to insist on a new socket for every new series of processors. Intel has changed no less than 3 sockets since the death of the venerable socket 775. Intel had the LGA 1366 socket for the Nehalem series, the LGA 1156 socket for the Clarksdale/ Lynnfield series. And now it has the LGA 1155 socket for the Sandy Bridge series of processors. And this is not the end of it! Intel will have a new LGA 2011 socket for the Sandy Bridge “E” editions processors (Extreme Editions). Intel might argue that their architecture change is so significant that it demands a socket redesign.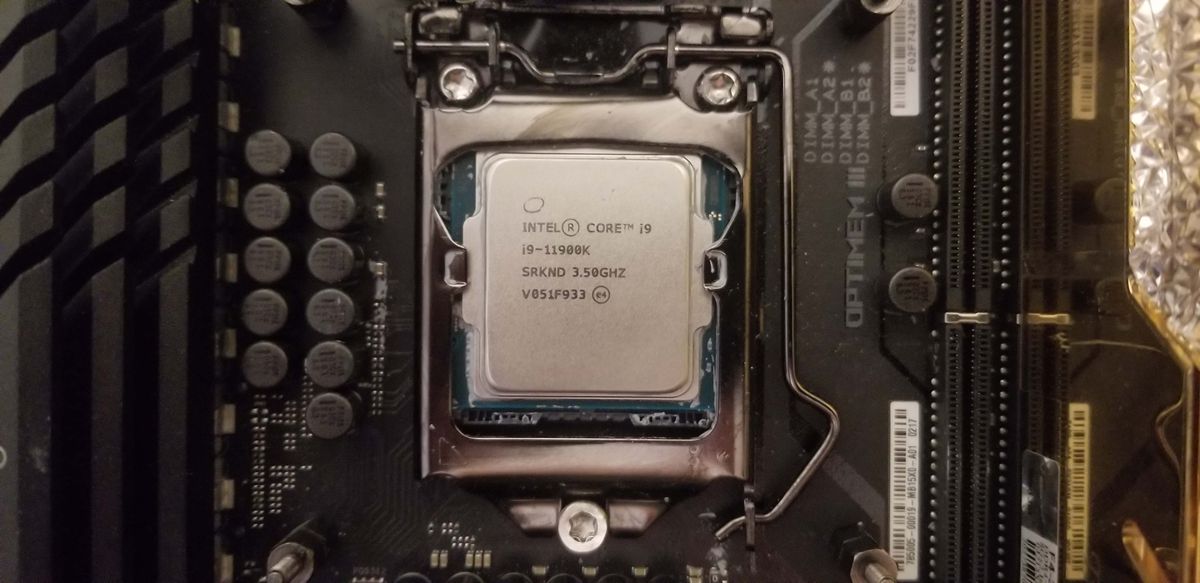
Under The Hood –Changes That Make Sand Bridge Scream Performance (Read: What Matters To Intel)
This is how these processors look from inside (ie: the die shot)
IMPROVEMENTS TO THE PROCESSOR CORE
1. The Micro-op cache: Instructions are stored in a special cache as they are decoded. When a new instruction is loaded on the processor, it first checks to see if it has decoded a similar instruction and uses it. This saves power and processing cycles.
2. Improved Branch prediction: Coupled with the micro-op cache is a redesigned branch prediction unit.
3. Reworked out of order execution unit: This allows Intel to save power and transistor for newer circuitry
4. AVX Instructions: Advanced Vector Extension instructions extend the SSE instruction set. It allows for faster image & audio manipulation
5. Ring Bus: This allows the L3 cache to be shared between the processor and graphics core.
6. Systems Agent: Those familiar with socket 1155 board might have seen a UEFI entry for something called ‘system agent’ voltage. System agent is the new name for everything that was called ‘uncore’ in the past. This included the memory controller, PCI-e lanes among other things. There are improvements to the memory controller that allows for better latencies as well as the power control circuitry of the processor. The systems agent also feature a full set of 16 lanes for PCI-e x16 slots, which can be split into x8,x8 for SLI or crossfire configurations.
7. Graphics Sub-system: For many of us the graphics sub-system will be a non-starter. It is not meant to play games with eye candy, heck even without eye candy. It is much better than the graphics core found in the Clarksdale processor, but nowhere near discrete video cards.
8. Media Engine: Tied to the graphics sub-system is the media engine. This helps in video transcoding, something akin to GPU transcoding that can be done using discrete video cards (from ati and Nvidia)
As you can see Intel has invented new terminologies to go along with its new architecture.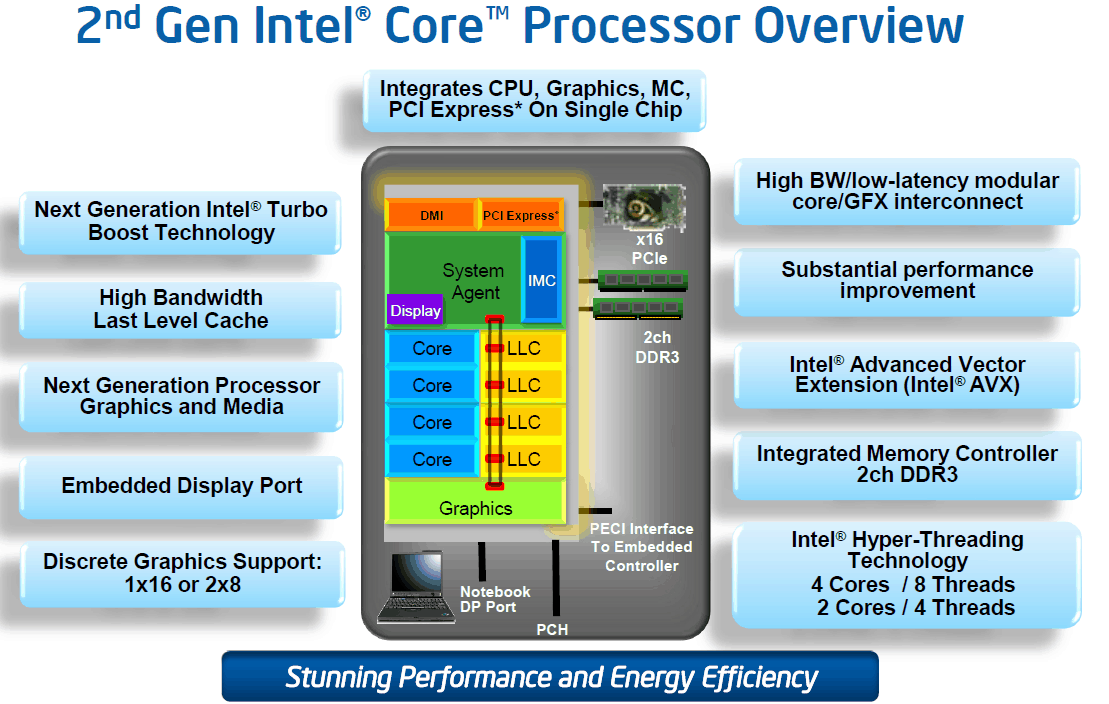 They definitely add to the processor’s prowess, but most of us are interested in how fast it will go, rather than what makes it go that fast!
This image summarizes what has been mentioned above.
The New Platform X67
Together with the new socket is a new chipset the x67. It comes in two broad flavors; the P67 and the H67. A Z67 variant will also appear. There is at least one other variant (the Q67), but these three will form the bulk of the shipping chipsets. Not to be outdone by locking the clock generator on the chipset, Intel also limits the over-clocking capabilities of these chipsets. As before only the ‘H’ (and this time the ‘Z’) series enable the use of onboard graphics!
|
CHIPSET |
PROCESSOR OC |
GRAPHICS OC |
|
P67 |
Yes |
No |
|
H67 |
No |
Yes |
|
Z68 |
Yes |
Yes |
Z68 is not out yet. Given the debacle with the x67 Sata bug (soon to be over), Z68 will probably be delayed a bit.
The Intel Core I7-2600k Processor
As promised, this is the new Intel processor.
The ‘confidential ‘moniker shows it’s an engineering sample (ES). The performance characteristics should be similar to shipping processors.
CPU-Z goodness.
Processor Specs
|
Speed (Turbo) |
3.4 ghz (3.8 ghz) |
|
Cores (Threads) |
4 (8) |
|
L3 Cache |
8 MB |
|
TDP |
95 Watts |
|
Graphics (Turbo) |
850 mhz (1. |
|
Price |
Rs. ~30,000 |
|
Speed (Turbo) |
3.4 ghz (3.8 ghz) |
 35 ghz)
Processor Testing
|
Processors |
Core i7-2600K Core i5-2500K Core i7-950 |
|
Boards |
Asus Sabertooth P67 (Core ix-2xx series) Asus Rampage II Gene (Core i7-950) |
|
Memory |
Corsair DDR3-1333mhz 2×4 GB. Total 8 GB Corsair DDR3-1333mhz 3×2 GB. Total 6 GB (950) |
|
Video |
Ati 6950-2GB |
|
Power Supply |
Corsair HX620 |
|
Cooler |
Stock! Cooler Master Hyper 212+ |
|
OS |
Windows 7 x64 |
Given that these processors are power efficient, a hyper 212+ should yield decent over-clocking results!
*NOTE: As the tests are done on a P series chipset board, the performance of the onboard GPU can’t be assessed. Its capabilities will be explored in a later article.
Testing Philosophy
Rather than boring you, the reader, with meaningless number, the results will shown as an improvement over an equally priced Intel high end processor available today i.e. Core i7-950. Its score in all tests will be taken as baseline 100%. Scores for both stock and over-clocked Core i5-2500K and Core i7-2600K are based relative to that 100%
Test Suite
|
Synthetic |
Sandra 2011, X264 Benchmark (HD V3), Cinebench, 3Dmark11 –Physics Test |
|
Real World |
7-Zip |
|
Gaming |
Far Cry 2,Crysis -Warhead |
Legend
|
Core i7-950 |
Baseline (100%) in all charts |
|
Core i5-2500K |
Default Clock (3. |
|
Core i5-2500K* |
Over-clocked (4.5 ghz) |
|
Core i7-2600K |
Default Clock (3.4 ghz) |
|
Core i7-2600K* |
Over-clocked (4.5 ghz) |
 3 ghz)
Synthetic Tests
Synthetic tests are designed to show off a processor’s (or for that matter any piece of computer hardware’s) prowess. New equipment usually does much better as it reflects architectural improvements. These numbers do not translate to as large real world performance gains simply because real world applications are bogged down by more than just the processor.
Sandra 2011
We at WCCF-Tech like Sandra. It has an extensive benchmarking suite which tests the processor as well as the memory sub-systems.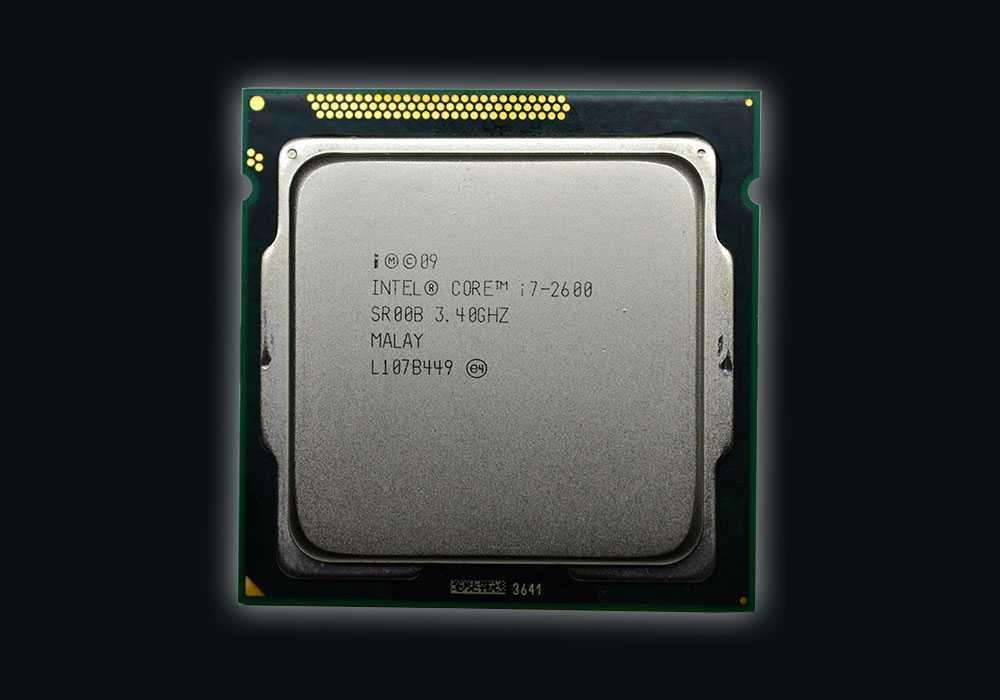 Prepared to be dazzled by a torrent of graphs which show how powerful the new processors are as compared to their predecessor.
The 2600K handily beats the 950, while the 2500 performs on par. Considering we have a 4 cores / 4 threads vs 4 cores / 8 threads battle royale, the 2500K does very, very well. Over clocked, both processors knock the 950 out of the ring!
X264 Benchmark Hd V3
This benchmark measures the encoding performance of the processor. It offers a standardized benchmark as the clip as well as the encoder used is uniform.
The 950 is pretty much caught napping. 2nd generation stock processors do much better, over-clocked they wipe the floor with 950’s silicon!
Cinebench R11.5 Cpu Test
Cinebench is based on Maxon’s Cinema 4D. It is used to compare graphics as well as processor performance. The CPU test uses all available processors to render a 3D scene.
Nothing to see here folk, more of the same. The 950 is only able to muster its 8 thread to the level of the 4 cores of a 2500k. Everything else has already crossed the finish line
3dmark11 Physics Test
This is the latest incarnation of one of the oldest graphics benchmarking suites. The latest incarnation supports directx 11. It has a physics test that emulates physics on the processor.
Running out of superlatives here. I’ll let the graph do the talking this time!
Gaming Tests
Games are what fast processors are all about. Well for most of us anyways. As games usually rely on the performance of the graphics card, high resolution testing is not an option. Gaming tests are run with low eye candy and using low(ish) resolutions.
|
Far Cry 2 |
1680×1050 |
|
Benchmark |
Inbuilt ‘Ranch Small’ CPU |
|
Rendering Path |
DX 9 –Medium |
Things do look more cramped here. The difference between stock and over-clocked processor is not as extensive as in synthetic tests. But still both 2nd generation core processors handily beat the 950. And that too in a game that is very multi core aware.
|
Crysis -Warhead |
1680×1050 |
|
Benchmark |
Customized |
|
Rendering Path |
DX 9; Physics Set to Enthusiast |
Again, games are not the best way to show off performance improvements as they are bogged down by graphics sub-systems. But even here the 950 is panting, trying hard to catch up to its newer brethren, but failing in the end!
Real World
Some might argue against using 7-zip’s compression and decompression benchmark as a ‘real world’ test. But if you try and think about it for a minute, the benchmark does show how fast the program will either compress or decompress, while negating the impact of disk transfers.
7 -Zip Compression
7 -Zip Decompresison
The 4C/ 8T 950 does better here, at least when compared to a stock 2500K.
Overclocking — Hello Uefi, Bye Bye Bios!
Gone are the days of tinkering with the base clock, memory dividers and arcane voltages. Intel has made over-clocking as easy as 1,2,3 (or A,B,C). Gone are the days of the good old BIOS (at least if you are using x67 Asus board; Gigabyte and Intel still continue to use the old BIOS, or BIOS like interface in the case of Intel).
As can be seen from the charts above, the 2600K was able to reach 4.5ghz on stock cooler, the same frequency that a 2500K was able to achieve.
Oh, UEFI stands for Unified Extensible Firmware Interface and is the fashionable replacement for the old Basic Input Output System (BIOS). On most incarnations (except Intel) it features a nice mouse driven interface.
The 2600K clocks to 4500ghz with its stock cooler with a bump to the core voltage.
The 2500K does the same, albeit with lower core voltage. The hyper-threading nature of the 2600K needs more juice to attain stability.
Overclocking On After Market Coolers
We coupled the Core i7-2600K to a Cooler Master Hyper 212+ (a cooler that can be had for as little as Rs. 2400/ US$ 30). We were able to achieve speeds of 4800GHz.
Conclusions
The performance gains seen here are reminiscent of those seen when Intel launched its core2 architecture with the core2 duo series of processors. The 2nd generation of core processors does things faster, while guzzling less energy. They run cooler and over-clock easier (the K series)
There are no reasons not to recommend either of these two processors. If you do a lot of image/ video manipulation the 2600K is a blessing. For those who want to game the 2500K offers amazing performance for an even more amazing price!
Review and test Intel Core i7-13700K.
 Comparison with Core i9-12900K, i7-12700K and R9 7900X — i2HARD
It’s time to talk about the new generation of Intel processors, let’s start with the i7-13700K. Let’s evaluate its performance in stock and overclocking, compare with the i7 and i9 of the previous generation, as well as with the Ryzen 9 7900X. Let’s touch on the issue of performance gains between generations at equal frequencies and test a little by turning off efficient cores and working with air cooling.
Contents:
- Consumption, heat dissipation and cooling
- Test bench
- Stock
- Synthetic tests
- Tests in games
- Test with disabled E-Cores
- Comparison at equal frequencies
- Acceleration
- Synthetic tests
- Tests in games
- Can an air cooler handle the Core i7-13700K?
- Conclusion
It seems that the changes in the 13th generation of processors are known to all those who are interested, but for the sake of completeness, it is worth touching on them at least in a nutshell. The most important thing is the increase in the frequency of cores and the amount of L2 cache from 1.25 MB to 2 MB for productive cores, and for a cluster of four efficient cores it is doubled — from 2 to 4 MB. Naturally, improvements are also announced in the logic of the cache and predictors. L3 cache size compared to the same layout of the previous generation 12900K has not increased — the 13700K still has the same 30 MB. There are other important changes, such as the lack of influence of effective cores on the maxima of the ring bus, hence the significant increase in its frequency, not to mention the increase in the number of effective cores.
Consumption, heat dissipation and cooling
Unless otherwise stated, we will cool the processors with a custom liquid cooling system. The air will be separate. So, activate XMP and get started.
In a single-threaded load, you can notice a flashing value of 5.4 GHz, without a monitoring program in the background, the test result and the frequency of one thread are on average higher, but without fixing the indicators, there is nothing to show.
In the long-suffering Aida64 test, we can note the high results of the first level cache, but here you need to keep in mind how these numbers are calculated. A little later, in comparison at equal frequencies, we will touch on these figures again, the L2 indicators are very interesting against the background of an increase in its volume, this cannot but affect the speed.
Test bench
The rivals to the hero of the video automatically suggest i7 and i9 of the previous generation, 12700K as the basis for calculating the increase in performance in the price segment, and 12900K as a starting point in comparing architectures, because, like the 13700K, it also has 8 productive and efficient cores. From the AMD camp, the rivals will be 7900X, firstly, because it is on hand right now, and secondly, price cuts will inevitably push it and 13700 into one basket. True, this is if we talk only about the price of the processor, with inexpensive motherboards for AM5, so far everything is not very good.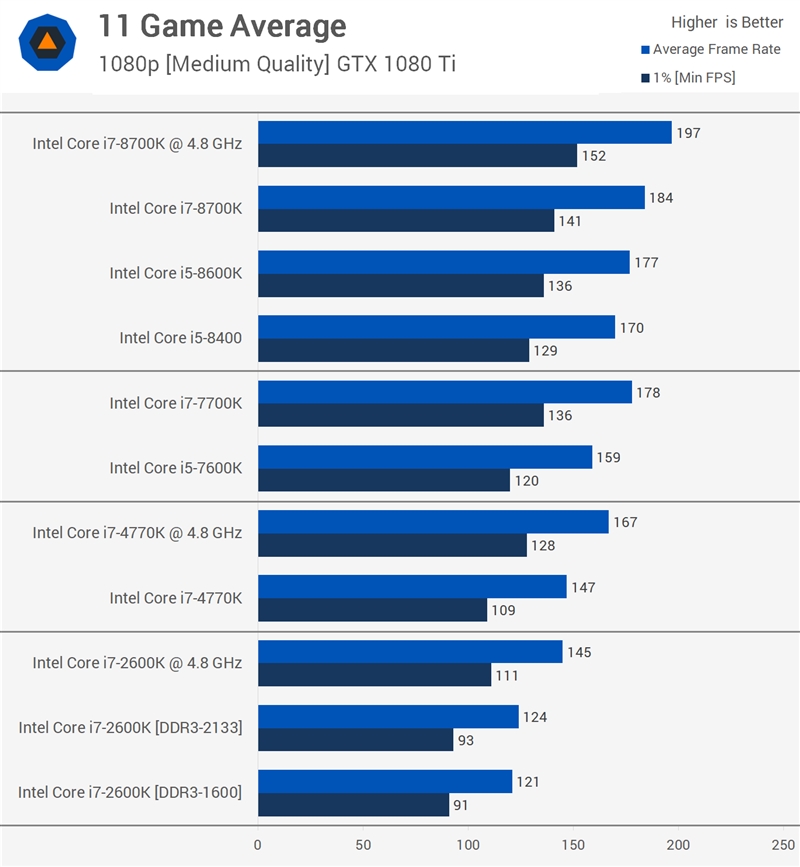
For all Intel processors we use the MSI Z690 Carbon motherboard, the GeForce RTX 409 will help to avoid the emphasis on the video card0. Operating system — Windows 11, core isolation for 7900X is disabled, its results will not noticeably differ from those obtained in the tenth version. The 5,000th ryzens didn’t make the list this time, but their results can be seen in the video about the 7900X.
- Processor #1: Intel Core i7-12700K
- Processor #2: Intel Core i9-12900K
- Processor #3: Intel Core i7-13700K
- Processor #4: AMD Ryzen 9 7900iga9: GeForce 900byteX
- General Features
- Performance
- Process
- Productivity in games
- Energy and temperature
- Availability
- Conclusion
- Technical characteristics Intel i7 11700k
- Intel Core i7
- cm.
 Also:
Also:
Graphics Card RTX 4090 Gaming OC900X is faster than the 12th generation, but the new frequencies of the Intel cores do not leave him a chance here.
In multithreading, the 13700K is also the first, 8 cores of different calibers from Intel turn out to be faster than 12 single-grade ones from AMD, it is curious that the operating frequency was similar for the 13700 and 7900, for P-cores, of course.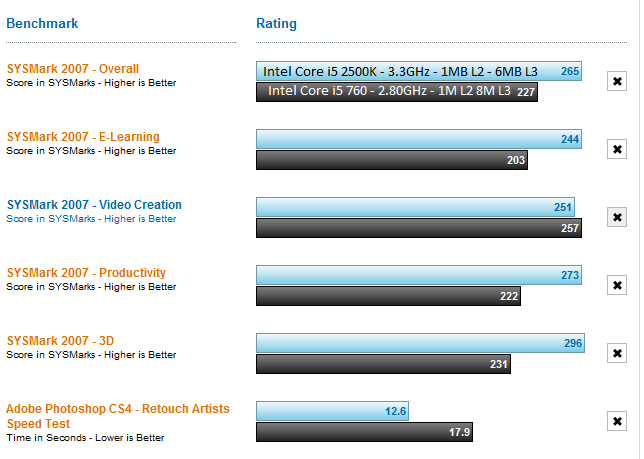 The advantage of 13700K over its direct predecessor reaches 35%.
CPU-Z single thread — a thing in itself, but extremely convenient for Intel processors, we can see the 13700K leading the way, in a multi-thread its result is close to that shown 7900X, but still a little better. The 12900K is underclocked and the 12700K is undercore.
In a no less subjective test — GeekBench 5 we see a multidirectional picture, on the one hand, the 13700K lags behind the 7900X in a single thread, on the other hand, it outperforms it in a multi-thread.
The Corona Benchmark render shows the closeness of the 13700K and 7900X compute capabilities. The increase in performance relative to 12700K for the new product has again exceeded 30%, which is impressive.
Tests in games
The first one will be Shadow of the Tomb Raider, 1080p, maximum preset without anti-aliasing and 20% scaling, only the third segment of the built-in test. Recall that we use exactly the maximum graphics settings in order to maintain the required load on the processor, while reducing the resolution as much as possible, which eliminates or minimizes the influence of the video card on the result. FPS with minimal settings in games is too strange an indicator, something like a single thread in CPU-Z, sometimes it’s interesting, but it’s at least strange to focus on it when choosing a processor, of course, if the conversation is not about eSports. Both fresh processors, 13700K and 7900X show excellent FPS, but the more difficult the scene, the greater the advantage of the i7, in the most difficult moments the 12900K catches up with the Ryzen.
For such powerful processors, the extreme grass and squad size in Troy no longer looks like an unbearable burden. Maximum preset, 1080p, scaling 50%. All the test subjects confidently exceed 100 average frames per second, but if the 12700K consumes about 130 W at the hottest moments, then the rest of the comparison participants do not restrain themselves, the boost automatics and the number of cores allow them to use more than 170 W. Interestingly, at similar consumption and higher voltage, the temperatures of the 13700K cores are lower than those of the 12900K, we will consider this fact separately later. In terms of FPS, the leader is again 13700K, the 7900X is inferior to 12900K.
Revisiting a true classic, StarCraft II, 1080p, max settings, replaying an intense battle at very fast speed. The 12th generation of Intel did an excellent job in this discipline, but the new ones are faster, and it is the 13700K that is ahead of everyone. Its advantage over the 12700K is comparable to that in Lara Croft, although additional cores also had an impact there, other microarchitecture improvements are also important.
A similar superiority of the new i7 over the old one can be measured in the CS:GO demo, the settings are close to eSports, everything is low except for anti-aliasing. By the end of the measurement, there is a 19% difference between 12700K and 13700K. On average FPS, the ryzen 7900X leads, but on 1% lower FPS, the 13700K will be better. Recall that we are talking about half a thousand frames per second on average.
Finished with the mandatory program, now a little closer to reality, fresher games, FarCry 6, ultra preset without HD textures, tracing enabled, resolution scale 0. 5. The 13700K has no competitors again, it is the fastest. advantage over 12900K went up to a double-digit percentage, 11-12 if more mundane, and again close to 20% over its direct predecessor.
In cyberpunk we use ultra ray tracing preset, DLSS performance. SMT patch was not applied. The latter may have played a decisive role, but such projects are also found, what to do. So, no one disputes the leadership of 13700K, but the advantage over 12700K has slightly decreased. Or to be more precise, the old i7 in this game feels more confident, the performance ratio between 12900K and 13700K are quite familiar.
Watch Dogs: Legion, 1080p, ultra preset, ultra tracing, DLSS in position performance. Another game with its own characteristics, in which the use of effective cores is minimized. In such conditions, the results of 12700K and 12900K are as close as possible. 13700K is still confidently ahead, its 8 cores are stronger than others from the comparison.
On average over seven games, we get a solid 13700K lead over its direct predecessor, an impressive 18% on average and a little more in rare and very rare events. Interestingly, another comparison 13700K is noticeably ahead and 7900X, and 12900K, which can be effectively supplemented by the fact that it is cheaper than both of these processors at the recommended and actual price.
Test with disabled E-Cores
Now let’s deal with one interesting point, comments often ask to compare or test the performance of new processors with disabled efficient cores. Not that the numbers in AIDA64 are important, but since there is a picture, I want to show it. The total throughput of the caches of the first level has naturally decreased, there are fewer cores, and with L2 everything is not so simple, the values have grown for some reason, you can easily attribute all this to the miracles of Aida, but at the same time there is something in it. L3 cache access latency has been reduced. Now with the baggage of this knowledge we go to benchmarks.
The loss of half of the cores, even if not productive ones, will in any case significantly affect multi-threaded performance, and CPU-Z with Cinebench R23 unanimously report about a 30% decrease in results.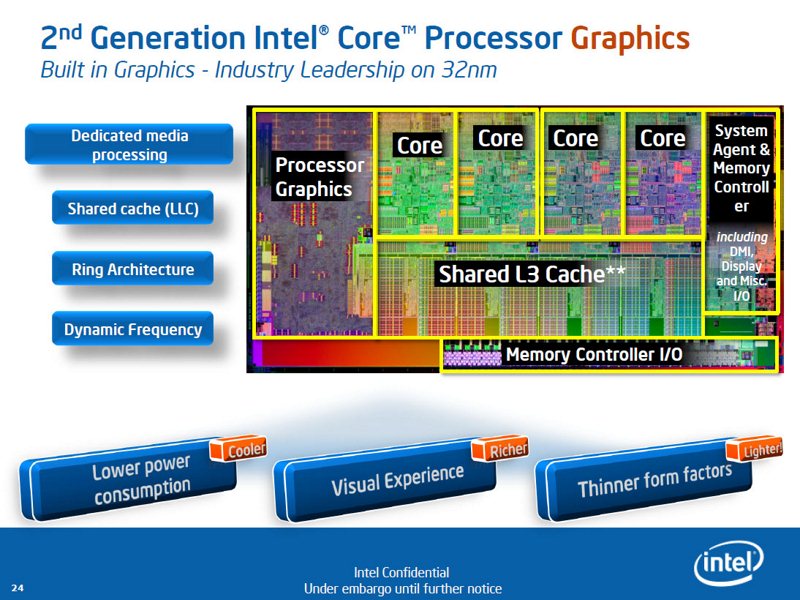
Geekbench uses its own formulas, and the effect of effective cores in the overall score is estimated at 25%.
Other than the numbers themselves, the fact that multithreading performance is slowing down is not surprising. The behavior in a single thread is interesting, and here geekbench does not fail, the result is the same as in the initial state of the processor.
However, CPU-Z and Cinebench unanimously note a decrease in performance of the performance core.
Let’s turn to games, launch cyberpunk, and… there is a difference, but not the one we were expecting, with efficient cores disabled, we got not only a slight decrease in power consumption, but also a less desirable decrease in FPS, about 4% in their average number and a little more for other measured values.
As an experiment, let’s check in Watch Dogs, where these e-cores were not used anyway. However, even here we are waiting for a performance degradation, yes, not as noticeable as in cyberpunk, but it is.
We can conclude that the 13th generation of Intel processors in Windows 11 loses performance when effective cores are disabled, at least in the tested benchmarks and games. Of course, you can find a problem or game in which the absence of e-cores can be useful, but in the general case this is clearly not worth doing. On the other hand, the moment with disabling Hyper-threading without changing the configuration of the cores remained unexplored, this option may be more promising, we will test it somehow.
Comparison at equal frequencies
And now let’s find out the magnitude of the performance increase without the influence of frequencies, for this, in the 13700K and its twin in terms of the number of productive and efficient cores 12900K, we will fix the frequencies of these same cores and the ring bus, at values of 5, 4 and 4.4 GHz, respectively . In addition, the LLC level and voltage will also be set manually, so it will be possible to compare the core temperatures in similar conditions.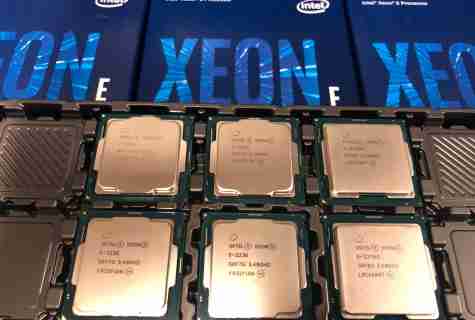
Let’s run through three benchmarks, CPU-Z, Geekbench 5 and Cinebench R23, and in the latter we will measure temperatures under equal conditions. We get that 13700K is somewhere 5-7 degrees colder than 12900K at the same applied voltage and identical cooling with power consumption over 200W.
What can be said here? It looks like Intel did not deceive, the lion’s share of the increase is the frequency of the cores. at least in single threaded results the difference is homeopathic.
In multi-threaded scores, it is possible to scrape together 1-2% of the differences, but this is not very impressive either. It is clear that such tasks do not allow the improvements in the cache and the prediction mechanism to fully unfold, so let’s turn to the tasks and games that are specialized for the gaming processor.
Cyberpunk shows that there is an increase, and it is more than 1%, to be more precise — up to 4% in average FPS and 8-9% in rare and very rare events. It can be noted that the temperature difference in games almost disappears.
Let’s take StarCraft II as the second game, and here, surprisingly, the advantage of 13700K in average FPS is higher than in cyberpunk, up to 8%. And 1 and 0.1%, on the contrary, grow from generational change not so successfully.
Overclocking
The thesis about the dominance of the frequency is confirmed, now it’s time to start overclocking, we will develop the strengths, so to speak. Judging all the processors by one instance would be completely wrong, but our, perhaps not the most successful 13700K, feels pretty confident in Cinebench and AVX stress tests at 5600 and 4500 MHz for productive and efficient cores, respectively, with LLC5 and a voltage of 1.32 In the BIOS. The ring bus was fixed at a frequency of 5 GHz.
At the same time, to increase the frequency of P-cores by another 100 MHz, it is required to add 60-80 mV of voltage, which puts a rather productive liquid cooling system in an awkward position — short runs of LinX warm up the cores to almost 100 degrees, and an increase in room temperature by a couple of degrees already can lead to instability.
The
ring bus also requires a lot of voltage for those last 100-200 MHz. For example, 4900 MHz on our processor requires about 40-50 mV less in LinX, but prime95 will still be an impossible task.
If we limit ourselves to 5600 MHz on high-performance cores and do not raise the ring above 4900, then at a voltage of 1.3 V or a little less in the BIOS, you can meet the 300 W package in short IinX tests, while core temperatures will be quite tolerable.
We will still focus on the first values announced — 5000 MHz on the ring bus and 5600 MHz for P-cores. The memory on this motherboard seems to be close to its limit, but the coveted less than 50 ns in Aida64 is still achieved.
For 12900K and 12700K, it was not possible to obtain the same memory frequencies, even some kind of sequence lined up with an eye to the success of memory controllers, 12900K worked with DDR5 at 6666 MHz, and i7 mastered only 6600. At the same time, in terms of productive cores and the ring bus, their capabilities turned out to be very close.
Ryzen 7900X overclocking is unchanged from its solo video, Curve Optimized, memory at 6200 MHz.
Synthetic benchmarks
Let’s start by comparing scores in Cinebench R23. The 13700K’s lead just got stronger, 7900X, a fixed overclock is clearly needed here to maintain competition.
In a single stream, we can note the equality of rivals 13700K, however, a solid lead of the new product is also striking.
In Geekbench, the 13700K catches up with the 7900X in the single-stream standings and confidently leads in the multi-stream.
In CPU-Z, the leadership of the 13700K is also unshakable, records of single-threaded scores prevent processors from showing monitoring running in the background.
Corona Benchmark Notes 13700K and 79 Computing Comparison00X.
Tests in games
Now you can work on gaming performance.
Lara Croft with such productive processors shows FPS close to eSports. Overclocking and memory tuning gave all processors 15 percent or more performance gains. Even in the most difficult moments, the frame counter of the 13700K does not drop below 240. The 12900K and 7900X are close on the market, but due to the faster single thread, ryzen outperforms the old i9 in average FPS. The final advantage of 13700K over 12700K was about 14% in this game.
In three times the increase in FPS is a bit more modest, but also very noticeable. At a similar level of power consumption, the 7900X lags behind the 13700K by about 9%. Please note that the temperatures of 12700K are higher than they could be, because due to inattention, the cooling system worked in passive mode when recording its results in overclocking. The 12900K plays well past 200W in its league, but still ends up being faster than the Ryzen. The advantage of 13700K over 12700K was 22% in average FPS, and even more in rare events.
In StarCraft, all Intels added 18% on average, so the ratio between them did not change, but this allowed the 12900K to catch up with the 7900X. Between i7 different generations again almost 19% difference.
CS:GO shows a smaller increase in average FPS from overclocking cores and memory settings. However, the difference in this indicator between the 13700K and 7900X is shrinking, and the i7 is still the best by 1 and 0.1%. The 12900K failed to pass the important mark of 500 average FPS and is apparently not suitable for serious cyberathletes.
In FarCry 6, 12700K gained the most, reducing the 13700K’s significant lead to a noticeable but much less impressive 11%. We can say that in this game all the processors performed very close in terms of results, all except the 13700K, which is the leader.
Cyberpunk without the SMT patch reacted favorably to overclocking, especially for Intel’s 12th generation processors. However, this did not allow any of them to seriously claim leadership. The 13700K is still the best here, although its advantage over its direct predecessor in the face of the 12700K is again only 11% in terms of the average number of frames prepared per second.
Watch Dogs shows solidary FPS growth in overclocking — 14-15% for all test participants, which is why the performance breakdown in a relative sense has not changed. 13700K first, 8 cores 12700K and 12900K at the same frequency show the same result in this game.
Counting over seven games, the 13700K outperforms the 12700K by 15% in average FPS, and in rare and very rare events, it has a bit more advantage. The 7900X and 12900K are pretty close in performance and lag the new i7 by about 10% in overclocking. The numbers aren’t as impressive as some individual benchmarks, but the 13700K’s main selling point is the same recommended price as its predecessor. In addition, you can use already commercially available motherboards, among which there are very successful mid-budget options.
If we add to this a little, but still lower processor heating in equal conditions compared to the 12th generation, it turns out that the 13700K can be safely recommended for enthusiasts if the 13900K for some reason seems excessive or too expensive. Here the question of temperatures is worth touching again. Can an air cooler handle the 13700K?
Can an air cooler handle the Core i7-13700K?
Naturally, we cannot give a universal answer for any body, but we can take measurements in an open test bench.
Let’s take not the most expensive DeepCool AS500, room temperature is 22-23 degrees. We activate only XMP, the rest is in auto. We’ll check the cooler in two modes — 950 rpm, which is the limit of conditional noiselessness in the case, and full 1150 rpm.
In quiet mode, you can easily pass a multi-threaded Cinebench once, which is quite a good result for more than 250 W of power consumption. But prolonged testing inevitably leads to temperature throttling. Still worthy, we lose 100 MHz on some cores, but we continue to render at 100 degrees.
At full speed, the situation is similar, only throttling will start a little later. It doesn’t matter, we always have the opportunity to limit the heat pack of the processor and fit it into the required framework, in addition, this particular processor in this particular motherboard easily tolerates a voltage offset of up to 100 mV without loss of performance.
In games, the difference with custom liquid cooling is also noticeable, but if your house is not hot, and the case is well ventilated, then there will be no problems even in full auto, without offsets.
The idea seems crazy, but what if you try to disperse under the air? Slightly reduce the frequency of the ring and the voltage. A miracle won’t happen, but neither will a tragedy, in the air such settings are simply not available, there is no stability.
We reduce the frequencies of the cores, release the ring in the car, anyway, in games it is not so important, we lower the voltage a little and try.
In silent mode, the cooler handles overclocking by a few degrees better than with a stock processor. Of course, this is not quite a victory, in long-term testing, even on an open bench, there will be temperature throttling, at first rare and at 100 MHz, then constant and the frequency reduction will be more noticeable, but it still works.
Let’s do the same test at full speed, which the AS500 is quite modest, and the noise is still acceptable for use in the case. We regained a few degrees in a single run, and in long-term testing we get much less noticeable throttling, HWinfo cannot even fix it for a long time.
In games, the situation will also be tolerable if you can cope with the additional heat from the video card.
The victory is not unconditional, but the test shows the theoretical possibility of using the 13700K with no loss or with a slight loss of performance in air-cooled conditions.
Conclusion
In general, everything has been said and shown throughout the material. It remains only to ask the most important question: can the 13700K be considered a candidate for the role of the king of games?
Maybe, but we’ll look at the 13600K next time and find out.
Intel Core i7-11700K Powerful Processor with Intel AI Integration
Index
9000 A Intel Intel Intel Intel Intel Intel Intel Intel Intel Intel . With the new Rocket Lake-C architecture, the company says they offer 19% more performance than the previous generation of processors. OUR showlab had the opportunity to test Intel Core i7-11700K of this new line and you check our review now.
General features
OVERVIEW: Intel Core i7-11700K is a powerful processor with Intel AI integration
From the new architecture, the eleventh generation Intel processors have an AI integration called Intel Deep Learning Acceleration, which uses machine-assisted learning (machine learning) to provide a smoother experience in games and other processing-intensive tasks, as well as improve efficiency and performance in normal daily workflows. They also have a new 10nm lithograph, which allows for a frequency jump of the models compared to previous models.
In general, the eleventh generation also received improvements in support for PCIe 4.0 connections and support for up to 20 SSD slots and video inputs, as well as support for features resizable panel, making CPU performance more stable, especially in games, by speeding up communication between GPU and CPU. It is also important to note that the Intel Core i7-11700K processor is more of an 11th generation processor with 8 cores.
Performance
In the test showmark , use together with processor Intel core i7- 11700K motherboard B560m pro-vdh, finally, 8GB RAM Nvidia TX card, Coolermaster2 DDR4, Coolermaster TX DDR4 graphics card, Coolermaster20 3060. installation .
process
Overall, the speed of Intel Core i7-11700K is great for everyday tasks, render 4K video in about 400 seconds, open iTunes and sync library in less than 80 seconds and render basic 3D objects in mixer in less than 20 seconds.
Benchmark Intel i7 11700K on CPU-Z
However, what is most surprising and somewhat negative at first is how performance degrades in single process situations. thread do Intel i7 11700K loses out to its competitor from AMD, Ryzen 7 5800X , in many benchmarks like Cinebrench score. Usually the architecture of Intel processors creates situations where the processing in one thread is used, makes it one of the best on the market, and this was the standard even in the ninth generation. With the architecture change, Intel processors were generally outperformed by AMD variants.
Now, for the first time in many years, the result of processing in one thread is worse than AMD competitor. All in all, it won’t matter much to regular users, but it will still be a great choice for those looking for a fast processor, but for users who want the most powerful machines in the i7 class, this should be considered.
gaming performance
Without a doubt Intel Core i7-11700 A great choice for a gaming PC. In games like Monster Hunter World e Fortnite , performance with RTX 3060 is fantastic, helps to go from 60FPS even without using DLSS from GPU.
Rendering also benefits from the processor: textures or levels were never loaded, but always executed as fast as possible. Compared to the Ryzen 7 5800X , although in terms of overall performance in benchmarks, the opponent’s processor heats up less and consumes less power, in FPS, the new chip from Intel has its own victories.
energy and temperature
During testing, Intel i7 11700K at maximum performance it did not exceed 80 degrees, which is a good temperature, although the eleventh generation i9 reaches lower temperatures. Curious, since both processors have the same architecture and the same number of cores.
In terms of power consumption, it has the same watts as the i7 of previous generations, 125W . All in all, this is a balanced use of the processor, capable of delivering good performance.
Availability
The Intel Core i7-11700 is available from some of the largest retailers in the country for around R$2.799.
Conclusion
O The Intel Core i7-11700 is a good and functional processor for a variety of powerful PC functions, from everyday functions to gaming, and can be safely used in high-performance computers. Its benchmarks are excellent, its temperatures stay good during use, even under peak loads, and it uses the best current Intel processor technologies.
However, you need to keep in mind that there are processors in the same price range that perform better for the same functions, such as the Ryzen 7 5800X , which comes out at around £2.