How to Stress Test Your CPU in Linux
(Image credit: Future)
A key matrix for determining the vitality of a Linux distro, or the hardware that it runs on, is system performance. Depending on your purpose, you can choose from a variety of dedicated tools to monitor the different components such as CPU frequency, temperature and memory utilisation. But if you favour the CLI, like us, you’ll rather enjoy working with S-TUI.
With S-TUI, which is an acronym for Stress-Terminal UI, you can simultaneously monitor CPU temperature, frequency, power and utilisation. The utility presents all the information graphically and can even be used to export the data into CSV files. Better still, you can configure S-TUI to automatically launch scripts when the values of any of the components being monitored breaches the defined threshold values. When coupled with stress, another command-line utility, S-TUI can also be used to stress-test your system.
Installing S-TUI
Although S-TUI isn’t available in the software repositories of most popular desktop distributions, installing the tool is fairly straightforward, and the project’s GitHub page describes various installation techniques. For our install we shall use Ubuntu 21.04.
1. In the terminal, Update the available software repositories and install the Python 3 packaging tool.
$ sudo apt update
$ sudo apt install python3-pip
2. Install S-TUI using pip3.
$ sudo pip install s-tui
3. Run S-TUI.
$ s-tui
Unlike many other command-line utilities, S-TUI requires no configuration and you can begin using it immediately after installation.
Using S-TUI
At the top of the sidebar on the left are the details about your CPU. Our Lenovo test machine was correctly identified as running an Intel Core i3-5005U CPU @ 2.00GHz processor. This is because S-TUI utilises various other native tools and utilities to gather the relevant information. For instance, the same information and far more details can be ascertained from running the cat /proc/cpuinfo command.
When you first launch S-TUI, it displays all four parameters – Frequency, Utilization,Temperature and Power – and refreshes the data for each every two seconds.
(Image credit: Future)
To change the refresh rate from two seconds to 0.1, change the value of Refresh[s]:2.0 on the sidebar to 0.1, note that this will put extra strain on your Pi.
Use the up and down arrow keys to navigate the sidebar, but S-TUI also supports the use of H and J to scroll, much like you would in Vim. S-TUI will also work with mouse input.
Using S-TUI to Stress Test Your Machine
By default, S-TUI is configured to only monitor your system. To push our machine to its limits we installed “stress” a stress testing terminal tool. Stress works with all types of CPUs, we use it to stress test Raspberry Pis as part of the stressberry Python benchmarking tool.
1. To install stress, open a terminal and enter the following.
$ sudo apt install stress
2. Open S-TUI.
$ s-tui
3. Using the arrow keys, navigate to Stress and press the spacebar. Alternatively you can also use the mouse to select. You will see the CPU graphs rapidly update, showing the current processor temperature, frequency and utilization. The stress test will run indefinitely.
(Image credit: Future)
4. Turn off the stress test by navigating to Monitor and pressing the spacebar, or by clicking with your mouse.
5. To set a time limited stress test, navigate / click on Stress Options and change the Time out to your desired time (in seconds). Set the Sqrt() worker count to match the number of cores for your CPU. Click Save when done.
(Image credit: Future)
6. Click on / navigate to Stress and press spacebar to run the timed test. Here we set the duration to be 30 seconds, and left the worker count at 4.
(Image credit: Future)
Saving Your Test Results
The collected data is lost as soon as you exit S-TUI, because the tool doesn’t save it by default.
To automatically save the collected information to a timestamped CSV file when you exit S-TUI, invoke the command as so.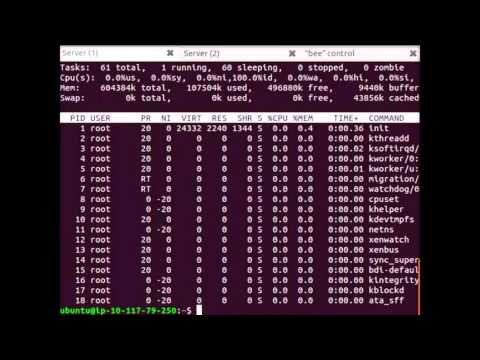
$ s-tui -c
To specify your own file name, invoke the command with a “—csv-file” provide a filename.
$ s-tui --csv-file <name of file>.csv
If you prefer your data in a JSON format, then we can output the data in JSON format, but only the current status, not a running log.
$ s-tui -j
(Image credit: Future)
Shashank Sharma is a freelance writer for Tom’s Hardware US, where he writes about his triumphs and joys of working with the Linux CLI.
Topics
Linux
Operating Systems
How to Impose High CPU Load and Stress Test on Linux Using ‘Stress-ng’ Tool
As a System Administrator, you may want to examine and monitor the status of your Linux systems when they are under stress of high load. This can be a good way for System Administrators and Programmers to:
- fine tune activities on a system.
- monitor operating system kernel interfaces.

- test your Linux hardware components such as CPU, memory, disk devices and many others to observe their performance under stress.
- measure different power consuming loads on a system.
Linux CPU Load Stress Test with Stress-ng Tool
In this guide, we shall look at two important tools, stress and stress-ng for stress testing under your Linux systems.
1. stress – is a workload generator tool designed to subject your system to a configurable measure of CPU, memory, I/O and disk stress.
2. stress-ng – is an updated version of the stress workload generator tool which tests your system for following features:
- CPU compute
- drive stress
- I/O syncs
- Pipe I/O
- cache thrashing
- VM stress
- socket stressing
- process creation and termination
- context switching properties
Though these tools are good for examining your system, they should not just be used by any system user.
Important: It is highly recommended that you use these tools with root user privileges, because they can stress your Linux machine so fast and to avoid certain system errors on poorly designed hardware.
How to Install ‘stress’ Tool in Linux
To install stress tool on Debian and its derivatives such Ubuntu and Mint, run the following command.
$ sudo apt-get install stress
To install stress on a RHEL/CentOS and Fedora Linux, you need to turn on EPEL repository and then type the following yum command to install the same:
# yum install stress
The general syntax for using stress is:
$ sudo stress option argument
Some options that you can use with stress.
- To spawn N workers spinning on sqrt() function, use the –cpu N option as follows.

- To spawn N workers spinning on sync() function, use the –io N option as follows.
- To spawn N workers spinning on malloc()/free() functions, use the –vm N option.
- To allocate memory per vm worker, use the –vm-bytes N option.
- Instead of freeing and reallocating memory resources, you can redirty memory by using the –vm-keep option.
- Set sleep to N seconds before freeing memory by using the –vm-hang N option.
- To spawn N workers spinning on write()/unlink() functions, use the –hdd N option.
- You can set a timeout after N seconds by using the –timeout N option.
- Set a wait factor of N microseconds before any work starts by using the –backoff N option as follows.
- To show more detailed information when running stress, use the -v option.

- Use –help to view help for using stress or view the manpage.
How Do I use stress on Linux systems?
1. To examine effect of the command every time you run it, first run the uptime command and note down the load average.
Next, run the stress command to spawn 8 workers spinning on sqrt() with a timeout of 20 seconds. After running stress, again run the uptime command and compare the load average.
[email protected] ~ $ uptime
[email protected] ~ $ sudo stress --cpu  8 --timeout 20
[email protected] ~ $ uptime
Sample Output
[email protected] ~ $ uptime 17:20:00 up 7:51, 2 users, load average: 1.91, 2.16, 1.93 [<-- Watch Load Average] [email protected] ~ $ sudo stress --cpu 8 --timeout 20 stress: info: [17246] dispatching hogs: 8 cpu, 0 io, 0 vm, 0 hdd stress: info: [17246] successful run completed in 21s [email protected] ~ $ uptime 17:20:24 up 7:51, 2 users, load average: 5.14, 2.88, 2.17 [<-- Watch Load Average]
2. To spawn 8 workers spinning on sqrt() with a timeout of 30 seconds, showing detailed information about the operation, run this command:
[email protected] ~ $ uptime
[email protected] ~ $ sudo stress --cpu 8 -v --timeout 30s
[email protected] ~ $ uptime
Sample Output
[email protected] ~ $ uptime 17:27:25 up 7:58, 2 users, load average: 1.40, 1.90, 1.98 [<-- Watch Load Average] [email protected] ~ $ sudo stress --cpu 8 -v --timeout 30s stress: info: [17353] dispatching hogs: 8 cpu, 0 io, 0 vm, 0 hdd stress: dbug: [17353] using backoff sleep of 24000us stress: dbug: [17353] setting timeout to 30s stress: dbug: [17353] --> hogcpu worker 8 [17354] forked stress: dbug: [17353] using backoff sleep of 21000us stress: dbug: [17353] setting timeout to 30s stress: dbug: [17353] --> hogcpu worker 7 [17355] forked stress: dbug: [17353] using backoff sleep of 18000us stress: dbug: [17353] setting timeout to 30s stress: dbug: [17353] --> hogcpu worker 6 [17356] forked stress: dbug: [17353] using backoff sleep of 15000us stress: dbug: [17353] setting timeout to 30s stress: dbug: [17353] --> hogcpu worker 5 [17357] forked stress: dbug: [17353] using backoff sleep of 12000us stress: dbug: [17353] setting timeout to 30s stress: dbug: [17353] --> hogcpu worker 4 [17358] forked stress: dbug: [17353] using backoff sleep of 9000us stress: dbug: [17353] setting timeout to 30s stress: dbug: [17353] --> hogcpu worker 3 [17359] forked stress: dbug: [17353] using backoff sleep of 6000us stress: dbug: [17353] setting timeout to 30s stress: dbug: [17353] --> hogcpu worker 2 [17360] forked stress: dbug: [17353] using backoff sleep of 3000us stress: dbug: [17353] setting timeout to 30s stress: dbug: [17353] --> hogcpu worker 1 [17361] forked stress: dbug: [17353] [email protected] ~ $ uptime 17:27:59 up 7:59, 2 users, load average: 5.41, 2.82, 2.28 [<-- Watch Load Average]
3. To spwan one worker of malloc() and free() functions with a timeout of 60 seconds, run the following command.
[email protected] ~ $ uptime
[email protected] ~ $ sudo stress --vm 1 --timeout 60s
[email protected] ~ $ uptime
Sample Output
[email protected] ~ $ uptime 17:34:07 up 8:05, 2 users, load average: 1.54, 2.04, 2.11 [<-- Watch Load Average] [email protected] ~ $ sudo stress --vm 1 --timeout 60s stress: info: [17420] dispatching hogs: 0 cpu, 0 io, 1 vm, 0 hdd stress: info: [17420] successful run completed in 60s [email protected] ~ $ uptime 17:35:20 up 8:06, 2 users, load average: 2.45, 2.24, 2.17 [<-- Watch Load Average]
4. To spwan 4 workers spinning on sqrt(), 2 workers spwaning on sync(), 2 workers on malloc()/free(), with a time out of 20 seconds and allocate a memory of 256MB per vm worker, run this command below.
[email protected] ~ $ uptime
[email protected] ~ $ sudo stress --cpu 4 --io 3 --vm 2 --vm-bytes 256M --timeout 20s
[email protected] ~ $ uptime
Sample Output
[email protected] ~ $ uptime 17:40:33 up 8:12, 2 users, load average: 1.68, 1.84, 2.02 [<-- Watch Load Average] [email protected] ~ $ sudo stress --cpu 4 --io 3 --vm 2 --vm-bytes 256M --timeout 20s stress: info: [17501] dispatching hogs: 4 cpu, 3 io, 2 vm, 0 hdd stress: info: [17501] successful run completed in 20s [email protected] ~ $ uptime 17:40:58 up 8:12, 2 users, load average: 4.63, 2.54, 2.24 [<-- Watch Load Average]
Pages: 1 2
If you liked this article, then do subscribe to email alerts for Linux tutorials. If you have any questions or doubts? do ask for help in the comments section.
TecMint is the fastest growing and most trusted community site for any kind of Linux Articles, Guides and Books on the web. Millions of people visit TecMint! to search or browse the thousands of published articles available FREELY to all.
If you like what you are reading, please consider buying us a coffee ( or 2 ) as a token of appreciation.
We are thankful for your never ending support.
Stress testing of systems in Linux — the stress-ng utility
To organize and conduct load stress testing in Linux systems, there is a utility stress-ng . Using it, it is easy to generate a real workload for the subsystems under test and, accordingly, evaluate its capabilities. The utility, traditionally for Linux, provides a command line interface for operation. However, this in no way makes it uncomfortable. She copes with her tasks perfectly. This article provides instructions covering the basics of stress-ng for some of the most common situations in stress testing Linux-based systems.
Content
- The main features and capabilities of the Stress-H
- STRESS-H
- Main options Stress-NG
- Testing processor
- Testing Disstem
- to run several instances of each stress test, use the —all N option, where N is the required number of instances;
- to set a timeout, i.e. the duration of the stress test, use the —timeout option.
- Power utilization of two CPU cores (40%+70%)
- Monitor the load of individual CPU cores
- Utilization of 100% of the power of one or more CPU cores
- Other bundles of simple commands to boot the CPU
- We load the processor at 100% using pbzip2
- Stress — Comprehensive Stress Test Package PC
- Finally
- «dd if/dev/urandom» — will load one core by about 40%;
- «bzip2 -9» — will load the second core by about 70%.
- green color — the amount of processor resources allocated for processes with normal priority;
- red — CPU resources allocated to processes with kernel priority.
- We continuously read something from somewhere and redirect to /dev/null;
- Performing endless data analysis by some program or utility.
900 9009 9000 9000 9000 9000 9000 9000 9000 9000 9000 9000 9000 9000 9000 9000 9000 9000 9000 9000 9000 9000 9000 9000 9000 9002 features and capabilities of stress-ng
The possibilities that the stress-ng utility has are quite wide. This is evidenced by the huge number of various options that the developers have endowed it with.
But the key feature of stress-ng is that it is a complete tool with built-in tests. Unlike many other analogues, when executing a test, no calls are made to third-party and/or external resources. Thus, stress-ng is absolutely self-sufficient. In almost any Linux distribution, it is available in the standard repository and is installed using the distribution’s package management system (PMS). For example, on Ubuntu:
$ sudo apt-get install stress-ng
Among other things, stress-ng includes very high-quality tests for testing processors, which together allow the most complete generation of the load on the CPU, using methods such as integer and floating point, bit operations, complex calculations, etc.
stress-ng syntax
As already noted, stress-ng has such a huge set of options that in this article it is more expedient to focus only on the main ones, which allow you to test all the main subsystems: CPU, virtual memory, and disk subsystem.
The stress-ng syntax is quite simple:
stress-ng [OPTION [ARG]] . . .
Specifies a specific method for testing virtual memory. By default, all tests available for this category are executed sequentially one after another. See the official man stress-ng command for details.
—vm-method m Specifies a specific method for testing virtual memory. By default, all tests available for this category are executed sequentially one after another. See the official man stress-ng command for details.
Basic stress-ng options
The table below shows the main options of the utility
| Option | Meaning |
| —class name | Specifies the type of test. The name is specified, for example, cpu, memory, vm, io and others. |
| -metrics | Specifies that statistics of the main metrics that reflect the behavior of the system during the test should be displayed at the end of the test. |
| -metrics-brief | Same as —metrics, but prints non-zero metrics. |
| —cpu-method method | Sets the load generation method for the processor. By default, all tests available for this category are executed sequentially one after another. You can learn more about this option by running man stress-ng. By default, all tests available for this category are executed sequentially one after another. You can learn more about this option by running man stress-ng. |
| -cpu N | Runs N stressors for each processor thread for a processor stress test. |
| —cpu-ops N | Specifies the number of bogo operations to stop the CPU test after. |
| -hdd-ops N | Specifies the number of bogo operations to stop the hard drive test. |
| —hdd-bytes N | Writes N bytes for each hard disk process. The default is 1 GB. |
| -vm N | Runs N stressors for the virtual memory stress test. |
| —vm-bytes N | Allocates N bytes for each memory process. The default is 256 MB. The amount can also be specified as a percentage of the total amount of virtual memory in the system. Values can be specified in bytes, kilobytes, megabytes, and gigabytes using the b, k, m, and g suffixes, respectively. |
| -sequential N | Specifies N number of threads to run tests, if N is not specified or equal to 0, then the number of threads is equal to the number of processors. |
For convenience and quick compilation of the necessary tests, it is also recommended to use some auxiliary options, for example:
Testing the processor
For the vast majority of situations, a classic example of a stress test can be a test run by the following command:
$ stress-ng --cpu 16 --cpu-method matrixprod --metrics --timeout 60
This test uses 16 threads to test a 16 thread processor. The output of the results can be as follows:
Naturally, the number of threads should be set in accordance with the specification of the processor used.
Testing the disk subsystem
To stress test storage devices such as hard drives, you can start with a low-level I/O test
$ stress-ng --sequential 0 --class io --timeout 60s --metrics-brief
The output of the command would be: hdd 5 —hdd-ops 100000
In this case, 5 hard disk stressors will be started and stopped after 100,000 bogo operations.
During testing, you can watch the download with the iostat command
Memory test
To conduct a memory stress test, use the command
$ stress-ng --sequential 0 --class memory --timeout 60s --metrics-brief
After the end, we will get the result of a test approximately as follows
Complex testing
If you need to conduct complex stress testing, you can use several main subsystems together with one command:
$ stress-ng --cpu 4 --io 4 --vm 1 --vm-bytes 1G --timeout 60s - -metrics-brief
This command will run a CPU test with 8 threads, a virtual memory test with one gigabyte of data placed in it, and 4 stressors for testing I/O operations.
To start testing the entire hardware, use the command
$ stress-ng --sequential 0 --timeout 60s --metrics-brief
This command will run all tests. After execution, the result will be printed to the console. While executing the command, it is better not to touch the computer
Conclusion
In conclusion, it is worth noting once again that the stress-ng utility is very versatile in its capabilities and allows you to qualitatively test any system. The above examples cover the most common Linux load testing scenarios. For specific or more complex tests, it is recommended to refer to the official manual for using the utility, available from the man stress-ng command.
If you find an error, please highlight the text and press Ctrl+Enter .
CPU stress test in Linux, how to load all microprocessor cores
Sometimes it becomes necessary to perform a partial or full load of the microprocessor on a personal computer or server. This may be needed to stress test the system, to check the stability of operation, to evaluate the efficiency of the cooling system, and to measure the power consumed by a computer or server under load.
The article presents constructions from simple and always available console commands in GNU Linux, which can load one or all processor cores. Also consider a compact but very powerful stress testing package for Linux, which can be installed with a single command. Everything is detailed and with examples!
Contents:
Power utilization of two CPU cores (40%+70%)
An experienced user of the GNU Linux operating system (OS) has repeatedly encountered cases where a simple command with a small error could load the microprocessor to the very eyeballs. We will use this, only we will have everything thought out and for a specific purpose.
First, consider a rather interesting bunch of two separate commands connected via a pipeline (the «|» character, I/O redirection).
dd if=/dev/urandom | bzip2 -9 > /dev/null
Its essence: read random data from the file «/dev/urandom» using the ‘dd’ utility, through the pipeline «|» transfer these read data to the «bzip2» archiver program, specify the maximum compression level (9) and output the data to the «black hole», that is, to nowhere — there is a special file «/dev/null» for this.
Thus, while the command is running (you can interrupt it by pressing CTRL+C), the archiver will compress a continuous stream of random data and send the result to an eternally empty file. Nothing is written to the physical disks and file systems, and the processor has a lot of work to do.
This bunch of commands will load two CPU cores (Central Processor Unit) in this way:
To load additional microprocessor cores, you need to open additional terminal windows and run several clones of this command.
Monitoring the load of individual CPU cores
For convenient monitoring of the load on each of the microprocessor cores, you can use the «System Monitor» program, which is part of the KDE working environment. A program with similar functionality and the same name exists in the GNOME environment.
Fig. 1. Monitor the loading of two CPU cores in GNU Linux using System Monitor from KDE.
The figure shows the result of loading two cores with a bunch of two commands that were discussed above. One core — orange chart (70%), the other core — yellow chart (40%).
The «htop» utility, which should be familiar to almost every system administrator, does an excellent job with the same task, only in the console. If you do not have it installed, then you can fix the situation with the command:
sudo apt-get install htop
To launch this console resource monitor, use the command of the same name:
htop
Below is an example of how this console resource monitor works, two kernels are loaded with the same bunch of dd and bzip2 commands.
Fig. 2. Monitoring the load of two CPU cores in GNU Linux using HTOP.
What do the red and green marks in the progress bars for CPU cores mean in HTOP? — everything is as easy as shelling pears:
I wrote about how to find out the frequency of the installed microprocessor(s), core operating modes and other useful information in one of my previous articles about the CPU in GNU Linux.
Utilizing 100% of the power of one or more CPU cores
For this purpose, you can use commands that process a continuous stream of data at a very high speed, without periodic load fluctuations, as is the case with bzip.
Say «yes» to the microprocessor…only so many times!
yes > /dev/null
It looks like a simple and harmless command, but it will load one CPU core by about 100% and without jumps. The essence of this construction is simple: print the word «yes» an infinite number of times and redirect the output to the «black hole» — /dev/null.
Fig. 3. We load one CPU core by 100% with the yes command in GNU Linux.
Other bundles of simple commands for loading the CPU
The «yes» command example is the easiest and most affordable way to load one or more CPU cores.
In addition, you can experiment with other commands and programs that are available by default in almost every distribution of GNU Linux.
The essence of building such bundles of commands is as follows:
The following bundle allows you to load one core to the ceiling:
cat /dev/zero > /dev/null
4. We load one CPU core to the maximum by 100% with the cat command in GNU Linux.
The essence of the command: using the command «cat» we output an endless stream of data from the pseudo-device «/dev/zero» (generates zeros, 000) into the void «/dev/null»;
As you can see, the process is running with a high priority (OS kernel priority) and requires all the processing power of one processor core to complete.
The «dd» program can be used to read data from a pseudo device file.
dd if=/dev/urandom of=/dev/null
The essence of the command: using the program «dd» (if — input file, of — output file) we read a stream of random data from /dev/urandom and send them to «nowhere» — /dev/null.
The result of monitoring the loading of cores in HTOP will be the same as in Figure 4.
Now let’s load the processor by calculating the checksum of an infinite file with zeros:
sha1sum /dev/zero
In htop we can see the same thing in figure 3, although the load density will be more stable.
We load the CPU calculating the MD5 sum of an endless stream of random data:
md5sum /dev/urandom
The load schedule will be identical to that in Figure 4, the microprocessor is loaded by a process that works at the OS kernel level, very high priority.
We load the processor to 100% using pbzip2
At the beginning of the article, an example was presented with bzip2, which separately can load one microprocessor core. There is also a multi-threaded implementation of this archiver — pbzip2.
You can install pbzip2 with the command:
apt-get install pbzip2
To load all available processor resources, just run the following command:
cat /dev/zero | pbzip2 -c > /dev/null
You can use «/dev/urandom» instead of the «/dev/zero» stream source, or build an even simpler construct:
yes | pbzip2 -c > /dev/null
Stress — a package of comprehensive PC stress tests
I have already written about the use of the «stress» utility in GNU Linux in an article on self-repairing a PC. There it was used in conjunction with other programs to get such a load stress set like AIDA64 under Windows.
This program can load all available CPU cores at once or specify exactly how many cores should work hard. To install the ‘stress’ package, just run the command:
sudo apt-get install stress
So, we run the program with instructions to load 4 microprocessor cores:
stress --cpu 4
The performance results are shown below.
Fig. 5. We load all CPU cores to the maximum at 100% with the stress command in GNU Linux.
Fig. 6. We look at the result of the stress program in htop.
In conclusion
As you can see, loading a single processor core or several cores even without installing special software in GNU Linux is a very real task. Everyone can choose a bunch of commands that are easy to remember and use. In addition, you can build such bundles knowing the principle of their work on your own literally on the fly.