Intel Pentium N4200 vs Intel Pentium G2030 Benchmarks, Specs, Performance Comparison and Differences
|
|
|
|
|
Intel Pentium N4200 vs Intel Pentium G2030
Note: Commissions may be earned from the links above.
This page contains references to products from one or more of our advertisers. We may receive compensation when you click on links to those products. For an explanation of our advertising policy, please visit this page.
Specification comparison:
| Processor | Intel Pentium N4200 | Intel Pentium G2030 | ||||||
| Market (main) | Entry-level notebook | Desktop | ||||||
| ISA | x86-64 (64 bit) | x86-64 (64 bit) | ||||||
| Microarchitecture | Goldmont | Ivy Bridge | ||||||
| Core name | Apollo Lake | Ivy Bridge | ||||||
| Family | Pentium 4000 | Pentium 2000 | ||||||
| Part number(s), S-Spec |
FH8066802979703, |
BX80637G2030, |
||||||
| Release date | Q3 2016 | Q2 2013 | ||||||
| Lithography | 14 nm | 22 nm | ||||||
| Transistors | — | 634. 000.000 000.000 |
||||||
| Cores | 4 | 2 | ||||||
| Threads | 4 | 2 | ||||||
| Base frequency | 1,1 GHz | 3,0 GHz | ||||||
| Turbo frequency | 2,5 GHz | — | ||||||
| High performance cores |
— |
2 Cores 2 Threads @ 3,0 GHz |
||||||
| Cache memory | 2 MB | 3 MB | ||||||
| Max memory capacity | 8 GB | 32 GB | ||||||
| Memory types |
DDR4/LPDDR4 |
DDR3 1333/1600 |
||||||
| Max # of memory channels | 2 | 2 | ||||||
| Max memory bandwidth | 38,4 GB/s | 21 GB/s | ||||||
| Max PCIe lanes | 6 | 16 | ||||||
| TDP | 6 W | 55 W | ||||||
| Suggested PSU | — | 600W ATX Power Supply | ||||||
| GPU integrated graphics | Intel HD Graphics 505 | Intel HD Graphics (Ivy Bridge) | ||||||
| GPU execution units | 18 | 6 | ||||||
| GPU shading units | 144 | 48 | ||||||
| GPU base clock | 200 MHz | 650 MHz | ||||||
| GPU boost clock | 750 MHz | 1050 MHz | ||||||
| GPU FP32 floating point | 230,4 GFLOPS | 100,8 GFLOPS | ||||||
| Socket | BGA1296 | LGA1155 | ||||||
| Compatible motherboard | — | Socket LGA 1155 Motherboard | ||||||
| Maximum temperature | 105°C | 105°C | ||||||
| Security |
— |
Execute Disable Bit |
||||||
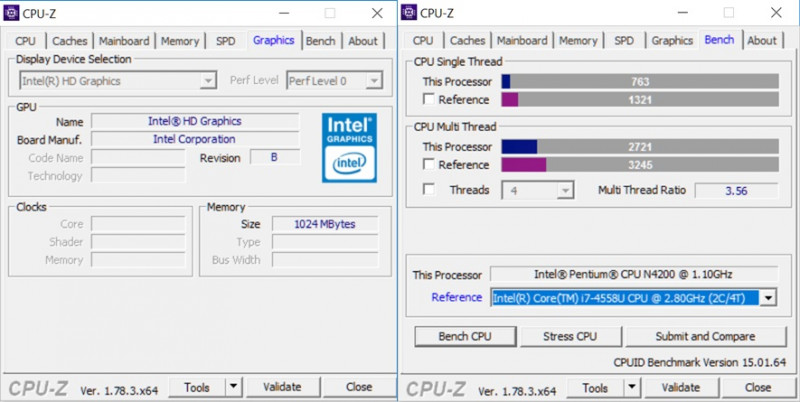
| CPU-Z single thread | 171 | 288 | ||||||
| CPU-Z multi thread | 713 | 571 | ||||||
| Cinebench R15 single thread | 50 | 107 | ||||||
| Cinebench R15 multi-thread | 160 | 201 | ||||||
| Cinebench R20 single thread | 110 | 238 | ||||||
| Cinebench R20 multi-thread | 370 | 466 | ||||||
| PassMark single thread | 840 | 1. 604 604 |
||||||
| PassMark CPU Mark | 2.133 | 1.693 | ||||||
| (Windows) Geekbench 4 single core |
1.498 | 2.613 | ||||||
| (Windows) Geekbench 4 multi-core |
4.160 | 4.333 | ||||||
| (Windows) Geekbench 5 single core |
327 | 570 | ||||||
| (Windows) Geekbench 5 multi-core |
1.034 | 1.014 | ||||||
| (SGEMM) GFLOPS performance |
32,8 GFLOPS | 32,5 GFLOPS | ||||||
| (Multi-core / watt performance) Performance / watt ratio |
693 pts / W | 79 pts / W | ||||||
| Amazon | ||||||||
| eBay |
Note: Commissions may be earned from the links above.
Suggested PSU: We assume that we have An ATX computer case, a high end graphics card, 16GB RAM, a 512GB SSD, a 1TB HDD hard drive, a Blu-Ray drive. We will have to rely on a more powerful power supply if we want to have several graphics cards, several monitors, more memory, etc.
Price: For technical reasons, we cannot currently display a price less than 24 hours, or a real-time price. This is why we prefer for the moment not to show a price. You should refer to the respective online stores for the latest price, as well as availability.
The processor Intel Pentium N4200 has more cores, the turbo frequency of Intel Pentium G2030 is bigger, that the PDT of Intel Pentium N4200 is lower. The Intel Pentium N4200 was designed earlier.
Performance comparison with the benchmarks:
Performance comparison between the two processors, for this we consider the results generated on benchmark software such as Geekbench.
| CPU-Z — Multi-thread & single thread score | |
|---|---|
| Intel Pentium N4200 |
171 713 |
| Intel Pentium G2030 |
288 571 |
In single core, the difference is -41%. In multi-core, the differential gap is 25%.
Note: Commissions may be earned from the links above. These scores are only an
average of the performances got with these processors, you may get different results.
| Cinebench R15 — Multi-thread & single thread score | |
|---|---|
| Intel Pentium G2030 |
107 201 |
| Intel Pentium N4200 |
50 160 |
In single core, the difference is 114%. In multi-core, the difference in terms of gap is 26%.
Note: Commissions may be earned from the links above. These scores are only an
average of the performances got with these processors, you may get different results.
| Cinebench R20 — Multi-thread & single thread score | |
|---|---|
| Intel Pentium G2030 |
238 466 |
| Intel Pentium N4200 |
110 370 |
In single core, the difference is 116%. In multi-core, the difference in terms of gap is 26%.
Note: Commissions may be earned from the links above. These scores are only an
average of the performances got with these processors, you may get different results.
| PassMark — CPU Mark & single thread | |
|---|---|
| Intel Pentium N4200 |
840 2.133 |
| Intel Pentium G2030 |
1.604 1.693 |
In single core, the difference is -48%. In multi-core, the differential gap is 26%.
Note: Commissions may be earned from the links above.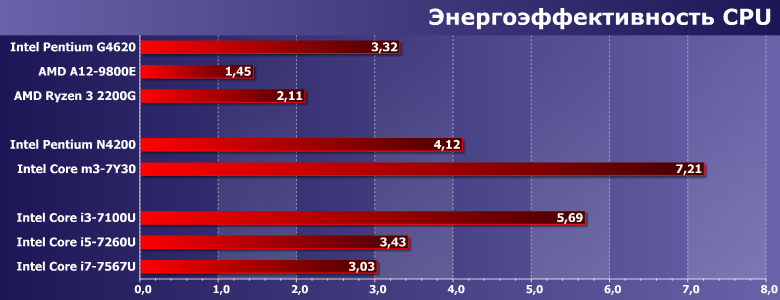 These scores are only an
average of the performances got with these processors, you may get different results.
On Windows:
| Geekbench 4 — Multi-core & single core score — Windows | |
|---|---|
| Intel Pentium G2030 |
2.613 4.333 |
| Intel Pentium N4200 |
1.498 4.160 |
In single core, the difference is 74%. In multi-core, the difference in terms of gap is 4%.
On Linux:
| Geekbench 4 — Multi-core & single core score — Linux | |
|---|---|
| Intel Pentium G2030 |
2.  860 8604.358 |
| Intel Pentium N4200 |
1.505 3.880 |
In single core, the difference is 90%. In multi-core, the difference in terms of gap is 12%.
Note: Commissions may be earned from the links above. These scores are only an
average of the performances got with these processors, you may get different results.
On Windows:
| Geekbench 5 — Multi-core & single core score — Windows | |
|---|---|
| Intel Pentium N4200 |
327 1.  034 034 |
| Intel Pentium G2030 |
570 1.014 |
In single core, the difference is -43%. In multi-core, the differential gap is 2%.
On Linux:
| Geekbench 5 — Multi-core & single core score — Linux | |
|---|---|
| Intel Pentium G2030 |
614 1.086 |
| Intel Pentium N4200 |
359 1.051 |
In single core, the difference is 71%. In multi-core, the difference in terms of gap is 3%.
On Android:
| Geekbench 5 — Multi-core & single core score — Android | |
|---|---|
| Intel Pentium N4200 |
357 1.246 |
| Intel Pentium G2030 |
492 796 |
In single core, the difference is -27%. In multi-core, the differential gap is 57%.
Note: Commissions may be earned from the links above. These scores are only an
average of the performances got with these processors, you may get different results.
Equivalence:
Intel Pentium N4200 AMD equivalentIntel Pentium G2030 AMD equivalent
CPU-Z Benchmark for Intel Pentium N4200 (1T)
Best CPU performance — 64-bit — July 2023
Intel Pentium N4200 (1T)
Back to validation
Intel Core i7-7700K
Intel Core i7-6700K
Intel Core i5-6600K
Intel Core i7-4790K
Intel Core i7-6850K
Intel Core i5-4690K
Intel Core i7-6900K
Intel Core i7-6800K
Intel Core i7-6950X
Intel Core i7-5930K
Intel Core i5-6600
Intel Core i7-4770K
Intel Core i7-6700
Intel Core i5-4670K
Intel Core i3-6100
Intel Pentium G3258
Intel Core i7-5820K
Intel Core i7-3770K
Intel Xeon E3-1230 v5
Intel Core i5-3570K
Intel Core i7-4790
Intel Core i7-4930K
Intel Core i7-4820K
Intel Core i5-4690
Intel Core i7-7500U
Intel Core i7-4770
Intel Core i5-6500
Intel Pentium G4400
Intel Core i5-4670
Intel Core i7-5960X
Intel Core i3-4170
Intel Core i7-3770
Intel Xeon E3-1231 v3
Intel Core i7-6820HK
Intel Core i5-4590
Intel Core i3-4160
Intel Core i5-3570
Intel Core i5-6400
Intel Xeon E3-1230 v3
Intel Core i5-2500K
Intel Core i5-4570
Intel Core i7-2700K
Intel Core i5-3550
Intel Core i3-4150
Intel Core i7-2600K
Intel Xeon E3-1230 V2
Intel Core i7-4720HQ
Intel Core i7-3960X
Intel Core i3-4130
Intel Core i5-3470
Intel Core i7-3820
Intel Core i5-7200U
Intel Pentium G3260
Intel Core i5-2550K
Intel Core i7-6700HQ
Intel Core i7-4710HQ
Intel Core i5-4460
Intel Core i7-4710MQ
Intel Core i5-4210H
Intel Core i5-3450
Intel Core i7-3930K
Intel Core i7-3520M
Intel Core i5-4200H
Intel Core i7-4700MQ
Intel Core i7-4700HQ
Intel Core i3-3240
Intel Core i5-4440
Intel Core i7-6500U
Intel Core i7 X 990
Intel Core i5-4430
Intel Core i3-3220
Intel Core i5-6300HQ
Intel Core i5-6300U
Intel Core i7-3630QM
Intel Core i5-3350P
AMD FX -9590
Intel Core i7-2600
Intel Core i5-4210M
Intel Pentium G3220
Intel Core i7-4702MQ
Intel Core i7-5500U
Intel Core i7-3610QM
Intel Core i7 X 980
Intel Core i5-3330
Intel Core i5-3320M
Intel Core i5-2500
Intel Xeon W3690
AMD FX -9370
Intel Pentium G2030
Intel Core i7-4510U
Intel Core i5-6200U
Intel Core i7-3632QM
Intel Core i5-3230M
Intel Core i5-4200M
AMD FX-8370
Intel Pentium G2020
Intel Core i7-3612QM
AMD FX -4350
Intel Core i5-2400
Intel Core i5-3210M
AMD FX -8350
AMD A10-6800K
AMD A10-7890K
Intel Xeon X5675
Intel Xeon X5470
Intel Xeon E5-2683 v3
AMD Athlon X4 880K
AMD FX-8370E
Intel Core i3-2120
Intel Xeon X5670
Intel Core i7-2620M
AMD FX -6350
Intel Core i5-4300U
Intel Core i7 870
Intel Core i5-2320
Intel Core i7 960
Intel Core i5-5200U
AMD Athlon X4 845
AMD A8-6600K
AMD A10-5800K
Intel Core i5-2540M
Intel Xeon E5-2670
AMD A6-6400K
AMD FX -8320
Intel Core i5 760
AMD Athlon X4 870K
AMD A10-7870K
Intel Core i5-2310
AMD Athlon X4 760K
Intel Core i7 950
AMD FX -8300
AMD FX -4300
AMD FX -6300
AMD Athlon X4 860K
AMD FX-8320E
Intel Core i3-2100
AMD A10-7850K
Intel Core i5 650
Intel Core 2 Duo E8600
Intel Xeon X5460
Intel Core i5-2520M
Intel Core i5-2300
Intel Core i7 860
Intel Core i3-6100U
AMD Athlon X4 750K
AMD A10-7860K
AMD A6-5400K
AMD A8-5600K
Intel Core i5 750
Intel Core i3 550
Intel Core i7-2670QM
Intel Core 2 Duo E8500
Intel Xeon E5450
AMD A10-7700K
AMD A10-7800
Intel Core i5-3337U
Intel Core i7 930
Intel Core i5-2430M
Intel Core i3 540
Intel Core 2 Quad Q9650
Intel Core i5 M 560
Intel Xeon X5650
AMD A8-7600
Intel Xeon X5450
Intel Core i5-2450M
Intel Xeon X3440
AMD A8-7650K
Pentium E5700
Intel Core 2 Duo E8400
Intel Core i5-2410M
Intel Core 2 Quad Q9550
AMD Athlon X4 740
Intel Core 2 Duo E6850
Intel Core i7-2630QM
Intel Xeon E5440
Intel Core i3-3110M
Intel Core 2 Duo E7500
Intel Core i7 920
Pentium E6500
Intel Core i3 530
Intel Core i5 M 480
Intel Pentium G620
Intel Core 2 Duo E7400
Pentium E5500
Intel Core 2 Quad Q9450
Intel Core i5 M 460
Intel Core i5 M 520
Intel Core 2 Quad Q9400
Intel Core i3-5005U
Intel Core 2 Duo E7300
Pentium E5400
Intel Core 2 Quad Q8400
Pentium E5300
Intel Core 2 Duo E6750
Intel Core 2 Quad Q9300
AMD FX -8150
Pentium E5200
Intel Xeon L5420
Intel Core 2 Quad Q8300
Intel Core i3 M 380
Intel Core i3-2350M
Intel Core i5 M 430
Intel Core i7 Q 720
AMD FX -8120
Intel Core i3 M 370
Intel Core i3-4030U
Intel Core 2 Quad Q6600
Intel Core i3-2330M
Intel Core 2 Quad
AMD FX -6100
AMD FX -4100
Intel Core 2 Quad Q8200
Intel Core 2 Duo E6550
Intel Core i3-2310M
(YOU) Intel Pentium N4200
AMD A10-8700P
Intel Core i3 M 350
Intel Core i3-3217U
Intel Core i3-4005U
AMD Phenom II X6 1100T
AMD Phenom II X6 1090T
Intel Core 2 Duo E4500
Intel Core i3 M 330
AMD Phenom II X6 1055T
AMD Phenom II X4 965
AMD A8-7410
AMD Phenom II X4 955
AMD Phenom II X4 B55
AMD A8-6410
AMD A8-4500M
AMD Phenom II X4 840
AMD Phenom II X4 B50
AMD A6-6310
AMD Phenom II X4 945
AMD Athlon II X2 250
AMD Athlon II X4 640
AMD Athlon II X2 245
AMD Phenom II X4 925
AMD Athlon II X4 630
AMD Athlon II X2 240
AMD Athlon II X4 620
AMD Athlon 64 X2 6000+
AMD Athlon 64 X2 5200+
AMD Athlon 64 X2 5000+
Intel Pentium N3540
Intel Celeron N2840
Intel Celeron N3050
Intel Atom x5-Z8300
Intel Core i5-2500S vs Intel Core i5-2500S processor comparison for laptops and PCs online: performance, specifications
The main differences between the models
Performance Tests
Characteristics
Reviews
Main differences between models
Reasons to choose
Intel Core i5-2500S
Report a bug
-
More cores
4 2
2 times more flows
Reasons to choose
Intel Pentium G2030
Report a bug
-
Higher clock frequency
3.
 00 GHz 2.70 GHz
 Approximately 10%
higher clock frequency -
Performance per watt
55 W 65 W
0.85 less output per watt
Performance tests
Accurate performance tests Intel Core i5-2500S vs Intel Pentium G2030
Geekbench 5, 64bit (Single Core)
A while ago, there was no competition on the computer processors market
Intel Core i5-2500S
749
Intel Pentium G2030
544
Geekbench 5, 64bit (Multi-Core)
Geekbench 5 is a cross plattform benchmark that heavily uses the systems memory
Intel Core i5-2500S
2043
Intel Pentium G2030
986
iGPU — FP32 Performance (Single-precision GFLOPS)
The theoretical computing performance of the internal graphics unit of the processor with simple accuracy (32 bit) in GFLOPS
Intel Core i5-2500S
106
Intel Pentium G2030
96
Features
Exact specifications for model comparison
Intel Core i5-2500S
Intel Pentium G2030
Processor generation and family
Let’s compare the difference in processor generations between {Intel Core i5-2500S} and {Intel Pentium G2030} processors. The older the generation and the newer the generation of the model, the better. Also consider the following: — Which generation of processors is best for gaming; — What is the most powerful processor; — Which generation processor is faster. Understand which generation of processors is better and what their marking means. And an online comparison of the two CPU models is available on this page.
-
Name
Intel Core i5-2500S Intel Pentium G2030
-
Segment
Desktop / Server Desktop / Server
-
Family
Intel Core i5 Intel Pentium
-
Generation
2 3
-
CPU group
Intel Core i 2000 Intel Pentium G2000
Processor cores and frequency ❖ Multi-core processor clock speed
Let’s compare the {Intel Core i5-2500S} and {Intel Pentium G2030} processors by the characteristics of the base clock frequency. The processor with the highest score wins. Also in some models you can compare the turbo frequency. Consider the following: — What is better for games frequency or number of cores? — What is the best CPU frequency for gaming? What is the best processor speed? Understand what is affected by the base frequency of the CPU and the number of cores to choose the best one.
-
Frequency
2.70 GHz 3.00 GHz
-
CPU cores
4 2
-
Turbo (1 core)
3.
 70 GHz No turbo
 -
CPU threads
4 2
-
Hyperthreading
No. No.
-
Overclocking
No.
 No.
No. -
Basic architecture
normal normal
Integrated graphics card in the processor: choosing the best one
Comparing the {Intel Core i5-2500S} and {Intel Pentium G2030} processors, you can find out which integrated graphics card is better. However, not every model may have a built-in video card. The block does not affect the final performance score and can be skipped. Find out if there is an integrated graphics card in your processor, pay attention to the following: — What is the purpose of integrated graphics in the processor? — Which processor has the best integrated graphics? — What is the best integrated graphics?
Codec support ❁ What you need to know about codecs
It’s time to compare how processors differ from each other in the features of hardware codec support. Each brand may have its own set of instructions. At the same time, understand the following: — What are codecs and what are they for? — How to install codecs? — Which codec to choose?
-
h365 / HEVC (8bit)
No. No.
-
h365 / HEVC (10bit)
No.
 No.
No. -
h364
Decode / Encode Decode / Encode
-
VP9
No. No.
-
VP8
No.
 No.
No. -
AV1
No. No.
-
AVC
Decode / Encode Decode / Encode
-
VC-1
Decode Decode
-
JPEG
No Decode
Memory & PCIe: Find out the maximum amount of processor memory
The type and frequency of memory that the processor supports affects the performance rating. Therefore, we recommend that you carefully compare which model shows the best results in comparison. Understand what is considered a good memory frequency and adjust for the following: — What is the processor memory frequency? — What is more important processor speed or RAM? — What is better memory size or frequency?
-
Memory type
DDR3-1333 DDR3-1333
-
Maximum memory
32GB
-
ECC
No Yes
-
Memory channels
2 2
-
PCIe version
2.
 0 2.0
0 2.0 -
PCIe lanes
16 16
Encryption
We make a choice in favor of a processor that supports encryption. If both processors have the same performance in this block, then you need to look at the comparison of other technical characteristics. Find answers to important questions: — What is encryption and how does it work? — Which encryption is faster? — What software encryption does the processor use?
-
AES-NI
Yes Yes
Temperature ❊ Permissible processor temperature
Let’s compare the temperatures of our {Intel Core i5-2500S} and {Intel Pentium G2030} processors. It is important that the higher the TDP of the processor, the more powerful the cooling system will be required. The optimal model is considered to be a processor with a lower TDP. Processor temperature is an indicator of the state of many computer devices. If the CPU heating exceeds the norm, the PC will start to freeze, so consider the technical characteristics and a number of factors: — What temperature should the processor have? — How to check the operating temperature of the processor? — What is the temperature of laptop processors?
-
TDP (PL1)
65W 55W
Main technical characteristics of a modern processor much more. Pay attention to L2 and L3 — the higher this indicator, the better, also the technical process, the smaller it is, the better. Also consider what are the main technical characteristics of the processor: — What are the main technical characteristics of processors? — Which characteristics of the processor is more significant? — What do the characteristics of the processor mean? On our site you can compare the main technical characteristics of the CPU.
-
Instruction set (ISA)
x86-64 (64 bit) x86-64 (64 bit)
-
Virtualization
VT-x, VT-x EPT VT-x, VT-x EPT, VT-d
-
ISA Extensions
SSE4.
 1, SSE4.2, AVX SSE4.1, SSE4.2
 -
L3 cache
6.00MB 3.00MB
-
Architecture
Sandy Bridge S Ivy Bridge S
-
Technology
32 nm 22 nm
-
Socket
LGA 1155 LGA 1155
-
Issue date
Q1/2011 Q2/2013
Where the processor is used ◉ What is a processor and what is it used for
Let’s compare the difference in the use of {Intel Core i5-2500S} and {Intel Pentium G2030} processors. Based on this comparison, you will understand the intended purpose of the processor (games, entertainment, work). Consider additional factors: — What is the processor for? — What is a processor in simple terms? — Where is the processor needed? Having figured out what the processor affects in games, you will cope with the tasks.
-
Where is
used
Unknown Unknown
Intel Celeron G1620 vs. Intel Atom x5-Z8300
Intel Celeron G1620
Intel Celeron G1620 runs with 2 and 2 CPU threads It runs on No turbo base No turbo all cores while TDP is set to 55 W .The processor connects to LGA 1155 CPU socket This version includes 2. 00 MB L3 cache on a single die, supports 2 to support DDR3-1333 RAM, and supports 2.0 PCIe Gen 16 . Tjunction is kept below — degrees C. In particular, the Ivy Bridge S Architecture is advanced over 22 nm and supports VT-x, VT-x EPT, VT-d . The product was launched Q1/2013
Intel Atom x5-Z8300
Intel Atom x5-Z8300 runs with 4 and 2 CPU threads It runs at 1.84 GHz base 1.84 GHz all cores while the TDP is set to 2 W .The processor connects to a BGA 138 CPU socket This version includes 2.00 MB of L3 cache on a single die, supports 1 to support DDR3L-1600 SO-DIMM RAM, and supports 2.0 PCIe Gen 1 . Tjunction is kept below — degrees C. In particular, Cherry Trail Architecture is advanced beyond 14 nm and supports VT-x, VT-x EPT . The product was launched Q2/2015
Intel Celeron G1620
Intel Atom x5-Z8300
556
 84 GHz
 Intel HD Graphics (Ivy Bridge GT1)
Intel HD Graphics 400
Show more details
Show more details
Cinebench R20 (Single-Core)
Cinebench R20 is the successor to Cinebench R15 and is also based on the Cinema 4 Suite. Cinema 4 is software used all over the world to create 3D forms. The single-core test uses only one CPU core, the number of cores or hyper-threading capability is not taken into account.
Cinebench R20 (Multi-Core)
Cinebench R20 is the successor to Cinebench R15 and is also based on the Cinema 4 Suite. Cinema 4 is software used all over the world to create 3D forms. The multi-core test uses all the CPU cores and has a big advantage of hyper-threading.
Cinebench R15 (Single-Core)
Cinebench R15 is the successor to Cinebench 11.5 and is also based on the Cinema 4 Suite. Cinema 4 is software used all over the world to create 3D forms. The single-core test uses only one CPU core, the number of cores or hyper-threading capability is not taken into account.
Cinebench R15 (Multi-Core)
Cinebench R15 is the successor to Cinebench 11.5 and is also based on Cinema 4 Suite. Cinema 4 is software used all over the world to create 3D forms. The multi-core test uses all the CPU cores and has a big advantage of hyper-threading.
Geekbench 5, 64bit (Single-Core)
Geekbench 5 is a memory-intensive, cross-platform test. A fast memory will greatly push the result. The single-core test uses only one CPU core, the number of cores or hyper-threading capability is not taken into account.
Geekbench 5, 64bit (Multi-Core)
Geekbench 5 is a memory-intensive, cross-platform test. A fast memory will greatly push the result. The multi-core test uses all the CPU cores and has a big advantage of hyper-threading.
iGPU — FP32 Performance (Single-precision GFLOPS)
Theoretical processing performance of the processor’s internal graphics unit with simple precision (32 bits) in GFLOPS. GFLOPS specifies how many billions of floating point operations the iGPU can perform per second.
Geekbench 3, 64bit (Single-Core)
Geekbench 3 is a cross-platform benchmark that is memory intensive. A fast memory will greatly push the result. The single-core test uses only one CPU core, the number of cores or hyper-threading capability is not taken into account.
Geekbench 3, 64bit (Multi-Core)
Geekbench 3 is a cross-platform benchmark that is memory intensive. A fast memory will greatly push the result. The multi-core test uses all the CPU cores and has a big advantage of hyper-threading.
Cinebench R11.5, 64bit (Single-Core)
Cinebench 11.5 is based on Cinema 4D Suite, a software that is popular for creating shapes and other things in 3D. The single-core test uses only one CPU core, the number of cores or hyper-threading capability is not taken into account.
Cinebench R11.5, 64bit (Multi-Core)
Cinebench 11.5 is based on the Cinema 4D Suite, a software that is popular for creating shapes and other things in 3D. The multi-core test uses all the CPU cores and has a big advantage of hyper-threading.
Cinebench R11.5, 64bit (iGPU, OpenGL)
Cinebench 11.5 is based on Cinema 4D Suite, a software that is popular for creating shapes and other things in 3D. The iGPU test uses the CPU’s internal graphics unit to execute OpenGL commands.
Estimated results for PassMark CPU Mark
Some of the processors listed below have been tested with CPU-Comparison.