AMD Ryzen 5 1600 vs AMD Ryzen 5 1600 AF
|
|
|
|
|
AMD Ryzen 5 1600 vs AMD Ryzen 5 1600 AF
Comparison of the technical characteristics between the processors, with the AMD Ryzen 5 1600 on one side and the AMD Ryzen 5 1600 AF on the other side. The first is dedicated to the desktop sector, It has 6 cores, 12 threads, a maximum frequency of 3,6GHz. The second is used on the desktop segment, it has a total of 6 cores, 12 threads, its turbo frequency is set to 3,6 GHz. The following table also compares the lithography, the number of transistors (if indicated), the amount of cache memory, the maximum RAM memory capacity, the type of memory accepted, the release date, the maximum number of PCIe lanes, the values obtained in Geekbench 4 and Cinebench R15.
Note: Commissions may be earned from the links above.
This page contains references to products from one or more of our advertisers. We may receive compensation when you click on links to those products. For an explanation of our advertising policy, please visit this page.
Specifications:
| Processor | AMD Ryzen 5 1600 | AMD Ryzen 5 1600 AF | ||||||
| Market (main) | Desktop | Desktop | ||||||
| ISA | x86-64 (64 bit) | x86-64 (64 bit) | ||||||
| Microarchitecture | Zen | Zen+ | ||||||
| Core name | Summit Ridge | Pinnacle Ridge | ||||||
| Family | Ryzen 5 1000 | Ryzen 5 1000 | ||||||
| Part number(s), S-Spec | YD1600BBAEBOX, YD1600BBM6IAE |
YD1600BBAFBOX | ||||||
| Release date | Q1 2017 | Q1 2020 | ||||||
| Lithography | 14 nm | 12 nm | ||||||
| Transistors | 4. 800.000.000 800.000.000 |
— | ||||||
| Cores | 6 | 6 | ||||||
| Threads | 12 | 12 | ||||||
| Base frequency | 3,2 GHz | 3,2 GHz | ||||||
| Turbo frequency | 3,6 GHz | 3,6 GHz | ||||||
| Cache memory | 16 MB | 16 MB | ||||||
| Max memory capacity | 64 GB | 64 GB | ||||||
| Memory types | DDR4-2667 | DDR4-2667 | ||||||
| Max # of memory channels | 2 | 2 | ||||||
| Max memory bandwidth | 39,74 GB/s | 39,74 GB/s | ||||||
| Max PCIe lanes | 20 | 20 | ||||||
| TDP | 65 W | 65 W | ||||||
| Suggested PSU | 600W ATX Power Supply | 600W ATX Power Supply | ||||||
| GPU integrated graphics | None | None | ||||||
| Socket | AM4, PGA-1331 | AM4, PGA-1331 | ||||||
| Compatible motherboard | Socket AM4 Motherboard | Socket AM4 Motherboard | ||||||
| Maximum temperature | 95°C | 95°C | ||||||
| CPU-Z single thread | 403 | 445 | ||||||
| CPU-Z multi thread | 3. 157 157 |
3.689 | ||||||
| Cinebench R15 single thread | 145 | 154 | ||||||
| Cinebench R15 multi-thread | 1.147 | 1.245 | ||||||
| Cinebench R20 single thread | 350 | 370 | ||||||
| Cinebench R20 multi-thread | 2.580 | 2.790 | ||||||
| Cinebench R23 single thread | 824 | 915 | ||||||
| Cinebench R23 multi-thread | 6.476 | 6.603 | ||||||
| PassMark single thread | 2.068 | 2.088 | ||||||
| PassMark CPU Mark | 12. 335 335 |
12.346 | ||||||
| Amazon | ||||||||
| eBay |
Note: Commissions may be earned from the links above.
We can better compare what are the technical differences between the two processors.
Suggested PSU: We assume that we have An ATX computer case, a high end graphics card, 16GB RAM, a 512GB SSD, a 1TB HDD hard drive, a Blu-Ray drive. We will have to rely on a more powerful power supply if we want to have several graphics cards, several monitors, more memory, etc.
Price: For technical reasons, we cannot currently display a price less than 24 hours, or a real-time price. This is why we prefer for the moment not to show a price. You should refer to the respective online stores for the latest price, as well as availability.
We see that the two processors have an equivalent number of cores, they have a similar turbo frequency, that their respective TDP are of the same order. The AMD Ryzen 5 1600 AF was started more recently.
Performances :
Performance comparison between the two processors, for this we consider the results generated on benchmark software such as Geekbench 4.
| CPU-Z — Multi-thread & single thread score | |
|---|---|
| AMD Ryzen 5 1600 AF |
445 3.689 |
| AMD Ryzen 5 1600 |
403 3.157 |
In single core, the difference is 10%. In multi-core, the difference in terms of gap is 17%.
Note: Commissions may be earned from the links above. These scores are only an
average of the performances got with these processors, you may get different results.
CPU-Z is a system information software that provides the name of the processor, its model number, the codename, the cache levels, the package, the process. It can also gives data about the mainboard, the memory. It makes real time measurement, with finally a benchmark for the single thread, as well as for the multi thread.
| Cinebench R15 — Multi-thread & single thread score | |
|---|---|
| AMD Ryzen 5 1600 AF |
154 1.245 |
| AMD Ryzen 5 1600 |
145 1.147 |
In single core, the difference is 6%. In multi-core, the difference in terms of gap is 9%.
Note: Commissions may be earned from the links above. These scores are only an
average of the performances got with these processors, you may get different results.
Cinebench R15 evaluates the performance of CPU calculations by restoring a photorealistic 3D scene. The scene has 2,000 objects, 300,000 polygons, uses sharp and fuzzy reflections, bright areas, shadows, procedural shaders, antialiasing, and so on. The faster the rendering of the scene is created, the more powerful the PC is, with a high number of points.
| Cinebench R20 — Multi-thread & single thread score | |
|---|---|
| AMD Ryzen 5 1600 AF |
370 2.790 |
| AMD Ryzen 5 1600 |
350 2.580 |
In single core, the difference is 6%. In multi-core, the difference in terms of gap is 8%.
Note: Commissions may be earned from the links above. These scores are only an
average of the performances got with these processors, you may get different results.
Cinebench R20 is a multi-platform test software which allows to evaluate the hardware capacities of a device such as a computer, a tablet, a server. This version of Cinebench takes into account recent developments in processors with multiple cores and the latest improvements in rendering techniques. The evaluation is ultimately even more relevant.
| Cinebench R23 — Multi-thread & single thread score | |
|---|---|
| AMD Ryzen 5 1600 AF |
915 6.603 |
| AMD Ryzen 5 1600 |
824 6.476 |
In single core, the difference is 11%. In multi-core, the difference in terms of gap is 2%.
Note: Commissions may be earned from the links above. These scores are only an
average of the performances got with these processors, you may get different results.
Cinebench R23 is cross-platform testing software that allows you to assess the hardware capabilities of a device such as a computer, tablet, server. This version of Cinebench takes into account recent developments in processors with multiple cores and the latest improvements in rendering techniques. The evaluation is ultimately even more relevant. The test scene contains no less than 2,000 objects and more than 300,000 polygons in total.
| PassMark — CPU Mark & single thread | |
|---|---|
| AMD Ryzen 5 1600 AF |
2.088 12.346 |
| AMD Ryzen 5 1600 |
2.068 12.335 |
In single core, the difference is 1%. In multi-core, the difference in terms of gap is 0%.
Note: Commissions may be earned from the links above. These scores are only an
average of the performances got with these processors, you may get different results.
PassMark is a benchmarking software that performs several performance tests including prime numbers, integers, floating point, compression, physics, extended instructions, encoding, sorting. The higher the score is, the higher is the device capacity.
Equivalence:
AMD Ryzen 5 1600 Intel equivalentAMD Ryzen 5 1600 AF Intel equivalent
AMD Ryzen 5 1600 AF Review
AMD’s first-gen Ryzen chips continue to sell as budget alternatives to the newer generations and the Ryzen 5 1600/2600 products in particular are very attractive for budget builds. Today we’re checking out the 12nm version of the Ryzen 5 1600 that despite the name, is a new CPU that’s only been on the market for a few months.
To quickly recap, the Ryzen 5 1600 was released in April 2017 for $220, based on the original 14nm Zen architecture. It’s a 6-core, 12-thread part clocked at 3.2 GHz for the base with an all-core boost clock of 3.4 GHz and cooled using the Wraith Spire.
About a year later, AMD replaced it with the Ryzen 5 2600 at $200. It was also a 6-core processor, but featuring updated 12nm Zen+ cores. It ran at a base clock of 3. 4 GHz with an all-core of 3.7 GHz. Because the more refined process was more efficient, AMD downgraded the cooler to the Wraith Stealth.
After one more year, we got the current generation Zen 2 processors. Here the replacement was the Ryzen 5 3600, another (incredibly good) $200 part.
But what is this Ryzen 5 1600 AF?
Late last year a mysterious Ryzen 5 1600 refresh made it to market. Bizarrely, AMD released a really cheap version of the Ryzen 5 2600, but just called it the Ryzen 5 1600. Known as the «Ryzen 5 1600 AF» because of the box identification, it’s very different to the original Ryzen 5 1600 AE model.
Forget about the name, this is a 2nd-gen Ryzen part. Essentially it’s an R5 2600 with a slight decrease in clock speed. Apparently AMD didn’t have enough 14nm wafers available to keep producing the R5 1600, so they simply shifted it to the 12nm process and now they’re making a version of the R5 2600 that they call the R5 1600.
At this point you may be asking yourself, why do I care that AMD is making new products and selling them under old names? Seems counterproductive, but the reason you should care is price. These underclocked Ryzen 5 2600 CPUs cost a mere $85. That’s a Zen+ 6-core, 12-thread part for just $85 brand new.
The original 14nm Ryzen 5 1600 was a great deal at a little over $100 and the Ryzen 5 2600 was killer at $120, but the Ryzen 5 1600 AF blows them both out of the water at just $85. That is, as long as you can get it. The CPU seems to be readily available in the United States, but it’s not sold everywhere.
Before we get into the blue bar graphs, here’s a look at how the 1600 AF clocks compared to the original 1600 AE model, as well as the 2600: running a heavy Blender workload, the original 1600 operates at 3.4 GHz, the new AF model maintained 3.7 GHz and the 2600 runs at 3.8 GHz.
From this test alone, it would appear like the 1600 AF could be up to 3% slower than the 2600 out of the box, but it’s way cheaper. Armed with that information, let’s jump into our tests which we’ll power through as the results aren’t surprising and don’t require much explanation.
For testing we’re using the Gigabyte X570 Aorus Master with 16GB of G.Skill’s FlareX DDR4-3200 memory and a RTX 2080 Ti GPU.
Benchmarks
First up we have the Cinebench R20 multi-core performance and here the 1600 AF basically matched the 2600, less than a 1% margin in it. This means out of the box the AF was 12% faster than the original 1600.
For single core performance the 2600 was 1.5% faster than the 1600 AF and that makes the new 12nm 1600 is 10% faster than the original.
Running 7-zip we see identical compression performance. Again, the AF is about 10% faster than the original 1600. For the decompression test the 2600 was 1.5% faster than the 1600 AF which was 9% faster than the original 1600.
The last application we bothered to run was Blender, here the 1600 AF was about a 1% slower than the 2600. No surprises here.
Gaming Benchmarks
Time for some gaming benchmarks and first up we have Assassin’s Creed Odyssey AND. .. the 1600 AF delivers basically the same performance as the R5 2600, making it a little faster than the original 1600. As expected the margins are very similar at 1440p.
Performance in Battlefield V is very similar between the original 1600, the 1600 AF and the 2600. Of course, it’s the same story at 1440p, so with a lesser graphics card you can expect to see no difference at all.
The 1600 AF matched the 2600 with identical performance in Shadow of the Tomb Raider, making it a few frames faster than the original model and we see basically identical margins at 1440p.
We see identical gaming performance from the 1600 AF when compared to the 2600 once again, this time when testing with The Division 2.
The results at 1440p are no different and here we see more evidence that the 1600 and 1600 AF will deliver the same gaming experience with a lower tier GPU.
Next up we have Far Cry New Dawn and yes.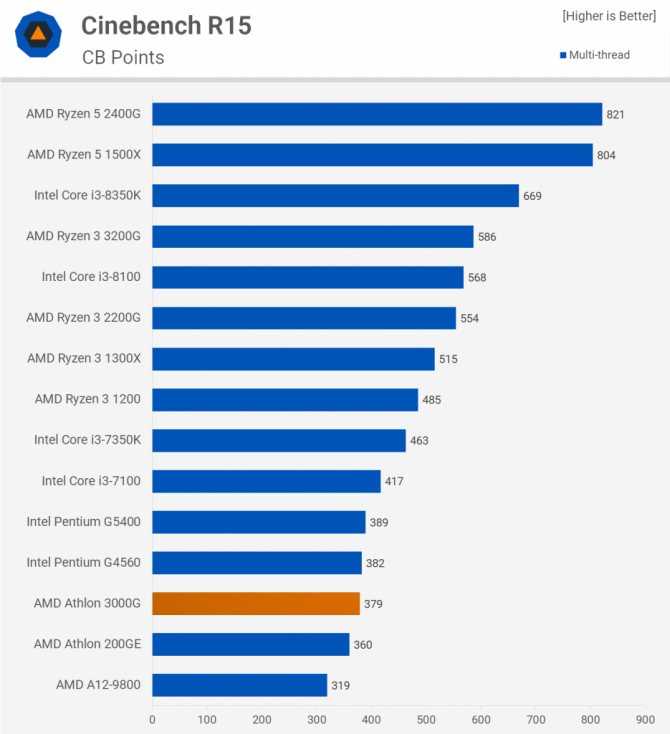 … this is a familiar sight.
The 1600A basically matching the 2600 making it a little faster than the original, the true 1600. 1440p doesn’t offer up any surprises, more of the same here.
We see a nice 13% boost to the 1% low performance for the 1600 AF over the 1600 in Hitman 2 at 1080p and the refreshed 1600 was able to basically match the 2600. The 1% low margin extends to 16% at 1440p, but overall the margins are much the same.
The 1600 AF also shows good 1% low improvements in Total War Three Kingdoms, beating the 1600 by a 16% margin at 1080p to coming in 1-2 fps behind the 2600. The margins are reduced slightly at 1440p, but overall a similar story.
Wrap Up: Incredible Budget CPU
That was our quick look at how the Ryzen 5 1600 AF performs and the results were as positive as we expected. It’s a Ryzen 5 2600 with very minor reduction in clock speed. Speaking of which, you can of course overclock the 1600 AF as it’s fully unlocked.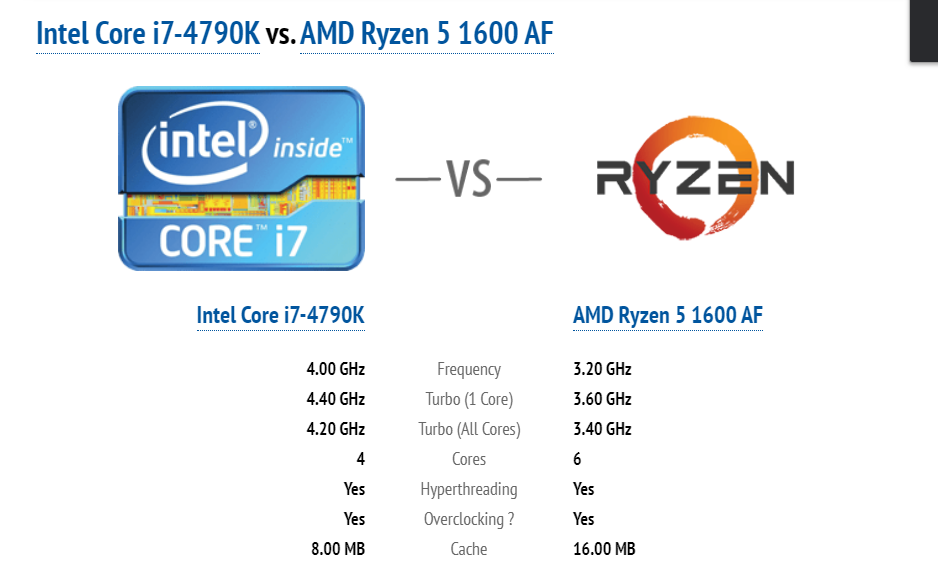 Our chip — which we bought from retail — hit 4.2 GHz using 1.4v and that’s the same overclock achieved by the R5 2600 retail part we have on hand.
Some chips might only do 4 GHz depending on silicon quality, some or rather few might exceed 4.2 GHz, but based on reports we’ve seen 4.2 GHz seems like the upper end of the overclocking results. Our original R5 1600 chip also does 4 GHz and that seems to be about as good as you can realistically hope for with the older processor.
In other words, the Ryzen 5 1600 AF is not only cheaper than the original 1600 and faster out of the box, but it should also overclock better. Power consumption is inline with the 2600, with a slight advantage out of the box due to the minor decrease in clock speed, though this can vary depending on silicon quality.
For budget builders with access to the 1600 AF at $85, there is simply no better choice. As we said earlier, the Ryzen 5 2600 was already amazing value at $120. Thus, the 1600 AF which is basically the same CPU for a further discount is just an insane deal.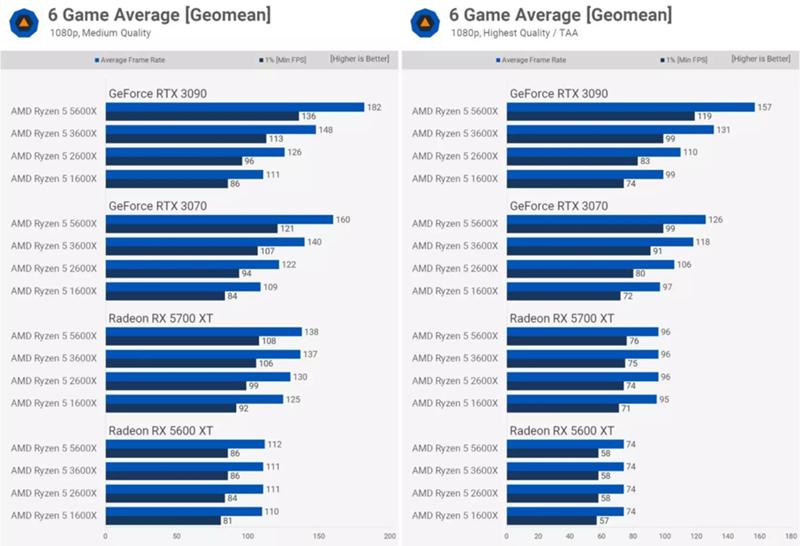
AMD is putting the hurt on Intel with parts like this. Right now the Core i5-9600K costs $240 and the locked i5-9400F comes in at $165 (check out this performance comparison). We expect both of these 6-core/6-thread processors to be slower than the 1600 AF for gaming within a few years. If the 1600 AF is not selling in your country, you can still buy the R5 2600 for less than any modern Core i5 processor, which is why we had picked it as the best budget CPU you can buy, well, until now.
Shopping Shortcuts:
- AMD Ryzen 5 1600 AF on Amazon
- AMD Ryzen 5 2600 on Amazon
- AMD Ryzen 5 3600 on Amazon
- Intel Core i5-9400F on Amazon
- AMD Radeon RX 5700 on Amazon
- GeForce RTX 2060 Super on Amazon
AMD Ryzen 7 2700 vs Ryzen 5 1600:
performance comparison
VS
AMD Ryzen 7 2700
AMD Ryzen 5 1600
Which is better: 8-core AMD Ryzen 7 2700 at 3.2 GHz or Ryzen 5 1600 with 6 cores at 3. 2 GHz? To find out, read our comparative testing of these desktop processors in popular benchmarks, games and heavy applications.
- Overview
- Differences
- Performance
- Features
- Comments
Overview
Overview and comparison of the main metrics from NanoReview
Single -flow performance
Rating in tests using one kernel
Ryzen 7 2700
47
Ryzen 5 1600
42
Multi -flow performance
Tests in benchmarks, where all nuclei
Ryzen 7 27 2,000 9000 9000 9000 9000 9000 9000 9000 35
RYZEN 5 1600
26
Energy efficiency
Effect Energy Consumption Chip
Ryzen 7 2700
47
Ryzen 5 1600
44
4000
9000 9000 9000 Ry 9000 Ry
Ryzen 5 1600
37
Key differences
What are the main differences between 1600 and 2700
Reasons to choose AMD Ryzen 7 2700
- Has 2 physical cores more
- Appeared 1 year later than the rival
- More modern manufacturing process — 12 vs.
 14 nanometers
 - 14% higher frequency in Turbo Boost (4.1 GHz vs. 3.6 GHz)
- GB On 3.97 /c (10%) higher maximum memory bandwidth
Benchmark tests
Compare the results of processor tests in benchmarks
Cinebench R23 (single core)
Ryzen 7 2700
+18%
1056
Ryzen 5 1600
898
Cinebench R23 (multi-core)
Ryzen 7 2700
+43%
8871
Ryzen 5 1600
6187
Passmark CPU (Single Core)
Ryzen 7 2700
+5%
2180
Ryzen 5 1600
2067
Passmark CPU (multi-core)
Ryzen 7 2700
+28%
15708
Ryzen 5 1600
12234
Geekbench 5 (single core)
Ryzen 7 2700
+9%
1007
Ryzen 5 1600
921
Geekbench 5 (multi-core)
Ryzen 7 2700
+32%
6737
Ryzen 5 1600
5104
▶️ Add your score to Cinebench R23
Specifications
AMD Ryzen 7 2700 and Ryzen 5 1600 full technical specifications list
nine0002
General information
| Manufacturer | AMD | AMD |
| Release date | April 19, 2018 | April 11, 2017 |
| Type | Desktop | Desktop |
| Instruction set architecture | x86-64 | x86-64 |
| Codename | Zen+ | Zen |
| Socket | AM4 | AM4 |
| Integrated graphics | No | No |
Performance
| Cores | 8 | 6 |
| Number of threads | 16 | 12 |
| Frequency | 3.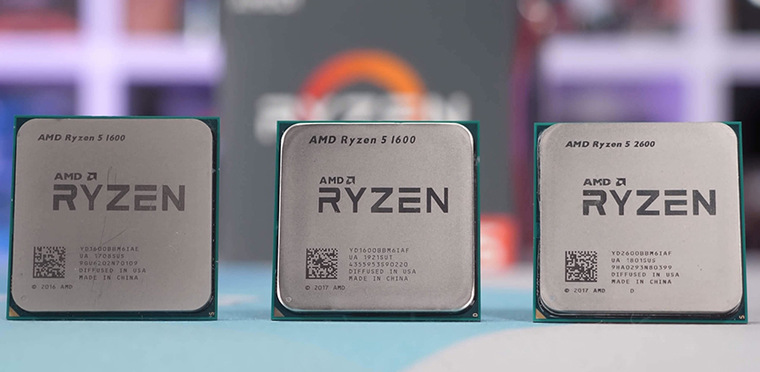 2 GHz 2 GHz |
3.2 GHz |
| Max. frequency in Turbo Boost | 4.1 GHz | 3.6 GHz |
| Bus frequency | 100 MHz | 100 MHz |
| Multiplier | 36x | 32x |
| Level 1 cache | 96KB (per core) | 96KB (per core) |
| Level 2 cache | 512KB (per core) | 512KB (per core) |
| Level 3 cache | 16MB (shared) | 16MB (shared) |
| Unlocked multiplier | Yes | Yes |
Power consumption
| Number of transistors | 4.8 billion | 4.8 billion |
| Process | 12 nanometers | 14 nanometers |
| Power consumption (TDP) | 65 W | 65 W |
| Critical temperature | 95°C | 95°C |
Memory support
| Memory type | DDR4-2933 | DDR4-2666 |
Max. size size |
64 GB | 64 GB |
| Number of channels | 2 | 2 |
| Max. bandwidth | 43.71 GB/s | 39.74 GB/s |
| ECC support | Yes | Yes |
Other
| Official site | AMD Ryzen 7 2700 website | AMD Ryzen 5 1600 website |
| PCI Express Version | 3.0 | 3.0 |
| Max. PCI Express lanes | 20 |
Poll
What processor do you think is the best?
Ryzen 7 2700
24 (70.6%)
Ryzen 5 1600
10 (29.4%)
Total votes: 34
Competitors
1.
Ryzen 7 5700X vs Ryzen 7 2700
2.
Ryzen 5 5600 vs Ryzen 7 2700
3.
Ryzen 5 5600X vs Ryzen 5 1600
4.
Ryzen 5 3600 vs Ryzen 5 1600
AMD Ryzen 5 1600 AF vs. Intel Core i5-10400F
AMD Ryzen 5 1600 AF
AMD Ryzen 5 1600 AF runs with 6 and 12 CPU threads It runs at 3.60 GHz base 3.40 GHz all cores while TDP is set to 65 W . CPU socket AM4 (LGA 1331) This version includes 16.00 MB of L3 cache on a single die, supports 2 to support DDR4-2666 RAM, and supports 3.0 PCIe Gen 20 . Tjunction keeps below 95 °C degrees C. In particular, the Pinnacle Ridge (Zen+) architecture has been advanced over 12 nm and supports AMD-V, SVM . The product was launched Q4/2019
Intel Core i5-10400F
Intel Core i5-10400F runs with 6 and 12 CPU threads It runs at 4.30 GHz base 4.00 GHz all cores while TDP is set to 65 W .CPU connects to LGA 1200 CPU socket This version includes 12.00 MB of L3 cache on a single die, supports 2 to support DDR4-2666 RAM, and supports 3.0 PCIe Gen 16 . Tjunction is kept below 100°C degrees C. Specifically, the Comet Lake S architecture is advanced beyond 14 nm and supports VT-x, VT-x EPT, VT-d . The product was launched Q2/2020
AMD Ryzen 5 1600 AF
Intel Core i5-10400F
nine0177 GPU (Turbo)
 displays
 nine0177 L2 Cache
nine0183
Show more details
Show more details
Cinebench R23 (Single-Core)
Cinebench R23 is the successor to Cinebench R20 and is also based on Cinema 4 Suite.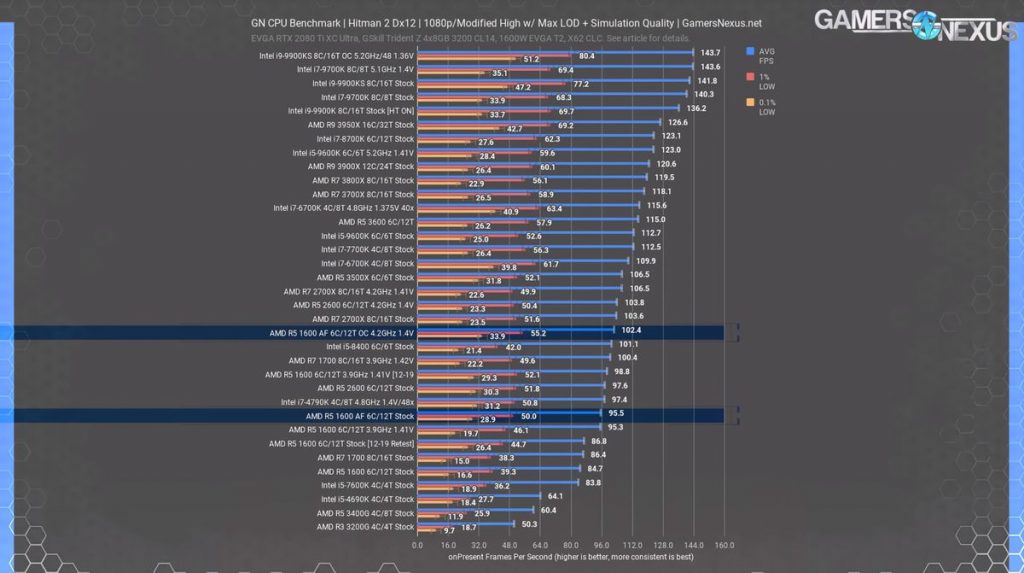 Cinema 4 is software used all over the world to create 3D forms. The single-core test uses only one CPU core, the number of cores or hyper-threading capability is not taken into account. nine0003
Cinebench R23 (Multi-Core)
Cinebench R23 is the successor to Cinebench R20 and is also based on the Cinema 4 Suite. Cinema 4 is software used all over the world to create 3D forms. The multi-core test uses all the CPU cores and has a big advantage of hyper-threading.
Cinebench R20 (Single-Core)
Cinebench R20 is the successor to Cinebench R15 and is also based on Cinema 4 Suite. Cinema 4 is software used all over the world to create 3D forms. The single-core test uses only one CPU core, the number of cores or hyper-threading capability is not taken into account. nine0003
Cinebench R20 (Multi-Core)
Cinebench R20 is the successor to Cinebench R15 and is also based on the Cinema 4 Suite. Cinema 4 is software used all over the world to create 3D forms. The multi-core test uses all the CPU cores and has a big advantage of hyper-threading.
Cinebench R15 (Single-Core)
Cinebench R15 is the successor to Cinebench 11.5 and is also based on the Cinema 4 Suite. Cinema 4 is software used all over the world to create 3D forms. The single-core test uses only one CPU core, the number of cores or hyper-threading capability is not taken into account. nine0003
Cinebench R15 (Multi-Core)
Cinebench R15 is the successor to Cinebench 11.5 and is also based on Cinema 4 Suite. Cinema 4 is software used all over the world to create 3D forms. The multi-core test uses all the CPU cores and has a big advantage of hyper-threading.
Geekbench 5, 64bit (Single-Core)
Geekbench 5 is a memory-intensive, cross-platform benchmark. A fast memory will greatly push the result. The single-core test uses only one CPU core, the number of cores or hyper-threading capability is not taken into account. nine0003
Geekbench 5, 64bit (Multi-Core)
Geekbench 5 is a memory-intensive, cross-platform benchmark. A fast memory will greatly push the result. The multi-core test uses all the CPU cores and has a big advantage of hyper-threading.
Blender 2.81 (bmw27)
Blender is a free 3D graphics software for rendering (creating) 3D bodies that can also be textured and animated in the program. The Blender test creates predefined scenes and measures the time(s) required for the entire scene. The less time it takes, the better. We chose the bmw27 as our reference scene. nine0003
Estimated results for PassMark CPU Mark
Some of the processors listed below have been tested with CPU-Comparison. However, most of the processors were not tested and the results were evaluated by the secret patented CPU-Comparison formula. As such, they do not accurately reflect the actual values of Passmark CPU ratings and are not endorsed by PassMark Software Pty Ltd.
Monero Hashrate kH/s
Monero has been using the RandomX algorithm since November 2019of the year. This PoW (proof of work) algorithm can only be computed efficiently using either a processor (CPU) or a graphics card (GPU).