AMD A9-9425 vs Intel Core i5-8400
|
|
|
|
|
AMD A9-9425 vs Intel Core i5-8400
Comparison of the technical characteristics between the processors, with the AMD A9-9425 on one side and the Intel Core i5-8400 on the other side. The first is dedicated to the notebook sector, It has 2 cores, 2 threads, a maximum frequency of 3,7GHz. The second is used on the desktop segment, it has a total of 6 cores, 6 threads, its turbo frequency is set to 4,0 GHz. The following table also compares the lithography, the number of transistors (if indicated), the amount of cache memory, the maximum RAM memory capacity, the type of memory accepted, the release date, the maximum number of PCIe lanes, the values obtained in Geekbench 4 and Cinebench R15.
Note: Commissions may be earned from the links above.
This page contains references to products from one or more of our advertisers. We may receive compensation when you click on links to those products. For an explanation of our advertising policy, please visit this page.
Specifications:
| Processor | AMD A9-9425 | Intel Core i5-8400 | ||||||
| Market (main) | Notebook | Desktop | ||||||
| ISA |
x86-64 (64 bit) |
x86-64 (64 bit) | ||||||
| Microarchitecture | Excavator | Coffee Lake | ||||||
| Core name | Stoney Ridge | Coffee Lake-S | ||||||
| Family | A9-9000 | Core i5-8000 | ||||||
| Part number(s), S-Spec | AM9425AYN23AC | BX80684I58400, BXC80684I58400, CM8068403358811, BOC80684I58400, BO80684I58400, SR3QT, QNMN |
||||||
| Release date | Q1 2016 | Q4 2017 | ||||||
| Lithography | 28 nm | 14 nm++ | ||||||
| Transistors | 1. 200.000.000 200.000.000 |
— | ||||||
| Cores | 2 | 6 | ||||||
| Threads | 2 | 6 | ||||||
| Base frequency | 3,1 GHz | 2,8 GHz | ||||||
| Turbo frequency | 3,7 GHz | 4,0 GHz | ||||||
| Cache memory | 1 MB | 9 MB | ||||||
| Max memory capacity | 8 GB | 64 GB | ||||||
| Memory types | DDR4-2133 | DDR4-2666 | ||||||
| Max # of memory channels | 1 | 2 | ||||||
| Max PCIe lanes | 8 | 16 | ||||||
| TDP | 15 W | 65 W | ||||||
| Suggested PSU | — | 600W ATX Power Supply | ||||||
| GPU integrated graphics | AMD Radeon R5 Mobile Graphics (Stoney) | Intel UHD Graphics 630 (Coffee Lake) | ||||||
| GPU cores | 3 | — | ||||||
| GPU execution units | — | 23 | ||||||
| GPU shading units | 192 | 184 | ||||||
| GPU base clock | 200 MHz | 350 MHz | ||||||
| GPU boost clock | 800 MHz | 1050 MHz | ||||||
| GPU FP32 floating point | 325,2 GFLOPS | 423,2 GFLOPS | ||||||
| Socket | BGA | LGA1151 | ||||||
| Compatible motherboard | — | Socket LGA 1151 Motherboard | ||||||
| Maximum temperature | 90°C | 100°C | ||||||
| CPU-Z single thread | 196 | 442 | ||||||
| CPU-Z multi thread | 351 | 2. 666 666 |
||||||
| Cinebench R15 single thread | 120 | 169 | ||||||
| Cinebench R15 multi-thread | 360 | 954 | ||||||
| PassMark single thread | 1.342 | 2.401 | ||||||
| PassMark CPU Mark | 1.538 | 9.206 | ||||||
| (Windows 64-bit) Geekbench 4 single core |
3.628 | 4.765 | ||||||
| (Windows 64-bit) Geekbench 4 multi-core |
7.137 | 18.154 | ||||||
| (SGEMM) GFLOPS performance |
88,06 GFLOPS | 299,4 GFLOPS | ||||||
| (Multi-core / watt performance) Performance / watt ratio |
476 pts / W | 279 pts / W | ||||||
| Amazon | ||||||||
| eBay |
Note: Commissions may be earned from the links above.
We can better compare what are the technical differences between the two processors.
Suggested PSU: We assume that we have An ATX computer case, a high end graphics card, 16GB RAM, a 512GB SSD, a 1TB HDD hard drive, a Blu-Ray drive. We will have to rely on a more powerful power supply if we want to have several graphics cards, several monitors, more memory, etc.
Price: For technical reasons, we cannot currently display a price less than 24 hours, or a real-time price. This is why we prefer for the moment not to show a price. You should refer to the respective online stores for the latest price, as well as availability.
The processor Intel Core i5-8400 has a larger number of cores, the turbo frequency of Intel Core i5-8400 is bigger, that the PDT of AMD A9-9425 is lower. The Intel Core i5-8400 was started more recently.
Performances :
Performance comparison between the two processors, for this we consider the results generated on benchmark software such as Geekbench 4.
| CPU-Z — Multi-thread & single thread score | |
|---|---|
| Intel Core i5-8400 |
442 2.666 |
| AMD A9-9425 |
196 351 |
In single core, the difference is 126%. In multi-core, the difference in terms of gap is 660%.
Note: Commissions may be earned from the links above. These scores are only an
average of the performances got with these processors, you may get different results.
CPU-Z is a system information software that provides the name of the processor, its model number, the codename, the cache levels, the package, the process. It can also gives data about the mainboard, the memory. It makes real time measurement, with finally a benchmark for the single thread, as well as for the multi thread.
| Cinebench R15 — Multi-thread & single thread score | |
|---|---|
| Intel Core i5-8400 |
169 954 |
| AMD A9-9425 |
120 360 |
In single core, the difference is 41%. In multi-core, the difference in terms of gap is 165%.
Note: Commissions may be earned from the links above. These scores are only an
average of the performances got with these processors, you may get different results.
Cinebench R15 evaluates the performance of CPU calculations by restoring a photorealistic 3D scene. The scene has 2,000 objects, 300,000 polygons, uses sharp and fuzzy reflections, bright areas, shadows, procedural shaders, antialiasing, and so on. The faster the rendering of the scene is created, the more powerful the PC is, with a high number of points.
| PassMark — CPU Mark & single thread | |
|---|---|
| Intel Core i5-8400 |
2.401 9.206 |
| AMD A9-9425 |
1.342 1.538 |
In single core, the difference is 79%. In multi-core, the difference in terms of gap is 499%.
Note: Commissions may be earned from the links above. These scores are only an
average of the performances got with these processors, you may get different results.
PassMark is a benchmarking software that performs several performance tests including prime numbers, integers, floating point, compression, physics, extended instructions, encoding, sorting. The higher the score is, the higher is the device capacity.
On Windows 64-bit:
| Geekbench 4 — Multi-core & single core score — Windows 64-bit | |
|---|---|
| Intel Core i5-8400 |
4.765 18.154 |
| AMD A9-9425 |
3.628 7.137 |
In single core, the difference is 31%. In multi-core, the difference in terms of gap is 154%.
On Linux 64-bit:
| Geekbench 4 — Multi-core & single core score — Linux 64-bit | |
|---|---|
| Intel Core i5-8400 |
5.100 18.750 |
| AMD A9-9425 |
3.740 6.747 |
In single core, the difference is 36%. In multi-core, the difference in terms of gap is 178%.
On Android 64-bit:
| Geekbench 4 — Multi-core & single core score — Android 64-bit | |
|---|---|
| Intel Core i5-8400 |
4.145 14.898 |
| AMD A9-9425 |
3.201 6.145 |
In single core, the difference is 29%. In multi-core, the difference in terms of gap is 142%.
On Mac OS X 64-bit:
| Geekbench 4 — Multi-core & single core score — Mac OS X 64-bit | |
|---|---|
| Intel Core i5-8400 |
5.  098 09820.285 |
| AMD A9-9425 |
4.681 9.717 |
In single core, the difference is 9%. In multi-core, the difference in terms of gap is 109%.
Note: Commissions may be earned from the links above. These scores are only an
average of the performances got with these processors, you may get different results.
Geekbench 4 is a complete benchmark platform with several types of tests, including data compression, images, AES encryption, SQL encoding, HTML, PDF file rendering, matrix computation, Fast Fourier Transform, 3D object simulation, photo editing, memory testing. This allows us to better visualize the respective power of these devices. For each result, we took an average of 250 values on the famous benchmark software.
Equivalence:
AMD A9-9425 Intel equivalentIntel Core i5-8400 AMD equivalent
See also:
AMD A9-9420AMD A9-9420e
Intel Core i5-8400HIntel Core i5-8400T
CPU-Z Benchmark for AMD A9-9425 RADEON R5; 5 COMPUTE CORES 2C+3G (1T)
Best CPU performance — 64-bit — November 2022
AMD A9-9425 RADEON R5; 5 COMPUTE CORES 2C+3G (1T)
Back to validation
Intel Core i9-13900K
Intel Core i7-13700K
Intel Core i9-12900KS
Intel Core i9-12900KF
Intel Core i9-12900K
Intel Core i7-12700KF
Intel Core i7-12700K
AMD Ryzen 9 7950X
Intel Core i5-12600K
Intel Core i5-12600KF
Intel Core i7-12700
Intel Core i7-12700F
Intel Core i9-12900H
Intel Core i7-12700H
Intel Core i5-12500
Intel Core i5-12500H
Intel Core i9-11900K
Intel Core i5-12490F
Intel Core i5-12400
Intel Core i3-12100
Intel Core i5-12400F
AMD Ryzen 9 5950X
Intel Core i3-12100F
AMD Ryzen 9 5900X
AMD Ryzen 7 5800X
Intel Core i7-11700K
Intel Core i7-11700KF
AMD Ryzen 7 5700X
Intel Core i5-11600K
AMD Ryzen 5 5600X
Intel Core i7-11700
Intel Core i7-11700F
AMD Ryzen 7 5700G
AMD Ryzen 5 5600
AMD Ryzen 7 5800X3D
AMD Ryzen 9 5900HX
AMD Ryzen 5 5600G
AMD Ryzen 7 6800H
Intel Core i9-10900K
Intel Core i7-11800H
Intel Core i9-10850K
Intel Core i7-10700KF
Intel Core i5-11400
AMD Ryzen 5 5500
Intel Core i9-9900KF
Intel Core i5-11400F
Intel Core i7-9700KF
Intel Core i5-11400H
AMD Ryzen 7 5800H
Intel Core i7-10700K
Intel Core i7-9700K
Intel Core i9-9900K
AMD Ryzen 5 5600H
Intel Core i5-10600KF
Intel Core i5-9600KF
Intel Core i5-10600K
Intel Core i7-10700
Intel Core i5-11300H
Intel Core i7-10700F
Intel Core i7-1165G7
Intel Core i7-9700
AMD Ryzen 9 3950X
AMD Ryzen 9 3900X
Intel Core i5-9600K
AMD Ryzen 7 3800X
Intel Core i7-8700K
AMD Ryzen 7 3700X
AMD Ryzen 5 PRO 4650G
Intel Core i5-8600K
Intel Core i5-1135G7
AMD Ryzen 5 3600X
Intel Core i7-7700K
AMD Ryzen 7 4800H
AMD Ryzen 5 3600
AMD Ryzen 7 5700U
Intel Core i7-8700
AMD Ryzen 5 3500X
AMD Ryzen 5 3500
Intel Core i3-1115G4
AMD Ryzen 5 5500U
Intel Core i7-10750H
Intel Core i3-9100F
Intel Core i3-10105F
Intel Core i7-6700K
Intel Core i5-8500
AMD Ryzen 5 4600H
Intel Core i5-9400
Intel Core i5-10400
Intel Core i3-10100
Intel Core i5-9400F
Intel Core i5-6600K
Intel Core i3-10100F
AMD Ryzen 7 2700X
Intel Core i5-10400F
Intel Core i7-4790K
AMD Ryzen 3 3100 4-Core
Intel Core i5-10300H
Intel Core i5-8400
Intel Core i7-9750H
AMD Ryzen 5 2600X
Intel Core i7-7700
Intel Core i7-8750H
Intel Core i5-4690K
AMD Ryzen 3 3200G
AMD Ryzen 5 3400G
Intel Core i5-9300H
AMD Ryzen 5 2600
Intel Core i3-8100
Intel Core i5-7500
Intel Core i7-10510U
Intel Core i5-8300H
AMD Ryzen 5 1600X
Intel Core i7-8565U
AMD Ryzen 3 2200G
Intel Core i7-4770K
Intel Core i5-4690
Intel Core i5-10210U
AMD Ryzen 5 2400G
Intel Core i7-4790
Intel Core i5-1035G1
Intel Core i7-6700
AMD Ryzen 7 2700
Intel Core i7-4770
AMD Ryzen 7 1700
Intel Core i5-8265U
AMD Ryzen 5 1600
Intel Core i5-4590
Intel Core i3-1005G1
AMD Ryzen 5 3550H with
Intel Core i5-3570K
Intel Core i5-6500
Intel Core i5-7400
Intel Core i7-3770K
Intel Xeon E3-1231 v3
Intel Core i7-8550U
Intel Core i5-4570
Intel Core i3-7100
AMD Ryzen 3 1200
Intel Xeon E5-2666 v3
Intel Core i5-3570
Intel Core i3-10110U
Intel Core i5-2500K
Intel Core i7-3770
AMD Ryzen 7 3750H with
Intel Core i7-2600K
Intel Core i7-7700HQ
Intel Core i5-8250U
Intel Core i5-7300HQ
Intel Core i5-6400
Intel Core i3-6100
Intel Core i5-4460
Intel Core i5-3470
Intel Xeon E5-2640 v3
AMD Ryzen 5 3500U with
Intel Core i5-4440
Intel Xeon E3-1230 V2
Intel Core i3-4170
Intel Core i5-2500
Intel Pentium G4560
AMD Athlon 3000G
Intel Core i7-2600
Intel Core i3-4160
Intel Xeon E5-2689
Intel Core i7-6700HQ
Intel Core i7-7500U
Intel Xeon E5-2670 v3
Intel Core i5-2400
Intel Xeon E5-2620 v3
Intel Xeon E5-2650 v2
Intel Core i3-4130
Intel Core i5-3330
AMD Ryzen 3 3250U
Intel Core i5-7200U
Intel Core i3-3240
Intel Core i3-3220
Intel Core i5-6300U
Intel Core i3-2120
Intel Core i5-3230M
Intel Core i3-2100
Intel Core 2 Duo E8400
Intel Core i5-6200U
Intel Core i5-2520M
Intel Core i5-5200U
Intel Core 2 Quad Q9550
Intel Core i5 650
Intel Core 2 Duo E7500
Intel Core i5-3210M
AMD FX -8350
Intel Core i5-2450M
AMD FX -8320
Intel Core i5-2410M
AMD FX -6300
Intel Core i5-4210U
AMD FX -8300
Intel Core 2 Quad Q6600
Intel Core i3-7020U
Intel Core i5-4200U
Intel Core i3-5005U
Intel Core i3-6006U
(YOU) AMD A9-9425 RADEON R5; 5 COMPUTE CORES 2C+3G
Intel Core i3-4005U
AMD A9-9425 vs Intel Core i5-8400T: What is the difference?
44 BALLLA
AMD A9-9425
50 BALLLA
Intel Core i5-8400t
Winter when comparing
VS
67 Facts compared to
AMD A9-9425
9000 Is A9-9425 better than Intel Core i5-8400T?
- GPU frequency 408MHz higher?
758MHz vs 350MHz - 0.
 4GHz higher turbo clock speed?
3.7GHz vs 3.3GHz - 20W below TDP?
15W vs 35W - 0.25MB/core more L2 cache per core?
0.5MB/core vs 0.25MB/core - 14 hour multiplier higher?
31 vs 17 - Has FMA4?
Why is Intel Core i5-8400T better than AMD A9-9425?
- 1.65x higher CPU speed?
6 x 1.7GHz vs 2 x 3.1GHz - 533MHz higher RAM speed?
2666MHz vs 2133MHz - 4 more CPU threads?
6 vs 2 - 10°C higher than maximum operating temperature?
100°C vs 90°C - Is 14nm smaller?
14nm vs 28nm - 0.5MB more L2 cache?
1.5MB vs 1MB - 4.78x higher PassMark result?
7415 vs 1552 - 188KB more L1 cache?
384KB vs 196KB
Which comparisons are the most popular?
AMD A9-9425
VS
Intel Core i5-8265U
Intel Core i5-8400T
VS
Intel Core i5+8400
9000 ITL INTEL Intel CORE I5 I5
Intel Core i5-8400T
vs
Intel Core i3-7100
AMD A9-9425
VS
Intel Core i5-8305g
Intel Core i5-8400T
VS
AMD RYZEN 5 2400G
AMD A9-9000 AMD A9000 AMD AMD A9000 AMD A9000 AMD A9000 AMD A9000 AMD A9000 AMD A9000 AMD A9000 AMD A
00040004 AMD A
AMD A
AMD A
AMD A
AMD A
AMD A
AMD A
AMD AD AMD A4-9125
Intel Core i5-8400t
VS
Intel Core i3-9100
AMD A9-9425
VS
Intel Core i5-8250U
I5-8400T 9000 VS VS VS VS Core i5-9400
AMD A9-9425
VS
AMD Ryzen 3 2200u
Intel Core i5-8400t
VS
Intel Core i5-9400t
A9-9425
INTELERON N4020 9000. 2
2
VS
Intel Core i5-6500
AMD A9-9425
VS
Intel Core i3-1005g1
Intel Core i5-8400t
VS
Intel Core I3-9300t
A
A9-0004 AMD A9000 A9000 A
0004000 A9000 A
000 A
000 A
000 A
000 A
000 A
000 A9000 A
00040004000 vs
Intel Core i7-8850H
Intel Core i5-8400t
VS
Intel Core i5-8600t
AMD A9-9425
Intel Core i5-7200u
9000 GRETEL CORE I5-8400T
VS 9000)
Comparison of prices
Users reviews
General rating
AMD A9-9425
7 Reviews of users
AMD A9-9425
6.7 /10 9000
7 Reviews0003
0 Reviews of users
Intel Core i5-8400t
0.0 /10
0 Reviews of users
Functions
Cost ratio
6.7 /10 9000
7 VOTES
Reviews Until 9000
Games
4.9 /10
7 Votes
Reviews not yet
performance
5. 9 /10
9 /10
7 VOTES
reviews yet there is no
Reliability
7.0 /10
7 Votes
Reviews yet there are no
Energy efficiency
7.9 /10
7 VOTES 9000
Performance
CPU speed
2 x 3.1GHz
6 x 1.7GHz
CPU speed indicates how many processing cycles per second a processor can perform, considering all its cores (processors). It is calculated by adding the clock speeds of each core or, in the case of multi-core processors, each group of cores.
processor thread
More threads result in better performance and better multitasking.
turbo clock speed
3.7GHz
3.3GHz
When the processor is running below its limits, it can jump to a higher clock speed to increase performance.
Has an unlocked multiplier
✖AMD A9-9425
✖Intel Core i5-8400T
Some processors come with an unlocked multiplier and are easier to overclock, allowing for better performance in games and other applications.
L2 Cache
More L2 scratchpad memory results in faster results in CPU and system performance tuning.
L3 cache
Unknown. Help us offer a price. (AMD A9-9425)
More L3 scratchpad memory results in faster results in CPU and system performance tuning.
L1 cache
More L1 cache results in faster results in CPU and system performance tuning.
L2 core
0.5MB/core
0.25MB/core
More data can be stored in L2 scratchpad for access by each processor core.
L3 core
Unknown. Help us offer a price. (AMD A9-9425)
1.5MB/core
More data can be stored in the L3 scratchpad for access by each processor core.
Geotagging
PassMark result
This benchmark measures CPU performance using multithreading.
PassMark result (single)
This benchmark measures processor performance using a thread of execution.
Geekbench 5 result (multi-core)
Geekbench 5 is a cross-platform test that measures the performance of a multi-core processor. (Source: Primate Labs, 2022)
Cinebench R20 result (multi-core)
Unknown. Help us offer a price. (Intel Core i5-8400T)
Cinebench R20 is a benchmark that measures the performance of a multi-core processor by rendering a 3D scene.
Cinebench R20 result (single core)
Unknown. Help us offer a price. (Intel Core i5-8400T)
Cinebench R20 is a test to evaluate the performance of a single core processor when rendering a 3D scene.
Geekbench 5 result (single core)
Geekbench 5 is a cross-platform benchmark that measures the single-core performance of a processor. (Source: Primate Labs, 2022)
Blender test result (bmw27)
Unknown. Help us offer a price. (AMD A9-9425)
Unknown. Help us offer a price. (Intel Core i5-8400T)
The Blender benchmark (bmw27) measures CPU performance by rendering a 3D scene. More powerful processors can render a scene in a shorter time.
Blender result (classroom)
Unknown. Help us offer a price. (AMD A9-9425)
Unknown. Help us offer a price. (Intel Core i5-8400T)
Blender (classroom) benchmark measures CPU performance by rendering a 3D scene. More powerful processors can render a scene in a shorter time.
performance per watt
This means that the processor is more efficient, giving more performance per watt of power used.
Integrated graphics
GPU clock speed
758MHz (AMD Radeon R5)
350MHz
The graphics processing unit (GPU) has a higher clock speed.
Turbo GPU
Unknown. Help us offer a price. (AMD A9-9425)
1050MHz
When the GPU is running below its limits, it can jump to a higher clock speed to increase performance.
GPU 9 actuators0003
Unknown. Help us offer a price. (AMD A9-9425)
Unknown. Help us offer a price. (Intel Core i5-8400T)
A graphics processing unit (GPU) with more execution units can provide better graphics.
monitor support
Unknown. Help us offer a price. (AMD A9-9425)
By using multiple displays, you can expand your workspace, making it easier to work across multiple applications.
DirectX version
12 (AMD Radeon R5)
DirectX is used in games with a new version that supports better graphics.
OpenGL version
4.6 (AMD Radeon R5)
The newer version of OpenGL, the better graphics quality in games.
OpenCL version
2 (AMD Radeon R5)
Some applications use OpenCL to take advantage of graphics processing unit (GPU) power for non-graphical computing. Newer versions are more functional and better quality.
texture units (TMUs)
8 (AMD Radeon R5)
Unknown. Help us offer a price. (Intel Core i5-8400T)
TMUs take texture units and map them to the geometric layout of the 3D scene. More TMUs generally means texture information is processed faster.
ROPs
4 (AMD Radeon R5)
Unknown. Help us offer a price. (Intel Core i5-8400T)
ROPs are responsible for some of the final steps of the rendering process, such as writing the final pixel data to memory and for performing other tasks such as anti-aliasing to improve the appearance of graphics.
Memory
RAM speed
2133MHz
2666MHz
Can support faster memory which speeds up system performance.
maximum memory bandwidth
Unknown. Help us offer a price. (AMD A9-9425)
41.6GB/s
This is the maximum rate at which data can be read from or stored in memory.
DDR version
DDR (Double Data Rate Synchronous Dynamic Random Access Memory) is the most common type of main memory. New versions of DDR memory support higher maximum speeds and are more energy efficient.
memory channels
More memory channels increase the speed of data transfer between memory and processor.
maximum memory
Unknown. Help us offer a price. (AMD A9-9425)
Maximum amount of memory (RAM).
bus baud rate
Unknown. Help us offer a price. (AMD A9-9425)
The bus is responsible for transferring data between various components of a computer or device.
Supports memory debug code
✖AMD A9-9425
✖Intel Core i5-8400T
Memory debug code can detect and repair data corruption. It is used when necessary to avoid distortion, such as in scientific computing or when starting a server.
eMMC version
Unknown. Help us offer a price. (AMD A9-9425)
Unknown. Help us offer a price. (Intel Core i5-8400T)
A newer version of eMMC — built-in flash memory — speeds up the memory interface, has a positive effect on device performance, for example, when transferring files from a computer to internal memory via USB.
bus frequency
Unknown. Help us offer a price. (AMD A9-9425)
Unknown. Help us offer a price. (Intel Core i5-8400T)
The bus is responsible for transferring data between various components of a computer or device
Features
uses multithreading
✖AMD A9-9425
✔Intel Core i5-8400T
into logical cores, also known as threads. Thus, each core can run two instruction streams at the same time.
Has AES
✔AMD A9-9425
✔Intel Core i5-8400T
AES is used to speed up encryption and decryption.
Has AVX
✔AMD A9-9425
✔Intel Core i5-8400T
AVX is used to help speed up calculations in multimedia, scientific and financial applications, and to improve the performance of the Linux RAID program.
version of SSE
SSE is used to speed up multimedia tasks such as editing images or adjusting audio volume. Each new version contains new instructions and improvements.
Has F16C
✔AMD A9-9425
✔Intel Core i5-8400T
F16C is used to speed up tasks such as image contrast adjustment or volume control.
bits transmitted at the same time
Unknown. Help us offer a price. (AMD A9-9425)
Unknown. Help us offer a price. (Intel Core i5-8400T)
NEON provides faster media processing such as MP3 listening.
Has MMX
✔AMD A9-9425
✔Intel Core i5-8400T
MMX is used to speed up tasks such as adjusting image contrast or adjusting volume.
Has TrustZone
✖AMD A9-9425
✖Intel Core i5-8400T
Technology is integrated into the processor to ensure device security when using features such as mobile payments and digital rights management (DRM) video streaming.
interface width
Unknown. Help us offer a price. (AMD A9-9425)
Unknown. Help us offer a price. (Intel Core i5-8400T)
The processor can decode more instructions per clock (IPC), which means that the processor performs better
Other
Has built-in LTE
✖AMD A9-9425
✖Intel Core i5- 8400T
System on a Chip (SoC) has an integrated LTE cellular chip. LTE can download at higher speeds than older 3G technologies.
flops
0.2 TFLOPS (AMD Radeon R5)
Unknown. Help us offer a price.
FLOPS is a measurement of GPU processing power.
pixel rate
3.2 GPixel/s (AMD Radeon R5)
Unknown. Help us offer a price.
The number of pixels that can be displayed on the screen every second.
texture size
6.4 GTexels/s (AMD Radeon R5)
Unknown. Help us offer a price.
The number of textured pixels that can be displayed on the screen every second.
Price comparison
Cancel
Which CPU is better?
AMD A9-9420 vs. Intel Core i5-8400
AMD A9-9420
AMD A9-9420 runs with 2 and 2 CPU threads It runs at 3.60 GHz base 3.00 GHz all cores while TDP is set to 15 W .CPU connects to CPU socket FP4 This version includes 2.00 MB of L3 cache on a single die, supports 1 to support DDR4-2133 RAM, and supports 3. 0 PCIe Gen 8 . Tjunction keeps below 90 °C degrees C. In particular, the Stoney Ridge (Excavator) architecture has been advanced over 28 nm and supports AMD-V . The product was launched Q2/2017
Intel Core i5-8400
Intel Core i5-8400 runs with 6 and 2 CPU threads It runs at 4.00 GHz base 3.80 GHz all cores while TDP is set to 65 W .CPU connects to LGA 1151-2 CPU socket This version includes 9.00 MB of L3 cache on a single die, supports 2 to support DDR4-2666 RAM, and supports 3.0 PCIe Gen 16 . Tjunction is kept below — degrees C. In particular, the Coffee Lake S architecture has been advanced over 14 nm and supports VT-x, VT-x EPT, VT-d . The product was launched Q4/2017
AMD A9-9420
Intel Core i5-8400
 80 GHz
 Intel UHD Graphics 630
 00MB
00MB Show more details
Show more details
Cinebench R20 (Single-Core)
Cinebench R20 is the successor to Cinebench R15 and is also based on the Cinema 4 Suite. Cinema 4 is software used all over the world to create 3D forms. The single-core test uses only one CPU core, the number of cores or hyper-threading capability is not taken into account.
Cinebench R20 (Multi-Core)
Cinebench R20 is the successor to Cinebench R15 and is also based on Cinema 4 Suite. Cinema 4 is software used all over the world to create 3D shapes. The multi-core test uses all the CPU cores and has a big advantage of hyper-threading.
Cinebench R15 (Single-Core)
Cinebench R15 is the successor to Cinebench 11.5 and is also based on Cinema 4 Suite. Cinema 4 is software used all over the world to create 3D shapes. The single-core test uses only one CPU core, the number of cores or hyper-threading capability is not taken into account.
Cinebench R15 (Multi-Core)
Cinebench R15 is the successor to Cinebench 11.5 and is also based on the Cinema 4 Suite. Cinema 4 is software used all over the world to create 3D shapes. The multi-core test uses all the CPU cores and has a big advantage of hyper-threading.
Geekbench 5, 64bit (Single-Core)
Geekbench 5 is a memory-intensive, cross-platform test. A fast memory will greatly push the result. The single-core test uses only one CPU core, the number of cores or hyper-threading capability is not taken into account.
Geekbench 5, 64bit (Multi-Core)
Geekbench 5 is a memory-intensive, cross-platform test. A fast memory will greatly push the result. The multi-core test uses all the CPU cores and has a big advantage of hyper-threading.
iGPU — FP32 Performance (Single-precision GFLOPS)
Theoretical processing performance of the processor’s internal graphics unit with simple precision (32 bits) in GFLOPS. GFLOPS specifies how many billions of floating point operations the iGPU can perform per second.
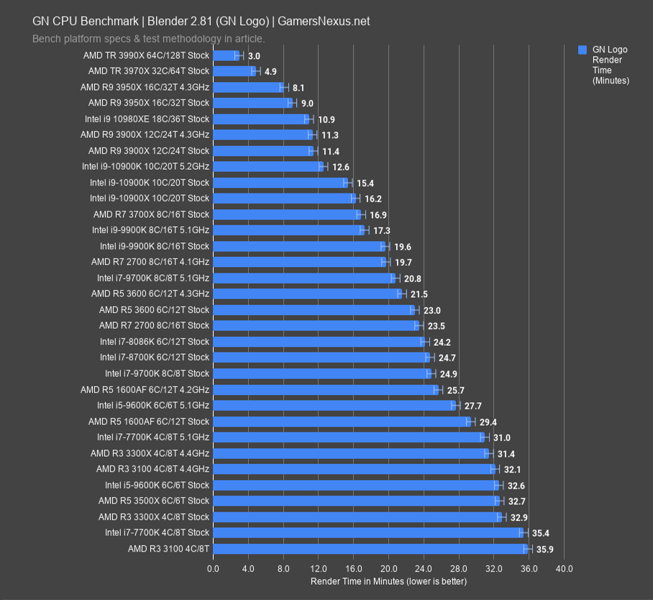
Blender 2.81 (bmw27)
Blender is a free 3D graphics software for rendering (creating) 3D bodies that can also be textured and animated in the program. The Blender test creates predefined scenes and measures the time(s) required for the entire scene. The less time it takes, the better. We chose the bmw27 as our reference scene.
Geekbench 3, 64bit (Single-Core)
Geekbench 3 is a cross-platform benchmark that is memory intensive. A fast memory will greatly push the result.![]() The single-core test uses only one CPU core, the number of cores or hyper-threading capability is not taken into account.
The single-core test uses only one CPU core, the number of cores or hyper-threading capability is not taken into account.
Geekbench 3, 64bit (Multi-Core)
Geekbench 3 is a cross-platform benchmark that is memory intensive. A fast memory will greatly push the result. The multi-core test uses all the CPU cores and has a big advantage of hyper-threading.
Cinebench R11.5, 64bit (Single-Core)
Cinebench 11.5 is based on Cinema 4D Suite, a software that is popular for creating shapes and other 3D. The single-core test uses only one CPU core, the number of cores or hyper-threading capability is not taken into account.
Cinebench R11.5, 64bit (Multi-Core)
Cinebench 11.5 is based on Cinema 4D Suite, a software that is popular for creating shapes and other things in 3D. The multi-core test uses all the CPU cores and has a big advantage of hyper-threading.
Cinebench R11.5, 64bit (iGPU, OpenGL)
Cinebench 11.5 is based on the Cinema 4D Suite, a software that is popular for creating shapes and other things in 3D.