AMD FX-4350 vs AMD FX-6300: What is the difference?
39points
AMD FX-4350
40points
AMD FX-6300
vs
64 facts in comparison
AMD FX-4350
AMD FX-6300
Why is AMD FX-4350 better than AMD FX-6300?
- 0.67MB/core more L3 cache per core?
2MB/corevs1.33MB/core
Why is AMD FX-6300 better than AMD FX-4350?
- 25% faster CPU speed?
6 x 3.5GHzvs4 x 4.2GHz - 2 more CPU threads?
6vs4 - 2MB bigger L2 cache?
6MBvs4MB - 30W lower TDP?
95Wvs125W - 1 newer version of PCI Express (PCIe)?
3vs2 - 96KB bigger L1 cache?
288KBvs192KB
Which are the most popular comparisons?
AMD FX-4350
vs
AMD Ryzen 3 3250U
AMD FX-6300
vs
Intel Core i5-3470
AMD FX-4350
vs
AMD FX-4300
AMD FX-6300
vs
Intel Core i5-4570
AMD FX-4350
vs
AMD Ryzen 5 3600
AMD FX-6300
vs
Intel Core i5-7400
AMD FX-4350
vs
AMD Ryzen 3 2200G
AMD FX-6300
vs
Intel Core i7-3770
AMD FX-4350
vs
AMD A8-5500
AMD FX-6300
vs
AMD Phenom II X4 955
AMD FX-4350
vs
AMD Ryzen 5 5600G
AMD FX-6300
vs
AMD A8-7600
AMD FX-4350
vs
AMD Ryzen 3 5300U
AMD FX-6300
vs
AMD FX-8350
AMD FX-4350
vs
AMD Ryzen 5 3500U
AMD FX-6300
vs
AMD Ryzen 5 3600
AMD FX-4350
vs
AMD Ryzen 5 5500U
AMD FX-6300
vs
AMD Ryzen 5 5500U
AMD FX-4350
vs
AMD Ryzen 5 2400G
AMD FX-6300
vs
AMD Ryzen 3 3200G
Price comparison
User reviews
Overall Rating
AMD FX-4350
0 User reviews
AMD FX-4350
0. 0/10
0 User reviews
AMD FX-6300
2 User reviews
AMD FX-6300
9.5/10
2 User reviews
Features
Value for money
No reviews yet
9.0/10
2 votes
Gaming
No reviews yet
8.0/10
2 votes
Performance
No reviews yet
8.5/10
2 votes
Reliability
No reviews yet
8.5/10
2 votes
Energy efficiency
No reviews yet
7.5/10
2 votes
Performance
1.CPU speed
4 x 4.2GHz
6 x 3.5GHz
The CPU speed indicates how many processing cycles per second can be executed by a CPU, considering all of its cores (processing units). It is calculated by adding the clock rates of each core or, in the case of multi-core processors employing different microarchitectures, of each group of cores.
2. CPU threads
More threads result in faster performance and better multitasking.
3.turbo clock speed
4.3GHz
4.1GHz
When the CPU is running below its limitations, it can boost to a higher clock speed in order to give increased performance.
4.Has an unlocked multiplier
✔AMD FX-4350
✔AMD FX-6300
Some processors come with an unlocked multiplier which makes them easy to overclock, allowing you to gain increased performance in games and other apps.
5.L2 cache
A larger L2 cache results in faster CPU and system-wide performance.
6.L3 cache
A larger L3 cache results in faster CPU and system-wide performance.
7.L1 cache
A larger L1 cache results in faster CPU and system-wide performance.
8.L2 core
1MB/core
1MB/core
More data can be stored in the L2 cache for access by each core of the CPU.
9.L3 core
2MB/core
1.33MB/core
More data can be stored in the L3 cache for access by each core of the CPU.
Memory
1.RAM speed
1866MHz
1866MHz
It can support faster memory, which will give quicker system performance.
2.maximum memory bandwidth
21GB/s
21GB/s
This is the maximum rate that data can be read from or stored into memory.
3.DDR memory version
Unknown. Help us by suggesting a value. (AMD FX-4350)
DDR (Double Data Rate) memory is the most common type of RAM. Newer versions of DDR memory support higher maximum speeds and are more energy-efficient.
4.memory channels
More memory channels increases the speed of data transfer between the memory and the CPU.
5.maximum memory amount
Unknown. Help us by suggesting a value. (AMD FX-4350)
Unknown. Help us by suggesting a value. (AMD FX-6300)
The maximum amount of memory (RAM) supported.
6.bus transfer rate
5.4GT/s
5.4GT/s
The bus is responsible for transferring data between different components of a computer or device.
7.Supports ECC memory
✖AMD FX-4350
✖AMD FX-6300
Error-correcting code memory can detect and correct data corruption. It is used when is it essential to avoid corruption, such as scientific computing or when running a server.
8.eMMC version
Unknown. Help us by suggesting a value. (AMD FX-4350)
Unknown. Help us by suggesting a value. (AMD FX-6300)
A higher version of eMMC allows faster memory interfaces, having a positive effect on the performance of a device. For example, when transferring files from your computer to the internal storage over USB.
9.bus speed
Unknown. Help us by suggesting a value. (AMD FX-4350)
Unknown. Help us by suggesting a value. (AMD FX-6300)
The bus is responsible for transferring data between different components of a computer or device.
Benchmarks
1.PassMark result
Unknown. Help us by suggesting a value. (AMD FX-4350)
This benchmark measures the performance of the CPU using multiple threads.
2.PassMark result (single)
Unknown. Help us by suggesting a value. (AMD FX-4350)
This benchmark measures the performance of the CPU using a single thread.
3.Geekbench 5 result (multi)
Unknown. Help us by suggesting a value. (AMD FX-4350)
Unknown. Help us by suggesting a value. (AMD FX-6300)
Geekbench 5 is a cross-platform benchmark that measures a processor’s multi-core performance. (Source: Primate Labs, 2022)
4. Cinebench R20 (multi) result
Unknown. Help us by suggesting a value. (AMD FX-4350)
Unknown. Help us by suggesting a value. (AMD FX-6300)
Cinebench R20 is a benchmark tool that measures a CPU’s multi-core performance by rendering a 3D scene.
5.Cinebench R20 (single) result
Unknown. Help us by suggesting a value. (AMD FX-4350)
Unknown. Help us by suggesting a value. (AMD FX-6300)
Cinebench R20 is a benchmark tool that measures a CPU’s single-core performance by rendering a 3D scene.
6.Geekbench 5 result (single)
Unknown. Help us by suggesting a value. (AMD FX-4350)
Unknown. Help us by suggesting a value. (AMD FX-6300)
Geekbench 5 is a cross-platform benchmark that measures a processor’s single-core performance. (Source: Primate Labs, 2022)
7.Blender (bmw27) result
Unknown. Help us by suggesting a value. (AMD FX-4350)
Unknown. Help us by suggesting a value. (AMD FX-6300)
The Blender (bmw27) benchmark measures the performance of a processor by rendering a 3D scene. More powerful processors can render the scene in less time.
8.Blender (classroom) result
Unknown. Help us by suggesting a value. (AMD FX-4350)
Unknown. Help us by suggesting a value. (AMD FX-6300)
The Blender (classroom) benchmark measures the performance of a processor by rendering a 3D scene. More powerful processors can render the scene in less time.
9.performance per watt
Unknown. Help us by suggesting a value. (AMD FX-4350)
This means the CPU is more efficient, giving a greater amount of performance for each watt of power used.
Features
1.uses multithreading
✖AMD FX-4350
✖AMD FX-6300
Multithreading technology (such as Intel’s Hyperthreading or AMD’s Simultaneous Multithreading) provides increased performance by splitting each of the processor’s physical cores into virtual cores, also known as threads. This way, each core can run two instruction streams at once.
2.Has AES
✔AMD FX-4350
✔AMD FX-6300
AES is used to speed up encryption and decryption.
3.Has AVX
✔AMD FX-4350
✔AMD FX-6300
AVX is used to help speed up calculations in multimedia, scientific and financial apps, as well as improving Linux RAID software performance.
4.SSE version
SSE is used to speed up multimedia tasks such as editing an image or adjusting audio volume. Each new version contains new instructions and improvements.
5.Has F16C
✔AMD FX-4350
✔AMD FX-6300
F16C is used to speed up tasks such as adjusting the contrast of an image or adjusting volume.
6.bits executed at a time
Unknown. Help us by suggesting a value. (AMD FX-4350)
Unknown. Help us by suggesting a value. (AMD FX-6300)
NEON provides acceleration for media processing, such as listening to MP3s.
7.Has MMX
✔AMD FX-4350
✔AMD FX-6300
MMX is used to speed up tasks such as adjusting the contrast of an image or adjusting volume.
8.Has TrustZone
✖AMD FX-4350
✖AMD FX-6300
A technology integrated into the processor to secure the device for use with features such as mobile payments and streaming video using digital rights management (DRM).
9.front-end width
Unknown. Help us by suggesting a value. (AMD FX-4350)
Unknown. Help us by suggesting a value. (AMD FX-6300)
The CPU can decode more instructions per clock (IPC), meaning that the CPU performs better
Price comparison
Cancel
Which are the best CPUs?
AMD FX-4350 vs AMD FX-6300
Comparative analysis of AMD FX-4350 and AMD FX-6300 processors for all known characteristics in the following categories: Essentials, Performance, Memory, Compatibility, Peripherals, Advanced Technologies, Virtualization.
Benchmark processor performance analysis: PassMark — Single thread mark, PassMark — CPU mark, Geekbench 4 — Single Core, Geekbench 4 — Multi-Core, CompuBench 1.5 Desktop — Face Detection (mPixels/s), CompuBench 1.5 Desktop — Ocean Surface Simulation (Frames/s), CompuBench 1.5 Desktop — T-Rex (Frames/s), CompuBench 1.5 Desktop — Bitcoin Mining (mHash/s), 3DMark Fire Strike — Physics Score, CompuBench 1.5 Desktop — Video Composition (Frames/s).
AMD FX-4350
Buy on Amazon
vs
AMD FX-6300
Buy on Amazon
Differences
Reasons to consider the AMD FX-4350
- CPU is newer: launch date 6 month(s) later
- Processor is unlocked, an unlocked multiplier allows for easier overclocking
- Around 13% higher clock speed: 4.3 GHz vs 3.8 GHz
- Around 8% better performance in PassMark — Single thread mark: 1605 vs 1489
- Around 9% better performance in Geekbench 4 — Single Core: 572 vs 527
| Launch date | April 2013 vs October 2012 |
| Unlocked | Unlocked vs Locked |
| Maximum frequency | 4. 3 GHz vs 3.8 GHz 3 GHz vs 3.8 GHz |
| PassMark — Single thread mark | 1605 vs 1489 |
| Geekbench 4 — Single Core | 572 vs 527 |
Reasons to consider the AMD FX-6300
- 2 more cores, run more applications at once: 6 vs 4
- 2 more threads: 6 vs 4
- Around 15% higher maximum core temperature: 70.50°C vs 61.10°C
- Around 50% more L1 cache; more data can be stored in the L1 cache for quick access later
- Around 50% more L2 cache; more data can be stored in the L2 cache for quick access later
- Around 32% lower typical power consumption: 95 Watt vs 125 Watt
- Around 28% better performance in PassMark — CPU mark: 4176 vs 3267
- Around 20% better performance in Geekbench 4 — Multi-Core: 1914 vs 1589
- Around 27% better performance in CompuBench 1.
 5 Desktop — Face Detection (mPixels/s): 6.905 vs 5.452
 - Around 38% better performance in CompuBench 1.5 Desktop — Ocean Surface Simulation (Frames/s): 16.195 vs 11.727
- Around 63% better performance in CompuBench 1.5 Desktop — T-Rex (Frames/s): 0.339 vs 0.208
- Around 35% better performance in CompuBench 1.5 Desktop — Bitcoin Mining (mHash/s): 4.767 vs 3.54
| Number of cores | 6 vs 4 |
| Number of threads | 6 vs 4 |
| Maximum core temperature | 70.50°C vs 61.10°C |
| L1 cache | 288 KB vs 192 KB |
| L2 cache | 6 MB vs 4 MB |
| Thermal Design Power (TDP) | 95 Watt vs 125 Watt |
| PassMark — CPU mark | 4176 vs 3267 |
| Geekbench 4 — Multi-Core | 1914 vs 1589 |
CompuBench 1. 5 Desktop — Face Detection (mPixels/s) 5 Desktop — Face Detection (mPixels/s) |
6.905 vs 5.452 |
| CompuBench 1.5 Desktop — Ocean Surface Simulation (Frames/s) | 16.195 vs 11.727 |
| CompuBench 1.5 Desktop — T-Rex (Frames/s) | 0.339 vs 0.208 |
| CompuBench 1.5 Desktop — Bitcoin Mining (mHash/s) | 4.767 vs 3.54 |
Compare benchmarks
CPU 1: AMD FX-4350
CPU 2: AMD FX-6300
| PassMark — Single thread mark |
|
|
||||
| PassMark — CPU mark |
|
|
||||
| Geekbench 4 — Single Core |
|
|
||||
| Geekbench 4 — Multi-Core |
|
|
||||
CompuBench 1. 5 Desktop — Face Detection (mPixels/s) 5 Desktop — Face Detection (mPixels/s) |
|
|
||||
| CompuBench 1.5 Desktop — Ocean Surface Simulation (Frames/s) |
|
|
||||
| CompuBench 1.5 Desktop — T-Rex (Frames/s) |
|
|
||||
CompuBench 1. 5 Desktop — Bitcoin Mining (mHash/s) 5 Desktop — Bitcoin Mining (mHash/s) |
|
|
| Name | AMD FX-4350 | AMD FX-6300 |
|---|---|---|
| PassMark — Single thread mark | 1605 | 1489 |
| PassMark — CPU mark | 3267 | 4176 |
| Geekbench 4 — Single Core | 572 | 527 |
| Geekbench 4 — Multi-Core | 1589 | 1914 |
CompuBench 1. 5 Desktop — Face Detection (mPixels/s) 5 Desktop — Face Detection (mPixels/s) |
5.452 | 6.905 |
| CompuBench 1.5 Desktop — Ocean Surface Simulation (Frames/s) | 11.727 | 16.195 |
| CompuBench 1.5 Desktop — T-Rex (Frames/s) | 0.208 | 0.339 |
| CompuBench 1.5 Desktop — Bitcoin Mining (mHash/s) | 3.54 | 4.767 |
| 3DMark Fire Strike — Physics Score | 2098 | |
| CompuBench 1.5 Desktop — Video Composition (Frames/s) | 0. 85 85 |
Compare specifications (specs)
| AMD FX-4350 | AMD FX-6300 | |
|---|---|---|
| Architecture codename | Vishera | Vishera |
| Family | AMD FX-Series Processors | AMD FX-Series Processors |
| Launch date | April 2013 | October 2012 |
| OPN PIB | FD4350FRHKBOX | FD6300WMHKBOX |
| OPN Tray | FD4350FRW4KHK | FD6300WMW6KHK |
| Place in performance rating | 1979 | 1981 |
| Price now | $129. 99 99 |
$58.99 |
| Series | AMD FX 4-Core Black Edition Processors | AMD FX 6-Core Black Edition Processors |
| Value for money (0-100) | 12.09 | 31.81 |
| Vertical segment | Desktop | Desktop |
| 64 bit support | ||
| Base frequency | 4.2 GHz | 3.5 GHz |
| Die size | 315 mm | 315 mm |
| L1 cache | 192 KB | 288 KB |
| L2 cache | 4 MB | 6 MB |
| L3 cache | 8 MB | 8 MB |
| Manufacturing process technology | 32 nm SOI | 32 nm SOI |
| Maximum core temperature | 61. 10°C 10°C |
70.50°C |
| Maximum frequency | 4.3 GHz | 3.8 GHz |
| Number of cores | 4 | 6 |
| Number of threads | 4 | 6 |
| P0 Vcore voltage | Min: 1.275 V — Max: 1.4 V | Min: 1.15 V — Max: 1.3875 V |
| Transistor count | 1200 million | 1200 million |
| Unlocked | ||
| Supported memory frequency | 1866 MHz | 1866 MHz |
| Supported memory types | DDR3 | DDR3 |
| Max number of CPUs in a configuration | 1 | 1 |
| Sockets supported | AM3+ | AM3+ |
| Thermal Design Power (TDP) | 125 Watt | 95 Watt |
| PCI Express revision | n / a | 3. 0 0 |
| Fused Multiply-Add (FMA) | ||
| Intel® Advanced Vector Extensions (AVX) | ||
| Intel® AES New Instructions | ||
| Fused Multiply-Add 4 (FMA4) | ||
| AMD Virtualization (AMD-V™) |
Navigation
Choose a CPU
Compare processors
Compare AMD FX-4350 with others
AMD
FX-4350
vs
Intel
Core 2 Duo E8300
AMD
FX-4350
vs
Intel
Core i7-975
AMD
FX-4350
vs
Intel
Core i7-950
AMD
FX-4350
vs
AMD
Phenom II X4 820
AMD
FX-4350
vs
AMD
Phenom II X4 975 BE
AMD
FX-4350
vs
AMD
FX-6300
| 1 | 2020 | AMD Ryzen 9 5950X
>> compare FX-4350 vs Ryzen 9 5950X |
$ 710. 0 0 |
||||
| 2 | 2021 | Intel Core i7-12700K
>> compare FX-4350 vs Core i7-12700K |
$ 470.0 | ||||
| 3 | 2021 | Intel Core i9-12900K
>> compare FX-4350 vs Core i9-12900K |
$ 590.0 | ||||
| 4 | 2022 | AMD Ryzen 7 5800X3D
>> compare FX-4350 vs Ryzen 7 5800X3D |
$ 450.0 | ||||
| 5 | 2021 | Intel Core i9-11900K
>> compare FX-4350 vs Core i9-11900K |
$ 488.0 | ||||
| 6 | 2020 | AMD Ryzen 9 5900X
>> compare FX-4350 vs Ryzen 9 5900X |
$ 499.0 | ||||
| 7 | 2021 | Intel Core i5-12600K
>> compare FX-4350 vs Core i5-12600K |
$ 290. 0 0 |
||||
| 8 | 2020 | AMD Ryzen 7 5800X
>> compare FX-4350 vs Ryzen 7 5800X |
$ 399.0 | ||||
| 9 | 2021 | Intel Core i7-11700K
>> compare FX-4350 vs Core i7-11700K |
$ 410.0 | ||||
| 10 | 2020 | AMD Ryzen 5 5600X
>> compare FX-4350 vs Ryzen 5 5600X |
$ 299.0 | ||||
| 11 | 2020 | Intel Core i9-10900K
>> compare FX-4350 vs Core i9-10900K |
$ 590.0 | ||||
| 12 | 2020 | Intel Core i7-10700K
>> compare FX-4350 vs Core i7-10700K |
$ 409.1 | ||||
| 13 | 2018 | Intel Core i9-9900K @ 3. 60GHz 60GHz
>> compare FX-4350 vs i9-9900K |
$ 835.0 | ||||
| 14 | 2021 | Intel Core i5-11600K
>> compare FX-4350 vs Core i5-11600K |
$ 262.0 | ||||
| 15 | 2018 | Intel Core i9-9900 @ 3.10GHz
>> compare FX-4350 vs i9-9900 |
$ 440.0 | ||||
| 16 | 2022 | Intel Core i5-12400
>> compare FX-4350 vs Core i5-12400 |
$ 143.0 | ||||
| 17 | 2018 | Intel Core i7-9700K @ 3.60GHz
>> compare FX-4350 vs i7-9700K |
$ 410.0 | ||||
| 18 | 2021 | Intel Core i5-11400
>> compare FX-4350 vs Core i5-11400 |
$ 182. 0 0 |
||||
| 19 | 2018 | Intel Core i7-9700F @ 3.00GHz
>> compare FX-4350 vs i7-9700F |
$ 368.0 | ||||
| 20 | 2020 | Intel Core i5-10600K
>> compare FX-4350 vs Core i5-10600K |
$ 236.8 | ||||
| 21 | 2018 | Intel Core i7-8086K @ 4.00GHz
>> compare FX-4350 vs i7-8086K |
$ 553.0 | ||||
| 22 | 2018 | Intel Core i7-9700 @ 3.00GHz
>> compare FX-4350 vs i7-9700 |
$ 330.0 | ||||
| 23 | 2017 | Intel Core i7-8700K @ 3.70GHz
>> compare FX-4350 vs i7-8700K |
$ 369.9 | ||||
| 24 | 2017 | Intel Core i9-7940X @ 3. 10GHz 10GHz
>> compare FX-4350 vs i9-7940X |
$ 1,192.1 | ||||
| 25 | 2019 | AMD Ryzen 9 3950X
>> compare FX-4350 vs Ryzen 9 3950X |
$ 750.0 | ||||
| 26 | 2020 | Intel Core i5-10400
>> compare FX-4350 vs Core i5-10400 |
$ 182.0 | ||||
| 27 | 2019 | AMD Ryzen 9 3900X
>> compare FX-4350 vs Ryzen 9 3900X |
$ 499.0 | ||||
| 28 | 2019 | AMD Ryzen 7 3700X
>> compare FX-4350 vs Ryzen 7 3700X |
$ 330.0 | ||||
| 29 | 2019 | AMD Ryzen 7 3800X
>> compare FX-4350 vs Ryzen 7 3800X |
$ 399.0 | ||||
| 30 | 2019 | AMD Ryzen 5 3600X
>> compare FX-4350 vs Ryzen 5 3600X |
$ 249. 0 0 |
||||
| 31 | 2018 | Intel Core i5-9600K @ 3.70GHz
>> compare FX-4350 vs i5-9600K |
$ 280.0 | ||||
| 32 | 2019 | AMD Ryzen 5 3600
>> compare FX-4350 vs Ryzen 5 3600 |
$ 199.0 | ||||
| 33 | 2018 | Intel Core i5-9600KF @ 3.70GHz
>> compare FX-4350 vs i5-9600KF |
$ 215.0 | ||||
| 34 | 2022 | AMD Ryzen 7 5700X
>> compare FX-4350 vs Ryzen 7 5700X |
$ 300.0 | ||||
| 35 | 2022 | AMD Ryzen 5 5500
>> compare FX-4350 vs Ryzen 5 5500 |
$ 160.0 | ||||
| 36 | 2022 | Intel Core i3-12300
>> compare FX-4350 vs Core i3-12300 |
$ 143. 0 0 |
||||
| 37 | 2017 | Intel Core i5-8600K @ 3.60GHz
>> compare FX-4350 vs i5-8600K |
$ 377.7 | ||||
| 38 | 2017 | Intel Core i9-7900X @ 3.30GHz
>> compare FX-4350 vs i9-7900X |
$ 1,380.0 | ||||
| 39 | 2017 | Intel Core i9-7980XE @ 2.60GHz
>> compare FX-4350 vs i9-7980XE |
$ 2,005.5 | ||||
| 40 | 2019 | AMD Ryzen 5 3500X
>> compare FX-4350 vs Ryzen 5 3500X |
$ 160.5 | ||||
| 41 | 2022 | Intel Core i3-12100
>> compare FX-4350 vs Core i3-12100 |
$ 122.0 | ||||
| 42 | 2017 | Intel Core i7-8700 @ 3. 20GHz 20GHz
>> compare FX-4350 vs i7-8700 |
$ 454.5 | ||||
| 43 | 2017 | Intel Core i9-7920X @ 2.90GHz
>> compare FX-4350 vs i9-7920X |
$ 1,096.7 | ||||
| 44 | 2017 | Intel Core i9-7960X @ 2.80GHz
>> compare FX-4350 vs i9-7960X |
$ 2,000.0 | ||||
| 45 | 2019 | Intel Core i5-9400F @ 2.90GHz
>> compare FX-4350 vs i5-9400F |
$ 170.0 | ||||
| 46 | 2019 | Intel Core i5-9400 @ 2.90GHz
>> compare FX-4350 vs i5-9400 |
$ 170.0 | ||||
| 47 | 2021 | Intel Core i3-11300
>> compare FX-4350 vs Core i3-11300 |
$ 143. 0 0 |
||||
| 48 | 2019 | AMD Ryzen 5 3500
>> compare FX-4350 vs Ryzen 5 3500 |
$ 148.0 | ||||
| 49 | 2018 | Intel Core i5-8600 @ 3.10GHz
>> compare FX-4350 vs i5-8600 |
$ 244.5 | ||||
| 50 | 2017 | Intel Core i7-7740X @ 4.30GHz
>> compare FX-4350 vs i7-7740X |
$ 349.0 | ||||
| 51 | 2020 | AMD Ryzen 3 3300X
>> compare FX-4350 vs Ryzen 3 3300X |
$ 120.0 | ||||
| 52 | 2020 | AMD Ryzen 3 3100
>> compare FX-4350 vs Ryzen 3 3100 |
$ 90.0 | ||||
| 53 | 2021 | Intel Core i3-11100
>> compare FX-4350 vs Core i3-11100 |
$ 122. 0 0 |
||||
| 54 | 2020 | Intel Core i3-10300
>> compare FX-4350 vs Core i3-10300 |
$ 143.0 | ||||
| 55 | 2018 | AMD Ryzen Threadripper 2950X
>> compare FX-4350 vs Ryzen Threadripper 2950X |
$ 900.0 | ||||
| 56 | 2018 | Intel Core i5-8500 @ 3.00GHz
>> compare FX-4350 vs i5-8500 |
$ 239.0 | ||||
| 57 | 2016 | Intel Core i7-7700K @ 4.20GHz
>> compare FX-4350 vs i7-7700K |
$ 355.0 | ||||
| 58 | 2017 | Intel Core i7-7820X @ 3.60GHz
>> compare FX-4350 vs i7-7820X |
$ 930.0 | ||||
| 59 | 2014 | Intel Core i7-4790K @ 4. 00GHz 00GHz
>> compare FX-4350 vs i7-4790K |
$ 307.0 | ||||
| 60 | 2020 | Intel Core i3-10100
>> compare FX-4350 vs Core i3-10100 |
$ 122.0 | ||||
| 61 | 2018 | AMD Ryzen Threadripper 2990WX
>> compare FX-4350 vs Ryzen Threadripper 2990WX |
$ 1,720.0 | ||||
| 62 | 2017 | Intel Core i5-7640X @ 4.00GHz
>> compare FX-4350 vs i5-7640X |
$ 250.0 | ||||
| 63 | 2017 | Intel Core i5-8400 @ 2.80GHz
>> compare FX-4350 vs i5-8400 |
$ 200.0 | ||||
| 64 | 2019 | Intel Core i3-9350KF @ 4.00GHz
>> compare FX-4350 vs i3-9350KF |
$ 224. 0 0 |
||||
| 65 | 2019 | Intel Core i3-9320 @ 3.70GHz
>> compare FX-4350 vs i3-9320 |
$ 162.0 | ||||
| 66 | 2017 | Intel Core i3-8350K @ 4.00GHz
>> compare FX-4350 vs i3-8350K |
$ 184.0 | ||||
| 67 | 2019 | Intel Core i3-9100F @ 3.60GHz
>> compare FX-4350 vs i3-9100F |
$ 105.0 | ||||
| 68 | 2019 | Intel Core i3-9100 @ 3.60GHz
>> compare FX-4350 vs i3-9100 |
$ 170.0 | ||||
| 69 | 2017 | Intel Core i5-7600K @ 3.80GHz
>> compare FX-4350 vs i5-7600K |
$ 251.0 | ||||
| 70 | 2016 | Intel Core i7-6950X @ 3. 00GHz 00GHz
>> compare FX-4350 vs i7-6950X |
$ 1,576.0 | ||||
| 71 | 2017 | AMD Ryzen Threadripper 1950X
>> compare FX-4350 vs Ryzen Threadripper 1950X |
$ 680.0 | ||||
| 72 | 2015 | Intel Core i7-6700K @ 4.00GHz
>> compare FX-4350 vs i7-6700K |
$ 335.0 | ||||
| 73 | 2016 | Intel Core i7-6900K @ 3.20GHz
>> compare FX-4350 vs i7-6900K |
$ 1,200.0 | ||||
| 74 | 2017 | Intel Core i7-7800X @ 3.50GHz
>> compare FX-4350 vs i7-7800X |
$ 370.0 | ||||
| 75 | 2018 | AMD Ryzen 7 2700X
>> compare FX-4350 vs Ryzen 7 2700X |
$ 305. |
||||
| 76 | 2018 | Intel Core i3-8300 @ 3.70GHz
>> compare FX-4350 vs i3-8300 |
$ 179.4 | ||||
| 77 | 2016 | Intel Core i7-7700 @ 3.60GHz
>> compare FX-4350 vs i7-7700 |
$ 325.1 | ||||
| 78 | 2017 | Intel Core i5-7600 @ 3.50GHz
>> compare FX-4350 vs i5-7600 |
$ 240.0 | ||||
| 79 | 2015 | Intel Core i7-6700 @ 3.40GHz
>> compare FX-4350 vs i7-6700 |
$ 433.7 | ||||
| 80 | 2016 | Intel Core i7-6800K @ 3.40GHz
>> compare FX-4350 vs i7-6800K |
$ 420.0 | ||||
| 81 | 2017 | Intel Core i3-8100 @ 3. 60GHz 60GHz
>> compare FX-4350 vs i3-8100 |
$ 130.0 | ||||
| 82 | 2013 | Intel Core i7-4770K @ 3.50GHz
>> compare FX-4350 vs i7-4770K |
$ 285.0 | ||||
| 83 | 2014 | Intel Core i7-4790 @ 3.60GHz
>> compare FX-4350 vs i7-4790 |
$ 279.0 | ||||
| 84 | 2015 | Intel Core i7-5775C @ 3.30GHz
>> compare FX-4350 vs i7-5775C |
$ 450.0 | ||||
| 85 | 2014 | Intel Core i7-5930K @ 3.50GHz
>> compare FX-4350 vs i7-5930K |
$ 499.0 | ||||
| 86 | 2016 | Intel Core i7-6850K @ 3.60GHz
>> compare FX-4350 vs i7-6850K |
$ 550. 0 0 |
||||
| 87 | 2018 | AMD Ryzen 5 2600X
>> compare FX-4350 vs Ryzen 5 2600X |
$ 210.0 | ||||
| 88 | 2017 | AMD Ryzen Threadripper 1920X
>> compare FX-4350 vs Ryzen Threadripper 1920X |
$ 420.0 | ||||
| 89 | 2013 | Intel Core i7-4770 @ 3.40GHz
>> compare FX-4350 vs i7-4770 |
$ 240.0 | ||||
| 90 | 2013 | Intel Core i7-4771 @ 3.50GHz
>> compare FX-4350 vs i7-4771 |
$ 300.0 | ||||
| 91 | 2014 | Intel Core i7-4790S @ 3.20GHz
>> compare FX-4350 vs i7-4790S |
$ 342.6 | ||||
| 92 | 2018 | AMD Ryzen 7 2700
>> compare FX-4350 vs Ryzen 7 2700 |
$ 249. 2 2 |
||||
| 93 | 2017 | AMD Ryzen Threadripper 1900X
>> compare FX-4350 vs Ryzen Threadripper 1900X |
$ 350.0 | ||||
| 94 | 2013 | Intel Core i7-4770S @ 3.10GHz
>> compare FX-4350 vs i7-4770S |
$ 250.0 | ||||
| 95 | 2013 | Intel Core i7-4960X @ 3.60GHz
>> compare FX-4350 vs i7-4960X |
$ 770.0 | ||||
| 96 | 2014 | Intel Core i5-4690 @ 3.50GHz
>> compare FX-4350 vs i5-4690 |
$ 200.0 | ||||
| 97 | 2014 | Intel Core i5-4690K @ 3.50GHz
>> compare FX-4350 vs i5-4690K |
$ 200.0 | ||||
| 98 | 2014 | Intel Core i5-4690S @ 3. 20GHz 20GHz
>> compare FX-4350 vs i5-4690S |
$ 269.9 | ||||
| 99 | 2015 | Intel Core i5-6600K @ 3.50GHz
>> compare FX-4350 vs i5-6600K |
$ 288.9 | ||||
| 100 | 2016 | Intel Core i5-7500 @ 3.40GHz
>> compare FX-4350 vs i5-7500 |
$ 210.0 | ||||
| 101 | 2014 | Intel Core i7-5820K @ 3.30GHz
>> compare FX-4350 vs i7-5820K |
$ 300.0 | ||||
| 102 | 2014 | Intel Core i7-5960X @ 3.00GHz
>> compare FX-4350 vs i7-5960X |
$ 770.0 | ||||
| 103 | 2018 | AMD Ryzen 5 2600
>> compare FX-4350 vs Ryzen 5 2600 |
$ 150. 0 0 |
||||
| 104 | 2017 | AMD Ryzen 7 1800X
>> compare FX-4350 vs Ryzen 7 1800X |
$ 250.0 | ||||
| 105 | 2012 | Intel Core i7-3970X @ 3.50GHz
>> compare FX-4350 vs i7-3970X |
$ 954.0 | ||||
| 106 | 2017 | AMD Ryzen 5 1600X
>> compare FX-4350 vs Ryzen 5 1600X |
$ 178.4 | ||||
| 107 | 2017 | Intel Core i3-7350K @ 4.20GHz
>> compare FX-4350 vs i3-7350K |
$ 230.0 | ||||
| 108 | 2013 | Intel Core i5-4670 @ 3.40GHz
>> compare FX-4350 vs i5-4670 |
$ 188.0 | ||||
| 109 | 2013 | Intel Core i5-4670K @ 3. 40GHz 40GHz
>> compare FX-4350 vs i5-4670K |
$ 250.0 | ||||
| 110 | 2018 | Intel Core i5-4670R @ 3.00GHz
>> compare FX-4350 vs i5-4670R |
$ 276.0 | ||||
| 111 | 2015 | Intel Core i5-5675C @ 3.10GHz
>> compare FX-4350 vs i5-5675C |
$ 400.0 | ||||
| 112 | 2015 | Intel Core i5-6600 @ 3.30GHz
>> compare FX-4350 vs i5-6600 |
$ 220.0 | ||||
| 113 | 2012 | Intel Core i7-3770 @ 3.40GHz
>> compare FX-4350 vs i7-3770 |
$ 179.0 | ||||
| 114 | 2012 | Intel Core i7-3770K @ 3.50GHz
>> compare FX-4350 vs i7-3770K |
$ 249. 0 0 |
||||
| 115 | 2011 | Intel Core i7-3960X @ 3.30GHz
>> compare FX-4350 vs i7-3960X |
$ 800.0 | ||||
| 116 | 2013 | Intel Core i7-4930K @ 3.40GHz
>> compare FX-4350 vs i7-4930K |
$ 399.0 | ||||
| 117 | 2014 | Intel Core i5-4590 @ 3.30GHz
>> compare FX-4350 vs i5-4590 |
$ 185.0 | ||||
| 118 | 2017 | AMD Ryzen 7 1700X
>> compare FX-4350 vs Ryzen 7 1700X |
$ 200.0 | ||||
| 119 | 2017 | Intel Core i3-7320 @ 4.10GHz
>> compare FX-4350 vs i3-7320 |
$ 174.8 | ||||
| 120 | 2013 | Intel Core i5-4570 @ 3. 20GHz 20GHz
>> compare FX-4350 vs i5-4570 |
$ 175.0 | ||||
| 121 | 2014 | Intel Core i5-4590S @ 3.00GHz
>> compare FX-4350 vs i5-4590S |
$ 198.0 | ||||
| 122 | 2017 | Intel Core i5-7400 @ 3.00GHz
>> compare FX-4350 vs i5-7400 |
$ 213.5 | ||||
| 123 | 2011 | Intel Core i7-2700K @ 3.50GHz
>> compare FX-4350 vs i7-2700K |
$ 200.0 | ||||
| 124 | 2012 | Intel Core i7-3770S @ 3.10GHz
>> compare FX-4350 vs i7-3770S |
$ 200.0 | ||||
| 125 | 2011 | Intel Core i7-3930K @ 3.20GHz
>> compare FX-4350 vs i7-3930K |
$ 399. 0 0 |
||||
| 126 | 2013 | Intel Core i7-4820K @ 3.70GHz
>> compare FX-4350 vs i7-4820K |
$ 500.0 | ||||
| 127 | 2019 | AMD Ryzen 5 3400G
>> compare FX-4350 vs Ryzen 5 3400G |
$ 150.0 | ||||
| 128 | 2017 | Intel Core i3-7300 @ 4.00GHz
>> compare FX-4350 vs i3-7300 |
$ 210.0 | ||||
| 129 | 2017 | AMD Ryzen 5 1500X
>> compare FX-4350 vs Ryzen 5 1500X |
$ 144.9 | ||||
| 130 | 2017 | AMD Ryzen 5 1600
>> compare FX-4350 vs Ryzen 5 1600 |
$ 155.0 | ||||
| 131 | 2018 | AMD Ryzen 5 2400G
>> compare FX-4350 vs Ryzen 5 2400G |
$ 159. 0 0 |
||||
| 132 | 2017 | AMD Ryzen 7 1700
>> compare FX-4350 vs Ryzen 7 1700 |
$ 190.0 | ||||
| 133 | 2015 | Intel Core i5-6500 @ 3.20GHz
>> compare FX-4350 vs i5-6500 |
$ 234.4 | ||||
| 134 | 2010 | Intel Core i7-2600 @ 3.40GHz
>> compare FX-4350 vs i7-2600 |
$ 150.0 | ||||
| 135 | 2010 | Intel Core i7-2600K @ 3.40GHz
>> compare FX-4350 vs i7-2600K |
$ 198.0 | ||||
| 136 | 2012 | Intel Core i7-3820 @ 3.60GHz
>> compare FX-4350 vs i7-3820 |
$ 200.0 | ||||
| 137 | 2019 | AMD Ryzen 3 3200G
>> compare FX-4350 vs Ryzen 3 3200G |
$ 99. 0 0 |
||||
| 138 | 2012 | Intel Core i5-3570 @ 3.40GHz
>> compare FX-4350 vs i5-3570 |
$ 140.0 | ||||
| 139 | 2012 | Intel Core i5-3570K @ 3.40GHz
>> compare FX-4350 vs i5-3570K |
$ 144.0 | ||||
| 140 | 2013 | Intel Core i5-4570S @ 2.90GHz
>> compare FX-4350 vs i5-4570S |
$ 221.6 | ||||
| 141 | 2016 | Intel Core i5-6402P @ 2.80GHz
>> compare FX-4350 vs i5-6402P |
$ 190.0 | ||||
| 142 | 2018 | AMD Ryzen 3 2200G
>> compare FX-4350 vs Ryzen 3 2200G |
$ 98.0 | ||||
| 143 | 2017 | Intel Core i3-7100 @ 3. 90GHz 90GHz
>> compare FX-4350 vs i3-7100 |
$ 170.0 | ||||
| 144 | 2012 | Intel Core i5-3550 @ 3.30GHz
>> compare FX-4350 vs i5-3550 |
$ 330.0 | ||||
| 145 | 2012 | Intel Core i5-3550S @ 3.00GHz
>> compare FX-4350 vs i5-3550S |
$ 341.0 | ||||
| 146 | 2012 | Intel Core i5-3570S @ 3.10GHz
>> compare FX-4350 vs i5-3570S |
$ 285.0 | ||||
| 147 | 2017 | AMD Ryzen 3 1300X
>> compare FX-4350 vs Ryzen 3 1300X |
$ 125.0 | ||||
| 148 | 2012 | Intel Core i5-2550K @ 3.40GHz
>> compare FX-4350 vs i5-2550K |
$ 130. 0 0 |
||||
| 149 | 2012 | Intel Core i5-3470 @ 3.20GHz
>> compare FX-4350 vs i5-3470 |
$ 125.0 | ||||
| 150 | 2012 | Intel Core i5-3475S @ 2.90GHz
>> compare FX-4350 vs i5-3475S |
$ 143.5 | ||||
| 151 | 2014 | Intel Core i5-4460 @ 3.20GHz
>> compare FX-4350 vs i5-4460 |
$ 170.0 | ||||
| 152 | 2014 | Intel Core i5-4460S @ 2.90GHz
>> compare FX-4350 vs i5-4460S |
$ 660.0 | ||||
| 153 | 2015 | Intel Core i5-6400 @ 2.70GHz
>> compare FX-4350 vs i5-6400 |
$ 200.0 | ||||
| 154 | 2013 | Intel Core i5-4440 @ 3. 10GHz 10GHz
>> compare FX-4350 vs i5-4440 |
$ 170.0 | ||||
| 155 | 2013 | Intel Core i5-4440S @ 2.80GHz
>> compare FX-4350 vs i5-4440S |
$ 463.0 | ||||
| 156 | 2011 | Intel Core i7-2600S @ 2.80GHz
>> compare FX-4350 vs i7-2600S |
$ 200.0 | ||||
| 157 | 2010 | Intel Core i5-2500 @ 3.30GHz
>> compare FX-4350 vs i5-2500 |
$ 105.0 | ||||
| 158 | 2010 | Intel Core i5-2500K @ 3.30GHz
>> compare FX-4350 vs i5-2500K |
$ 124.0 | ||||
| 159 | 2012 | Intel Core i5-3450 @ 3.10GHz
>> compare FX-4350 vs i5-3450 |
$ 128. 0 0 |
||||
| 160 | 2012 | Intel Core i5-3470S @ 2.90GHz
>> compare FX-4350 vs i5-3470S |
$ 140.1 | ||||
| 161 | 2013 | Intel Core i5-4430 @ 3.00GHz
>> compare FX-4350 vs i5-4430 |
$ 180.0 | ||||
| 162 | 2017 | AMD Ryzen 5 1400
>> compare FX-4350 vs Ryzen 5 1400 |
$ 134.0 | ||||
| 163 | 2012 | Intel Core i5-3450S @ 2.80GHz
>> compare FX-4350 vs i5-3450S |
$ 100.0 | ||||
| 164 | 2017 | AMD Ryzen 3 1200
>> compare FX-4350 vs Ryzen 3 1200 |
$ 95.0 | ||||
| 165 | 2012 | Intel Core i5-2450P @ 3.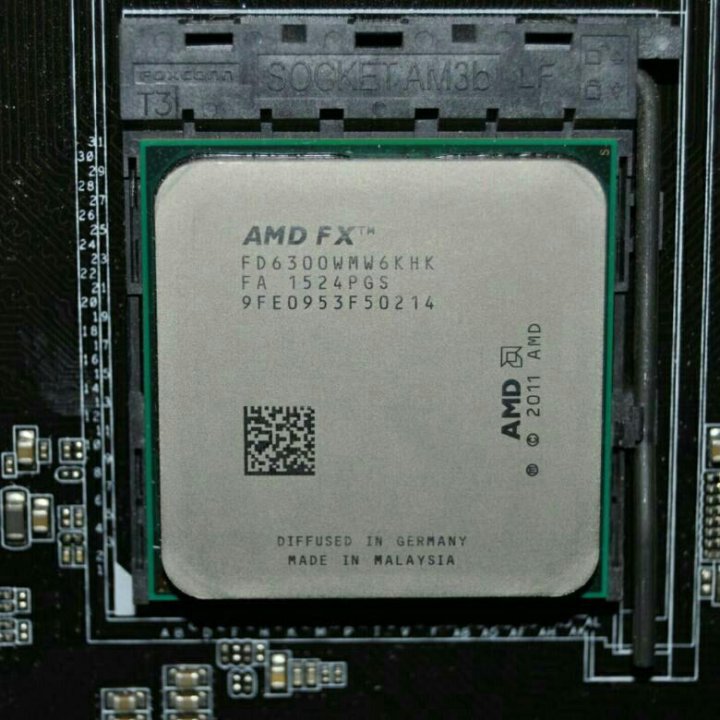 20GHz 20GHz
>> compare FX-4350 vs i5-2450P |
$ 90.0 | ||||
| 166 | 2011 | Intel Core i5-2500S @ 2.70GHz
>> compare FX-4350 vs i5-2500S |
$ 75.0 | ||||
| 167 | 2013 | Intel Core i5-3340 @ 3.10GHz
>> compare FX-4350 vs i5-3340 |
$ 262.0 | ||||
| 168 | 2013 | Intel Core i5-4430S @ 2.70GHz
>> compare FX-4350 vs i5-4430S |
$ 160.0 | ||||
| 169 | 2011 | Intel Core i7-990X @ 3.47GHz
>> compare FX-4350 vs i7-990X |
$ 350.0 | ||||
| 170 | 2010 | Intel Core i5-2400 @ 3.10GHz
>> compare FX-4350 vs i5-2400 |
$ 84. 0 0 |
||||
| 171 | 2013 | Intel Core i5-3340S @ 2.80GHz
>> compare FX-4350 vs i5-3340S |
$ 150.0 | ||||
| 172 | 2012 | Intel Core i5-3350P @ 3.10GHz
>> compare FX-4350 vs i5-3350P |
$ 170.0 | ||||
| 173 | 2011 | Intel Core i5-2320 @ 3.00GHz
>> compare FX-4350 vs i5-2320 |
$ 195.3 | ||||
| 174 | 2012 | Intel Core i5-2380P @ 3.10GHz
>> compare FX-4350 vs i5-2380P |
$ 90.0 | ||||
| 175 | 2012 | Intel Core i5-3330 @ 3.00GHz
>> compare FX-4350 vs i5-3330 |
$ 100.0 | ||||
| 176 | 2012 | Intel Core i5-3330S @ 2. 70GHz 70GHz
>> compare FX-4350 vs i5-3330S |
$ 95.0 | ||||
| 177 | 2010 | Intel Core i7-980X @ 3.33GHz
>> compare FX-4350 vs i7-980X |
$ 220.0 | ||||
| 178 | 2013 | AMD FX-9590 Eight-Core
>> compare FX-4350 vs FX-9590 |
$ 122.0 | ||||
| 179 | 2011 | Intel Core i5-2310 @ 2.90GHz
>> compare FX-4350 vs i5-2310 |
$ 80.0 | ||||
| 180 | 2011 | Intel Core i5-2400S @ 2.50GHz
>> compare FX-4350 vs i5-2400S |
$ 65.7 | ||||
| 181 | 2011 | Intel Core i5-2405S @ 2.50GHz
>> compare FX-4350 vs i5-2405S |
$ 164. 4 4 |
||||
| 182 | 2011 | Intel Core i7-980 @ 3.33GHz
>> compare FX-4350 vs i7-980 |
$ 200.0 | ||||
| 183 | 2013 | AMD FX-9370 Eight-Core
>> compare FX-4350 vs FX-9370 |
$ 178.9 | ||||
| 184 | 2010 | Intel Core i5-680 @ 3.60GHz
>> compare FX-4350 vs i5-680 |
$ 90.0 | ||||
| 185 | 2014 | AMD FX-8370 Eight-Core
>> compare FX-4350 vs FX-8370 |
$ 135.0 | ||||
| 186 | 2014 | AMD FX-8370E Eight-Core
>> compare FX-4350 vs FX-8370E |
$ 180.0 | ||||
| 187 | 2011 | Intel Core i5-2300 @ 2. 80GHz 80GHz
>> compare FX-4350 vs i5-2300 |
$ 80.0 | ||||
| 188 | 2010 | Intel Core i7-970 @ 3.20GHz
>> compare FX-4350 vs i7-970 |
$ 150.0 | ||||
| 189 | 2009 | Intel Core i7-975 @ 3.33GHz
>> compare FX-4350 vs i7-975 |
$ 180.0 | ||||
| 190 | 2012 | AMD FX-8350 Eight-Core
>> compare FX-4350 vs FX-8350 |
$ 80.0 | ||||
| 191 | 2014 | Intel Core i3-4370 @ 3.80GHz
>> compare FX-4350 vs i3-4370 |
$ 450.0 | ||||
| 192 | 2015 | Intel Core i3-6320 @ 3.90GHz
>> compare FX-4350 vs i3-6320 |
$ 160.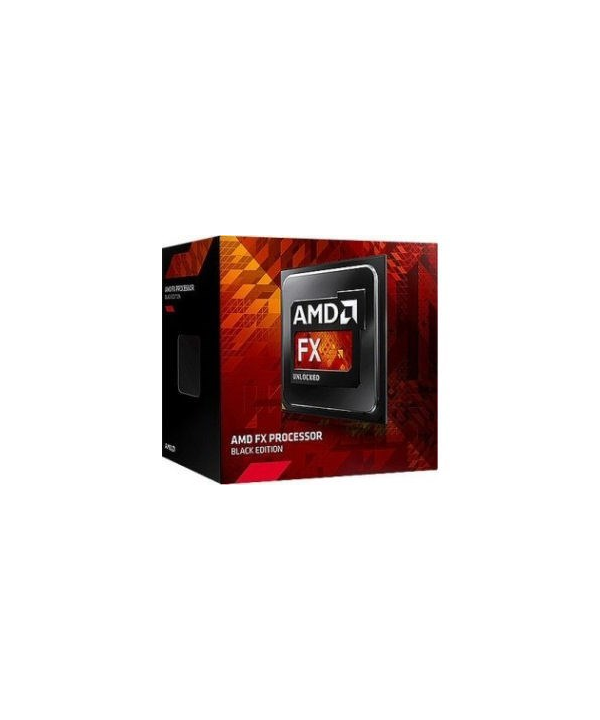 0 0 |
||||
| 193 | 2013 | AMD Athlon X4 760K Quad Core
>> compare FX-4350 vs Athlon X4 760K |
$ 46.0 | ||||
| 194 | 2012 | AMD FX-8320 Eight-Core
>> compare FX-4350 vs FX-8320 |
$ 79.5 | ||||
| 195 | 2015 | Intel Core i3-6300 @ 3.80GHz
>> compare FX-4350 vs i3-6300 |
$ 143.0 | ||||
| 196 | 2010 | Intel Core i5-655K @ 3.20GHz
>> compare FX-4350 vs i5-655K |
$ 60.0 | ||||
| 197 | 2010 | Intel Core i5-670 @ 3.47GHz
>> compare FX-4350 vs i5-670 |
$ 90.0 | ||||
| 198 | 2010 | Intel Core i7-880 @ 3. 07GHz 07GHz
>> compare FX-4350 vs i7-880 |
$ 583.0 | ||||
| 199 | 2009 | Intel Core i7-960 @ 3.20GHz
>> compare FX-4350 vs i7-960 |
$ 100.0 | ||||
| 200 | 2008 | Intel Core i7-965 @ 3.20GHz
>> compare FX-4350 vs i7-965 |
$ 140.0 | ||||
| 201 | 2015 | Intel Core i3-4170 @ 3.70GHz
>> compare FX-4350 vs i3-4170 |
$ 150.0 | ||||
| 202 | 2014 | Intel Core i3-4360 @ 3.70GHz
>> compare FX-4350 vs i3-4360 |
$ 280.0 | ||||
| 203 | 2015 | Intel Core i3-6100 @ 3.70GHz
>> compare FX-4350 vs i3-6100 |
$ 166. 1 1 |
||||
| 204 | 2013 | AMD FX-8300 Eight-Core
>> compare FX-4350 vs FX-8300 |
$ 80.6 | ||||
| 205 | 2014 | Intel Core i3-4160 @ 3.60GHz
>> compare FX-4350 vs i3-4160 |
$ 140.0 | ||||
| 206 | 2013 | Intel Core i3-4340 @ 3.60GHz
>> compare FX-4350 vs i3-4340 |
$ 170.0 | ||||
| 207 | 2014 | Intel Core i3-4350 @ 3.60GHz
>> compare FX-4350 vs i3-4350 |
$ 170.0 | ||||
| 208 | 2016 | Intel Core i3-6098P @ 3.60GHz
>> compare FX-4350 vs i3-6098P |
$ 133.7 | ||||
| 209 | 2009 | Intel Core i5-660 @ 3. 33GHz 33GHz
>> compare FX-4350 vs i5-660 |
$ 49.0 | ||||
| 210 | 2009 | Intel Core i7-870 @ 2.93GHz
>> compare FX-4350 vs i7-870 |
$ 310.0 | ||||
| 211 | 2009 | Intel Core i7-950 @ 3.07GHz
>> compare FX-4350 vs i7-950 |
$ 245.0 | ||||
| 212 | 2008 | Intel Core2 Extreme X9770 @ 3.20GHz
>> compare FX-4350 vs X9770 |
$ 1,609.0 | ||||
| 213 | 2009 | Intel Core2 Extreme X9775 @ 3.20GHz
>> compare FX-4350 vs X9775 |
$ 1,806.0 | ||||
| 214 | 2014 | AMD FX-8320E Eight-Core
>> compare FX-4350 vs FX-8320E |
$ 98. 9 9 |
||||
| 215 | 2011 | AMD FX-8150 Eight-Core
>> compare FX-4350 vs FX-8150 |
$ 383.5 | ||||
| 216 | 2010 | AMD Phenom II X6 1100T
>> compare FX-4350 vs Phenom II X6 1100T |
$ 200.0 | ||||
| 217 | 2014 | Intel Core i3-4150 @ 3.50GHz
>> compare FX-4350 vs i3-4150 |
$ 260.0 | ||||
| 218 | 2013 | Intel Core i3-4330 @ 3.50GHz
>> compare FX-4350 vs i3-4330 |
$ 180.0 | ||||
| 219 | 2010 | Intel Core i5-650 @ 3.20GHz
>> compare FX-4350 vs i5-650 |
$ 100.0 | ||||
| 220 | 2010 | Intel Core i5-661 @ 3. 33GHz 33GHz
>> compare FX-4350 vs i5-661 |
$ 100.0 | ||||
| 221 | 2011 | Intel Core i7-860S @ 2.53GHz
>> compare FX-4350 vs i7-860S |
$ 200.0 | ||||
| 222 | 2010 | Intel Core i7-875K @ 2.93GHz
>> compare FX-4350 vs i7-875K |
$ 200.0 | ||||
| 223 | 2008 | Intel Core i7-940 @ 2.93GHz
>> compare FX-4350 vs i7-940 |
$ 70.7 | ||||
| 224 | 2012 | AMD Athlon X4 740 Quad Core
>> compare FX-4350 vs Athlon X4 740 |
$ 277.0 | ||||
| 225 | 2011 | AMD FX-8120 Eight-Core
>> compare FX-4350 vs FX-8120 |
$ 100. 0 0 |
||||
| 226 | 2010 | AMD Phenom II X6 1090T
>> compare FX-4350 vs Phenom II X6 1090T |
$ 396.1 | ||||
| 227 | 2010 | Intel Core i5-760 @ 2.80GHz
>> compare FX-4350 vs i5-760 |
$ 100.0 | ||||
| 228 | 2009 | Intel Core i7-860 @ 2.80GHz
>> compare FX-4350 vs i7-860 |
$ 290.0 | ||||
| 229 | 2010 | Intel Core i7-930 @ 2.80GHz
>> compare FX-4350 vs i7-930 |
$ 60.0 | ||||
| 230 | 2008 | Intel Core2 Duo E8600 @ 3.33GHz
>> compare FX-4350 vs E8600 |
$ 50.0 | ||||
| 231 | 2008 | Intel Core2 Extreme X9650 @ 3. 00GHz 00GHz
>> compare FX-4350 vs X9650 |
$ 909.0 | ||||
| 232 | 2013 | Intel Core i3-4130 @ 3.40GHz
>> compare FX-4350 vs i3-4130 |
$ 140.0 | ||||
| 233 | 2013 | AMD FX-6350 Six-Core
>> compare FX-4350 vs FX-6350 |
$ 130.0 | ||||
| 234 | 2010 | AMD Phenom II X6 1075T
>> compare FX-4350 vs Phenom II X6 1075T |
$ 260.0 | ||||
| 235 | 2008 | Intel Core i7-920 @ 2.67GHz
>> compare FX-4350 vs i7-920 |
$ 174.0 | ||||
| 236 | 2008 | Intel Core2 Duo E8500 @ 3.16GHz
>> compare FX-4350 vs E8500 |
$ 40. 0 0 |
||||
| 237 | 2009 | AMD Phenom II X4 965
>> compare FX-4350 vs Phenom II X4 965 |
$ 59.5 | ||||
| 238 | 2010 | AMD Phenom II X6 1055T
>> compare FX-4350 vs Phenom II X6 1055T |
$ 185.0 | ||||
| 239 | 2013 | Intel Core i3-3250 @ 3.50GHz
>> compare FX-4350 vs i3-3250 |
$ 95.0 | ||||
| 240 | 2009 | Intel Core i5-750 @ 2.67GHz
>> compare FX-4350 vs i5-750 |
$ 160.5 | ||||
| 241 | 2008 | Intel Core2 Extreme Q6850 @ 3.00GHz
>> compare FX-4350 vs Q6850 |
$ 1,496.0 | ||||
| 242 | 2012 | AMD FX-6300 Six-Core
>> compare FX-4350 vs FX-6300 |
$ 59. 0 0 |
||||
| 243 | 2012 | Intel Core i3-3240 @ 3.40GHz
>> compare FX-4350 vs i3-3240 |
$ 46.0 | ||||
| 244 | 2013 | Intel Core i3-3245 @ 3.40GHz
>> compare FX-4350 vs i3-3245 |
$ 80.0 | ||||
| 245 | 2018 | Intel Pentium Gold G5600 @ 3.90GHz
>> compare FX-4350 vs Pentium Gold G5600 |
$ 100.9 | ||||
| 246 | 2011 | AMD Athlon II X3 460
>> compare FX-4350 vs Athlon II X3 460 |
$ 50.0 | ||||
| 247 | 2012 | AMD FX-6200 Six-Core
>> compare FX-4350 vs FX-6200 |
$ 340.0 | ||||
| 248 | 2009 | AMD Phenom II X4 955
>> compare FX-4350 vs Phenom II X4 955 |
$ 130.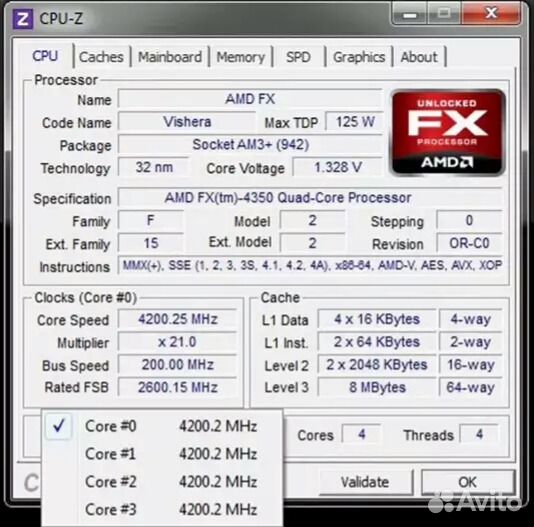 2 2 |
||||
| 249 | 2011 | AMD Phenom II X4 960T
>> compare FX-4350 vs Phenom II X4 960T |
$ 135.0 | ||||
| 250 | 2010 | AMD Phenom II X4 B97
>> compare FX-4350 vs Phenom II X4 B97 |
$ 90.0 | ||||
| 251 | 2010 | AMD Phenom II X6 1045T
>> compare FX-4350 vs Phenom II X6 1045T |
$ 175.0 | ||||
| 252 | 2011 | Intel Core i3-2130 @ 3.40GHz
>> compare FX-4350 vs i3-2130 |
$ 70.0 | ||||
| 253 | 2012 | Intel Core i3-3220 @ 3.30GHz
>> compare FX-4350 vs i3-3220 |
$ 34.9 | ||||
| 254 | 2012 | Intel Core i3-3225 @ 3. 30GHz 30GHz
>> compare FX-4350 vs i3-3225 |
$ 100.0 | ||||
| 255 | 2009 | Intel Core2 Duo E7500 @ 2.93GHz
>> compare FX-4350 vs E7500 |
$ 15.0 | ||||
| 256 | 2009 | Intel Core2 Duo E7600 @ 3.06GHz
>> compare FX-4350 vs E7600 |
$ 120.0 | ||||
| 257 | 2008 | Intel Core2 Duo E8400 @ 3.00GHz
>> compare FX-4350 vs E8400 |
$ 9.8 | ||||
| 258 | 2008 | Intel Core2 Extreme Q6800 @ 2.93GHz
>> compare FX-4350 vs Q6800 |
$ 1,125.0 | ||||
| 259 | 2008 | Intel Core2 Quad Q9650 @ 3.00GHz
>> compare FX-4350 vs Q9650 |
$ 69. 8 8 |
||||
| 260 | 2018 | Intel Pentium Gold G5400 @ 3.70GHz
>> compare FX-4350 vs Pentium Gold G5400 |
$ 123.9 | ||||
| 261 | 2018 | Intel Pentium Gold G5500 @ 3.80GHz
>> compare FX-4350 vs Pentium Gold G5500 |
$ 100.3 | ||||
| 262 | 2011 | AMD Athlon II X2 270
>> compare FX-4350 vs Athlon II X2 270 |
$ 24.0 | ||||
| 263 | 2012 | AMD Athlon II X2 B28
>> compare FX-4350 vs Athlon II X2 B28 |
$ 49.1 | ||||
| 264 | 2010 | AMD Athlon II X3 455
>> compare FX-4350 vs Athlon II X3 455 |
$ 116.9 | ||||
| 265 | 2010 | AMD Athlon II X4 645
>> compare FX-4350 vs Athlon II X4 645 |
$ 50. 0 0 |
||||
| 266 | 2011 | AMD Phenom II X4 840
>> compare FX-4350 vs Phenom II X4 840 |
$ 90.0 | ||||
| 267 | 2010 | AMD Phenom II X6 1035T
>> compare FX-4350 vs Phenom II X6 1035T |
$ 189.0 | ||||
| 268 | 2013 | Intel Core i3-3210 @ 3.20GHz
>> compare FX-4350 vs i3-3210 |
$ 100.0 | ||||
| 269 | 2008 | Intel Core2 Duo E8300 @ 2.83GHz
>> compare FX-4350 vs E8300 |
$ 20.0 | ||||
| 270 | 2008 | Intel Core2 Quad Q9550 @ 2.83GHz
>> compare FX-4350 vs Q9550 |
$ 49.0 | ||||
| 271 | 2010 | AMD Athlon II X2 265
>> compare FX-4350 vs Athlon II X2 265 |
$ 82.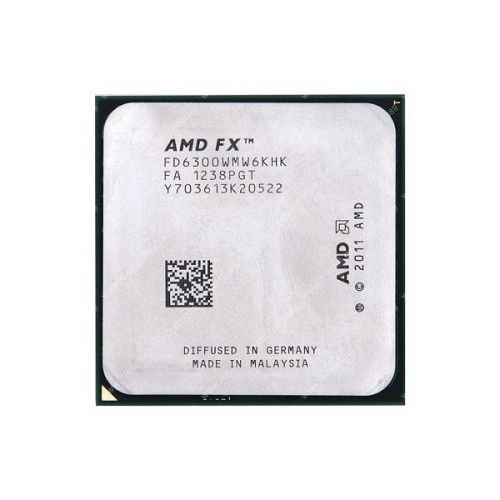 9 9 |
||||
| 272 | 2010 | AMD Athlon II X3 450
>> compare FX-4350 vs Athlon II X3 450 |
$ 40.0 | ||||
| 273 | 2010 | AMD Athlon II X4 640
>> compare FX-4350 vs Athlon II X4 640 |
$ 80.0 | ||||
| 274 | 2011 | AMD Phenom II X2 565
>> compare FX-4350 vs Phenom II X2 565 |
$ 30.0 | ||||
| 275 | 2009 | AMD Phenom II X4 940
>> compare FX-4350 vs Phenom II X4 940 |
$ 120.0 | ||||
| 276 | 2009 | AMD Phenom II X4 945
>> compare FX-4350 vs Phenom II X4 945 |
$ 50.0 | ||||
| 277 | 2010 | AMD Phenom II X4 B95
>> compare FX-4350 vs Phenom II X4 B95 |
$ 73. 0 0 |
||||
| 278 | 2011 | Intel Core i3-2120 @ 3.30GHz
>> compare FX-4350 vs i3-2120 |
$ 30.0 | ||||
| 279 | 2011 | Intel Core i3-2125 @ 3.30GHz
>> compare FX-4350 vs i3-2125 |
$ 199.0 | ||||
| 280 | 2008 | Intel Core2 Duo E6850 @ 3.00GHz
>> compare FX-4350 vs E6850 |
$ 50.0 | ||||
| 281 | 2008 | Intel Core2 Duo E7300 @ 2.66GHz
>> compare FX-4350 vs E7300 |
$ 20.0 | ||||
| 282 | 2008 | Intel Core2 Duo E7400 @ 2.80GHz
>> compare FX-4350 vs E7400 |
$ 29.0 | ||||
| 283 | 2008 | Intel Core2 Duo E8200 @ 2. 66GHz 66GHz
>> compare FX-4350 vs E8200 |
$ 50.0 | ||||
| 284 | 2008 | Intel Core2 Extreme X6800 @ 2.93GHz
>> compare FX-4350 vs X6800 |
$ 263.6 | ||||
| 285 | 2010 | Intel Core2 Quad Q9500 @ 2.83GHz
>> compare FX-4350 vs Q9500 |
$ 35.0 | ||||
| 286 | 2017 | Intel Pentium G4620 @ 3.70GHz
>> compare FX-4350 vs Pentium G4620 |
$ 105.9 | ||||
| 287 | 2016 | Intel Core i3-2102 @ 3.10GHz
>> compare FX-4350 vs i3-2102 |
$ 58.0 | ||||
| 288 | 2009 | Intel Core2 Quad Q9505 @ 2.83GHz
>> compare FX-4350 vs Q9505 |
$ 190. 0 0 |
||||
| 289 | 2014 | Intel Pentium G3258 @ 3.20GHz
>> compare FX-4350 vs Pentium G3258 |
$ 178.3 | ||||
| 290 | 2015 | Intel Pentium G3470 @ 3.60GHz
>> compare FX-4350 vs Pentium G3470 |
$ 104.3 | ||||
| 291 | 2015 | Intel Pentium G4520 @ 3.60GHz
>> compare FX-4350 vs Pentium G4520 |
$ 110.9 | ||||
| 292 | 2017 | Intel Pentium G4600 @ 3.60GHz
>> compare FX-4350 vs Pentium G4600 |
$ 100.0 | ||||
| 293 | 2010 | AMD Athlon II X2 260
>> compare FX-4350 vs Athlon II X2 260 |
$ 20.0 | ||||
| 294 | 2009 | AMD Athlon II X3 435
>> compare FX-4350 vs Athlon II X3 435 |
$ 50. 0 0 |
||||
| 295 | 2010 | AMD Athlon II X3 440
>> compare FX-4350 vs Athlon II X3 440 |
$ 47.0 | ||||
| 296 | 2010 | AMD Athlon II X3 445
>> compare FX-4350 vs Athlon II X3 445 |
$ 91.0 | ||||
| 297 | 2009 | AMD Athlon II X4 630
>> compare FX-4350 vs Athlon II X4 630 |
$ 43.0 | ||||
| 298 | 2010 | AMD Athlon II X4 635
>> compare FX-4350 vs Athlon II X4 635 |
$ 70.0 | ||||
| 299 | 2012 | AMD Athlon II X4 641 Quad-Core
>> compare FX-4350 vs Athlon II X4 641 |
$ 91.5 | ||||
| 300 | 2009 | AMD Phenom II X2 550
>> compare FX-4350 vs Phenom II X2 550 |
$ 50. 0 0 |
||||
| 301 | 2010 | AMD Phenom II X2 555
>> compare FX-4350 vs Phenom II X2 555 |
$ 142.1 | ||||
| 302 | 2009 | AMD Phenom II X4 820
>> compare FX-4350 vs Phenom II X4 820 |
$ 75.0 | ||||
| 303 | 2009 | AMD Phenom II X4 920
>> compare FX-4350 vs Phenom II X4 920 |
$ 67.0 | ||||
| 304 | 2009 | AMD Phenom II X4 925
>> compare FX-4350 vs Phenom II X4 925 |
$ 160.0 | ||||
| 305 | 2011 | Intel Core i3-2100 @ 3.10GHz
>> compare FX-4350 vs i3-2100 |
$ 60.0 | ||||
| 306 | 2011 | Intel Core i3-2105 @ 3. 10GHz 10GHz
>> compare FX-4350 vs i3-2105 |
$ 80.0 | ||||
| 307 | 2012 | Intel Core i5 750S @ 2.40GHz
>> compare FX-4350 vs i5 750S |
$ 100.0 | ||||
| 308 | 2014 | Intel Pentium G3450 @ 3.40GHz
>> compare FX-4350 vs Pentium G3450 |
$ 100.0 | ||||
| 309 | 2014 | Intel Pentium G3460 @ 3.50GHz
>> compare FX-4350 vs Pentium G3460 |
$ 288.2 | ||||
| 310 | 2017 | Intel Pentium G4560 @ 3.50GHz
>> compare FX-4350 vs Pentium G4560 |
$ 103.1 | ||||
| 311 | 2009 | AMD Athlon II X2 250
>> compare FX-4350 vs Athlon II X2 250 |
$ 39.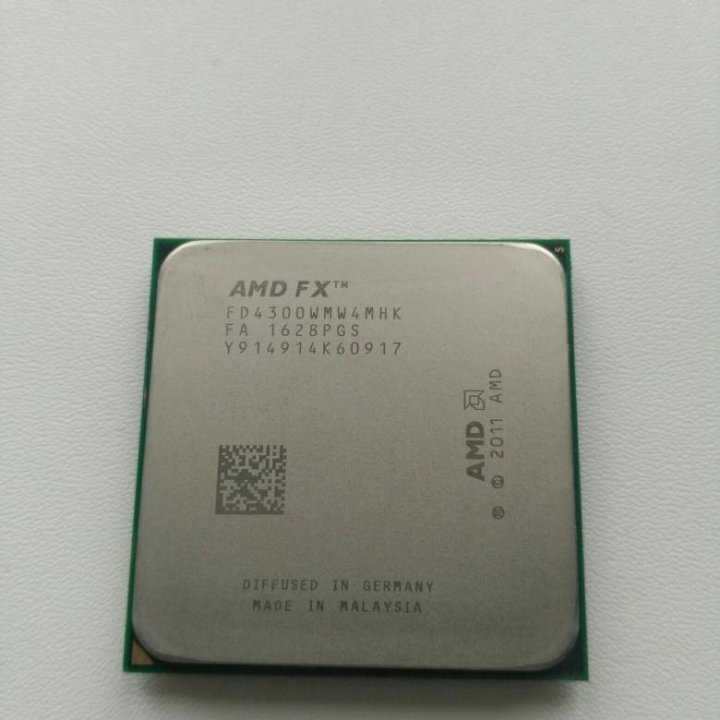 0 0 |
||||
| 312 | 2010 | AMD Athlon II X2 255
>> compare FX-4350 vs Athlon II X2 255 |
$ 65.2 | ||||
| 313 | 2010 | AMD Athlon II X2 B24
>> compare FX-4350 vs Athlon II X2 B24 |
$ 40.0 | ||||
| 314 | 2009 | AMD Athlon II X4 620
>> compare FX-4350 vs Athlon II X4 620 |
$ 60.0 | ||||
| 315 | 2011 | AMD Athlon II X4 631 Quad-Core
>> compare FX-4350 vs Athlon II X4 631 |
$ 80.0 | ||||
| 316 | 2009 | AMD Phenom II X2 545
>> compare FX-4350 vs Phenom II X2 545 |
$ 44.0 | ||||
| 317 | 2009 | AMD Phenom II X2 B55
>> compare FX-4350 vs Phenom II X2 B55 |
$ 48. 0 0 |
||||
| 318 | 2009 | AMD Phenom II X3 720
>> compare FX-4350 vs Phenom II X3 720 |
$ 70.0 | ||||
| 319 | 2010 | AMD Phenom II X3 B73
>> compare FX-4350 vs Phenom II X3 B73 |
$ 75.0 | ||||
| 320 | 2009 | AMD Phenom II X4 810
>> compare FX-4350 vs Phenom II X4 810 |
$ 116.0 | ||||
| 321 | 2009 | AMD Phenom II X4 910
>> compare FX-4350 vs Phenom II X4 910 |
$ 100.0 | ||||
| 322 | 2010 | AMD Phenom II X4 910e
>> compare FX-4350 vs Phenom II X4 910e |
$ 157.0 | ||||
| 323 | 2008 | Intel Core2 Duo E6750 @ 2. 66GHz 66GHz
>> compare FX-4350 vs E6750 |
$ 13.0 | ||||
| 324 | 2008 | Intel Core2 Duo E7200 @ 2.53GHz
>> compare FX-4350 vs E7200 |
$ 75.0 | ||||
| 325 | 2008 | Intel Core2 Quad Q9450 @ 2.66GHz
>> compare FX-4350 vs Q9450 |
$ 335.0 | ||||
| 326 | 2015 | Intel Pentium G4500 @ 3.50GHz
>> compare FX-4350 vs Pentium G4500 |
$ 85.3 | ||||
| 327 | 2008 | AMD Athlon 64 X2 Dual Core 6400+
>> compare FX-4350 vs Athlon 64 X2 Dual 6400+ |
$ 260.0 | ||||
| 328 | 2009 | AMD Athlon 7850 Dual-Core
>> compare FX-4350 vs Athlon 7850 |
$ 209. 7 7 |
||||
| 329 | 2009 | AMD Athlon II X2 245
>> compare FX-4350 vs Athlon II X2 245 |
$ 35.0 | ||||
| 330 | 2010 | AMD Athlon II X2 B22
>> compare FX-4350 vs Athlon II X2 B22 |
$ 36.0 | ||||
| 331 | 2009 | AMD Athlon II X3 425
>> compare FX-4350 vs Athlon II X3 425 |
$ 104.2 | ||||
| 332 | 2008 | AMD Phenom 9950 Quad-Core
>> compare FX-4350 vs Phenom 9950 |
$ 180.0 | ||||
| 333 | 2009 | AMD Phenom II X3 710
>> compare FX-4350 vs Phenom II X3 710 |
$ 84.5 | ||||
| 334 | 2009 | AMD Phenom II X4 805
>> compare FX-4350 vs Phenom II X4 805 |
$ 174. 0 0 |
||||
| 335 | 2009 | AMD Phenom II X4 905e
>> compare FX-4350 vs Phenom II X4 905e |
$ 212.4 | ||||
| 336 | 2008 | Intel Core2 Duo E4700 @ 2.60GHz
>> compare FX-4350 vs E4700 |
$ 100.0 | ||||
| 337 | 2010 | Intel Core2 Duo E6700 @ 2.66GHz
>> compare FX-4350 vs E6700 |
$ 30.0 | ||||
| 338 | 2009 | Intel Core2 Quad Q8400 @ 2.66GHz
>> compare FX-4350 vs Q8400 |
$ 99.5 | ||||
| 339 | 2008 | Intel Core2 Quad Q9400 @ 2.66GHz
>> compare FX-4350 vs Q9400 |
$ 34.0 | ||||
| 340 | 2015 | Intel Pentium G3260 @ 3. 30GHz 30GHz
>> compare FX-4350 vs Pentium G3260 |
$ 105.0 | ||||
| 341 | 2016 | AMD Athlon X4 845
>> compare FX-4350 vs Athlon X4 845 |
$ 50.0 | ||||
| 342 | 2013 | AMD FX-4350 Quad-Core
>> compare FX-4350 vs FX-4350 |
$ 130.0 | ||||
| 343 | 2008 | Intel Core2 Quad Q6700 @ 2.66GHz
>> compare FX-4350 vs Q6700 |
$ 45.0 | ||||
| 344 | 2009 | Intel Core2 Quad Q8300 @ 2.50GHz
>> compare FX-4350 vs Q8300 |
$ 50.0 | ||||
| 345 | 2008 | Intel Core2 Quad Q9300 @ 2.50GHz
>> compare FX-4350 vs Q9300 |
$ 50. 0 0 |
||||
| 346 | 2014 | Intel Pentium G3250 @ 3.20GHz
>> compare FX-4350 vs Pentium G3250 |
$ 110.0 | ||||
| 347 | 2013 | Intel Pentium G3420 @ 3.20GHz
>> compare FX-4350 vs Pentium G3420 |
$ 110.0 | ||||
| 348 | 2013 | Intel Pentium G3430 @ 3.30GHz
>> compare FX-4350 vs Pentium G3430 |
$ 90.0 | ||||
| 349 | 2014 | Intel Pentium G3440 @ 3.30GHz
>> compare FX-4350 vs Pentium G3440 |
$ 159.9 | ||||
| 350 | 2015 | Intel Pentium G4400 @ 3.30GHz
>> compare FX-4350 vs Pentium G4400 |
$ 80.0 | ||||
| 351 | 2009 | AMD Athlon 7750 Dual-Core
>> compare FX-4350 vs Athlon 7750 |
$ 148. 7 7 |
||||
| 352 | 2009 | AMD Athlon II X2 215
>> compare FX-4350 vs Athlon II X2 215 |
$ 12.0 | ||||
| 353 | 2010 | AMD Athlon II X2 220
>> compare FX-4350 vs Athlon II X2 220 |
$ 32.2 | ||||
| 354 | 2009 | AMD Athlon II X2 240
>> compare FX-4350 vs Athlon II X2 240 |
$ 35.0 | ||||
| 355 | 2017 | AMD Athlon X4 950
>> compare FX-4350 vs Athlon X4 950 |
$ 60.0 | ||||
| 356 | 2012 | AMD FX-4300 Quad-Core
>> compare FX-4350 vs FX-4300 |
$ 53.4 | ||||
| 357 | 2008 | AMD Phenom 9750 Quad-Core
>> compare FX-4350 vs Phenom 9750 |
$ 60. 0 0 |
||||
| 358 | 2008 | AMD Phenom 9850 Quad-Core
>> compare FX-4350 vs Phenom 9850 |
$ 50.0 | ||||
| 359 | 2008 | Intel Core2 Duo E6600 @ 2.40GHz
>> compare FX-4350 vs E6600 |
$ 15.0 | ||||
| 360 | 2014 | Intel Pentium G2140 @ 3.30GHz
>> compare FX-4350 vs Pentium G2140 |
$ 50.0 | ||||
| 361 | 2009 | AMD Athlon 64 X2 Dual Core 5800+
>> compare FX-4350 vs Athlon 64 X2 Dual 5800+ |
$ 25.0 | ||||
| 362 | 2008 | AMD Athlon 64 X2 Dual Core 6000+
>> compare FX-4350 vs Athlon 64 X2 Dual 6000+ |
$ 46.0 | ||||
| 363 | 2016 | AMD Athlon X4 880K
>> compare FX-4350 vs Athlon X4 880K |
$ 90. 0 0 |
||||
| 364 | 2013 | AMD FX-4200 Quad-Core
>> compare FX-4350 vs FX-4200 |
$ 228.2 | ||||
| 365 | 2010 | AMD Phenom 9450e Quad-Core
>> compare FX-4350 vs Phenom 9450e |
$ 105.0 | ||||
| 366 | 2008 | AMD Phenom 9550 Quad-Core
>> compare FX-4350 vs Phenom 9550 |
$ 40.0 | ||||
| 367 | 2009 | AMD Phenom 9600B Quad-Core
>> compare FX-4350 vs Phenom 9600B |
$ 147.2 | ||||
| 368 | 2008 | AMD Phenom 9650 Quad-Core
>> compare FX-4350 vs Phenom 9650 |
$ 55.0 | ||||
| 369 | 2009 | AMD Phenom II X3 705e
>> compare FX-4350 vs Phenom II X3 705e |
$ 152.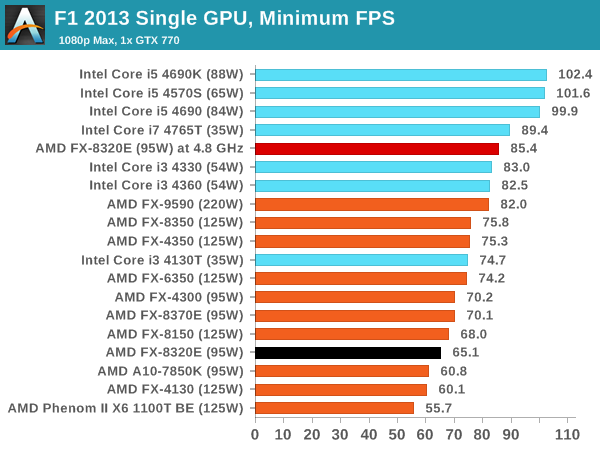 3 3 |
||||
| 370 | 2010 | Intel Core i3-560 @ 3.33GHz
>> compare FX-4350 vs i3-560 |
$ 30.0 | ||||
| 371 | 2008 | Intel Core2 Duo E4600 @ 2.40GHz
>> compare FX-4350 vs E4600 |
$ 158.0 | ||||
| 372 | 2008 | Intel Core2 Duo E6550 @ 2.33GHz
>> compare FX-4350 vs E6550 |
$ 15.0 | ||||
| 373 | 2014 | Intel Pentium G3240 @ 3.10GHz
>> compare FX-4350 vs Pentium G3240 |
$ 80.0 | ||||
| 374 | 2008 | AMD Athlon 64 X2 Dual Core 5200+
>> compare FX-4350 vs Athlon 64 X2 Dual 5200+ |
$ 53.1 | ||||
| 375 | 2008 | AMD Athlon 64 X2 Dual Core 5400+
>> compare FX-4350 vs Athlon 64 X2 Dual 5400+ |
$ 53. 0 0 |
||||
| 376 | 2008 | AMD Athlon 64 X2 Dual Core 5600+
>> compare FX-4350 vs Athlon 64 X2 Dual 5600+ |
$ 150.0 | ||||
| 377 | 2009 | AMD Athlon 7550 Dual-Core
>> compare FX-4350 vs Athlon 7550 |
$ 60.0 | ||||
| 378 | 2012 | AMD FX-4170 Quad-Core
>> compare FX-4350 vs FX-4170 |
$ 100.0 | ||||
| 379 | 2009 | AMD Phenom 8600 Triple-Core
>> compare FX-4350 vs Phenom 8600 |
$ 53.0 | ||||
| 380 | 2009 | AMD Phenom 8600B Triple-Core
>> compare FX-4350 vs Phenom 8600B |
$ 53.0 | ||||
| 381 | 2008 | AMD Phenom 8650 Triple-Core
>> compare FX-4350 vs Phenom 8650 |
$ 50. 0 0 |
||||
| 382 | 2008 | AMD Phenom 9500 Quad-Core
>> compare FX-4350 vs Phenom 9500 |
$ 60.0 | ||||
| 383 | 2008 | AMD Phenom 9600 Quad-Core
>> compare FX-4350 vs Phenom 9600 |
$ 50.0 | ||||
| 384 | 2009 | Intel Core2 Duo E6400 @ 2.13GHz
>> compare FX-4350 vs E6400 |
$ 20.0 | ||||
| 385 | 2008 | Intel Core2 Duo E6420 @ 2.13GHz
>> compare FX-4350 vs E6420 |
$ 50.0 | ||||
| 386 | 2008 | Intel Core2 Duo E4500 @ 2.20GHz
>> compare FX-4350 vs E4500 |
$ 40.0 | ||||
| 387 | 2008 | Intel Core2 Quad Q6600 @ 2.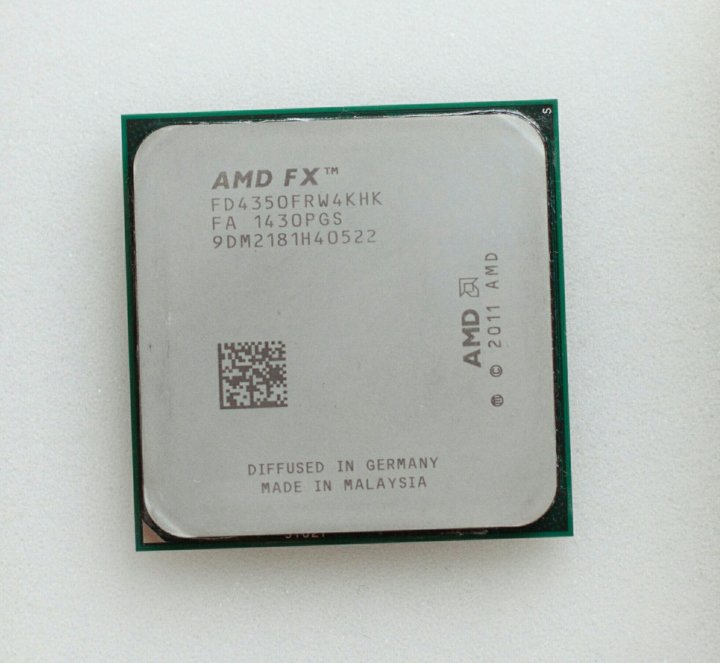 40GHz 40GHz
>> compare FX-4350 vs Q6600 |
$ 40.0 | ||||
| 388 | 2008 | Intel Core2 Quad Q8200 @ 2.33GHz
>> compare FX-4350 vs Q8200 |
$ 23.0 | ||||
| 389 | 2013 | Intel Pentium G2130 @ 3.20GHz
>> compare FX-4350 vs Pentium G2130 |
$ 50.0 | ||||
| 390 | 2013 | Intel Pentium G3220 @ 3.00GHz
>> compare FX-4350 vs Pentium G3220 |
$ 120.0 | ||||
| 391 | 2008 | AMD Athlon 64 X2 Dual Core 5200+
>> compare FX-4350 vs Athlon 64 X2 Dual 5200+ |
$ 53.1 | ||||
| 392 | 2008 | AMD Athlon 64 X2 Dual Core 5400+
>> compare FX-4350 vs Athlon 64 X2 Dual 5400+ |
$ 53. 0 0 |
||||
| 393 | 2014 | AMD Athlon X4 860K
>> compare FX-4350 vs Athlon X4 860K |
$ 64.0 | ||||
| 394 | 2016 | AMD Athlon X4 870K
>> compare FX-4350 vs Athlon X4 870K |
$ 80.0 | ||||
| 395 | 2011 | AMD FX-4100 Quad-Core
>> compare FX-4350 vs FX-4100 |
$ 130.0 | ||||
| 396 | 2012 | AMD FX-4130 Quad-Core
>> compare FX-4350 vs FX-4130 |
$ 76.0 | ||||
| 397 | 2010 | Intel Core i3-550 @ 3.20GHz
>> compare FX-4350 vs i3-550 |
$ 180.0 | ||||
| 398 | 2008 | AMD Athlon 64 X2 Dual Core 5000+
>> compare FX-4350 vs Athlon 64 X2 Dual 5000+ |
$ 331.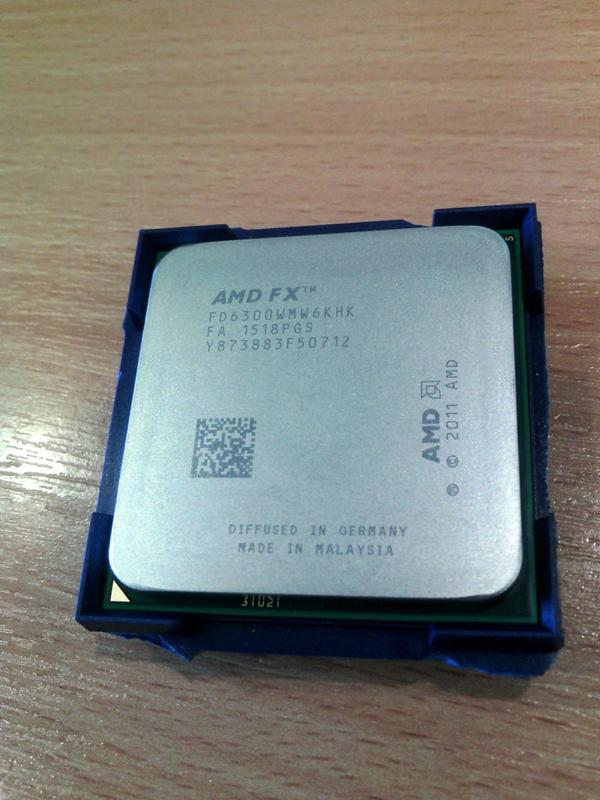 5 5 |
||||
| 399 | 2009 | AMD Athlon Dual Core 5000B
>> compare FX-4350 vs Athlon Dual 5000B |
$ 95.0 | ||||
| 400 | 2015 | AMD Athlon X4 840
>> compare FX-4350 vs Athlon X4 840 |
$ 78.7 | ||||
| 401 | 2011 | AMD E2-3200 APU
>> compare FX-4350 vs E2-3200 APU |
$ 8.0 | ||||
| 402 | 2008 | AMD Phenom 8450 Triple-Core
>> compare FX-4350 vs Phenom 8450 |
$ 30.0 | ||||
| 403 | 2009 | AMD Phenom 9350e Quad-Core
>> compare FX-4350 vs Phenom 9350e |
$ 3,382.1 | ||||
| 404 | 2009 | AMD Phenom X3 8550
>> compare FX-4350 vs Phenom X3 8550 |
$ 170. 0 0 |
||||
| 405 | 2010 | Intel Core i3-540 @ 3.07GHz
>> compare FX-4350 vs i3-540 |
$ 21.0 | ||||
| 406 | 2013 | Intel Pentium G2030 @ 3.00GHz
>> compare FX-4350 vs Pentium G2030 |
$ 41.0 | ||||
| 407 | 2012 | Intel Pentium G2120 @ 3.10GHz
>> compare FX-4350 vs Pentium G2120 |
$ 46.0 | ||||
| 408 | 2012 | Intel Pentium G870 @ 3.10GHz
>> compare FX-4350 vs Pentium G870 |
$ 97.0 | ||||
| 409 | 2008 | AMD Athlon 64 X2 Dual Core 5000+
>> compare FX-4350 vs Athlon 64 X2 Dual 5000+ |
$ 331.5 | ||||
| 410 | 2009 | AMD Athlon 5000 Dual-Core
>> compare FX-4350 vs Athlon 5000 |
$ 100. 0 0 |
||||
| 411 | 2010 | AMD Athlon 5200 Dual-Core
>> compare FX-4350 vs Athlon 5200 |
$ 30.0 | ||||
| 412 | 2008 | AMD Athlon 64 X2 Dual Core 4600+
>> compare FX-4350 vs Athlon 64 X2 Dual 4600+ |
$ 360.0 | ||||
| 413 | 2008 | AMD Athlon 64 X2 Dual Core 4800+
>> compare FX-4350 vs Athlon 64 X2 Dual 4800+ |
$ 460.0 | ||||
| 414 | 2009 | AMD Phenom 9150e Quad-Core
>> compare FX-4350 vs Phenom 9150e |
$ 40.0 | ||||
| 415 | 2008 | Intel Core2 Duo E4400 @ 2.00GHz
>> compare FX-4350 vs E4400 |
$ 9.0 | ||||
| 416 | 2008 | Intel Core2 Duo E6320 @ 1. 86GHz 86GHz
>> compare FX-4350 vs E6320 |
$ 50.0 | ||||
| 417 | 2011 | Intel Pentium G860 @ 3.00GHz
>> compare FX-4350 vs Pentium G860 |
$ 30.0 | ||||
| 418 | 2009 | AMD Athlon 5000 Dual-Core
>> compare FX-4350 vs Athlon 5000 |
$ 100.0 | ||||
| 419 | 2010 | AMD Athlon 5200 Dual-Core
>> compare FX-4350 vs Athlon 5200 |
$ 30.0 | ||||
| 420 | 2008 | AMD Athlon 64 X2 Dual Core 4600+
>> compare FX-4350 vs Athlon 64 X2 Dual 4600+ |
$ 360.0 | ||||
| 421 | 2008 | AMD Athlon 64 X2 Dual Core 4800+
>> compare FX-4350 vs Athlon 64 X2 Dual 4800+ |
$ 460. 0 0 |
||||
| 422 | 2010 | Intel Core i3-530 @ 2.93GHz
>> compare FX-4350 vs i3-530 |
$ 20.0 | ||||
| 423 | 2013 | Intel Pentium G2020 @ 2.90GHz
>> compare FX-4350 vs Pentium G2020 |
$ 32.9 | ||||
| 424 | 2011 | Intel Pentium G850 @ 2.90GHz
>> compare FX-4350 vs Pentium G850 |
$ 30.0 | ||||
| 425 | 2008 | AMD Athlon 64 X2 Dual Core 4200+
>> compare FX-4350 vs Athlon 64 X2 Dual 4200+ |
$ 130.0 | ||||
| 426 | 2008 | AMD Athlon 64 X2 Dual Core 4400+
>> compare FX-4350 vs Athlon 64 X2 Dual 4400+ |
$ 60.0 | ||||
| 427 | 2009 | AMD Phenom 8250e Triple-Core
>> compare FX-4350 vs Phenom 8250e |
$ 47. 0 0 |
||||
| 428 | 2009 | AMD Phenom 9100e Quad-Core
>> compare FX-4350 vs Phenom 9100e |
$ 40.0 | ||||
| 429 | 2009 | Intel Core2 Duo E4300 @ 1.80GHz
>> compare FX-4350 vs E4300 |
$ 158.0 | ||||
| 430 | 2008 | Intel Core2 Duo E6300 @ 1.86GHz
>> compare FX-4350 vs E6300 |
$ 13.0 | ||||
| 431 | 2013 | Intel Pentium G2010 @ 2.80GHz
>> compare FX-4350 vs Pentium G2010 |
$ 34.9 | ||||
| 432 | 2012 | Intel Pentium G645 @ 2.90GHz
>> compare FX-4350 vs Pentium G645 |
$ 95.0 | ||||
| 433 | 2011 | Intel Pentium G840 @ 2. 80GHz 80GHz
>> compare FX-4350 vs Pentium G840 |
$ 35.0 | ||||
| 434 | 2008 | AMD Athlon 64 X2 Dual Core 4200+
>> compare FX-4350 vs Athlon 64 X2 Dual 4200+ |
$ 130.0 | ||||
| 435 | 2008 | AMD Athlon 64 X2 Dual Core 4400+
>> compare FX-4350 vs Athlon 64 X2 Dual 4400+ |
$ 60.0 | ||||
| 436 | 2012 | Intel Pentium G640 @ 2.80GHz
>> compare FX-4350 vs Pentium G640 |
$ 25.0 |
AMD FX-4350 Specs, Price, and FPS in Games
| 4 | 4 | 4.2 GHz | 4.3 GHz |
| Cores | Threads | Base Frequency | Turbo Frequency |
|---|
Geekbench 5 Single-Core
545
24%
Geekbench 5 Multi-Core
1509
5%
Availability
Prozessor FX-Serie FX4350 FX-4350 FX 4350 4,2 GHz 125 W Quad-Core CPU Prozessor FD4350FRW4KHK Sockel AM3+ Hochwertiger, leistungsstarker Computer-Motherboar
Buy on Amazon
€74. 43
43
In Stock
Updated 32 minutes ago
Graphics Card
Resolution
Select game resolution
Graphics Settings
Select game graphics
Offset
…
Apply Offset
Value Rating
Performance Rating
Value per FPS
You will receive
… FPS
Alternatives for FX-4350
1080p, High
Specifications
| General | |
|---|---|
| Release Date | Apr 29th, 2013 |
| Segment | Desktop |
| Socket | AMD Socket AM3+ |
| Collection | FX |
| Codename | Vishera |
| Performance | |
|---|---|
| Cores | 4 |
| Threads | 4 |
| Base Frequency | 4.2 GHz |
| Turbo Frequency | 4. 3 GHz 3 GHz |
| Other | |
|---|---|
| Power Consumption | 125 W |
| Overclockable | No |
| Integrated Graphics | None |
Builds Using AMD FX-4350
1080p, High
Find out which of the 2 CPUs performs better, view a side-by-side specification comparison.
Ryzen 5 5600X
Ryzen 7 5800X
€336.22
Ryzen 7 5800X
€336.22
Ryzen 5 3600
€135.41
Ryzen 7 5800X
€336.22
Ryzen 9 5900X
Ryzen 5 5600X
Ryzen 9 5900X
Ryzen 7 5800X
€336.22
Ryzen 5 3600X
Ryzen 5 5600X
Ryzen 5 5600G
€174.37
Refine results to filter 1558 processors by performance, release date, price, and value. Click on a CPU to view more in-depth specifications and game FPS.
Found 1558 CPUs.
Popularity
Processor
Performance
Ryzen 5 5600X
Release Date: Nov 5th, 2020
Performance Rating
€349 on Amazon
In Stock
Ryzen 7 5800X
Release Date: Nov 5th, 2020
Performance Rating
€336. 22 on Amazon
In Stock
Core i7-12700K
Release Date: Nov 4th, 2021
Performance Rating
€927.52 on Amazon
In Stock
Ryzen 9 5900X
Release Date: Nov 5th, 2020
Performance Rating
€659 on Amazon
In Stock
Core i9-9900
Release Date: Apr 23rd, 2019
Performance Rating
€2,318.39 on Amazon
In Stock
Core i9-12900K
Release Date: Nov 4th, 2021
Performance Rating
€703.14 on Amazon
In Stock
Core i5-9600K
Release Date: Oct 19th, 2018
Performance Rating
€263.08 on Amazon
In Stock
Ryzen 5 3600
Release Date: Jul 7th, 2019
Performance Rating
€135.41 on Amazon
In Stock
Core i5-12600K
Release Date: Nov 4th, 2021
Performance Rating
€509 on Amazon
In Stock
Ryzen 9 5950X
Release Date: Nov 5th, 2020
Performance Rating
€589 on Amazon
In Stock
Core i5-11260H
Release Date: May 11th, 2021
Performance Rating
Ryzen 5 5600G
Release Date: Apr 13th, 2021
Performance Rating
€174.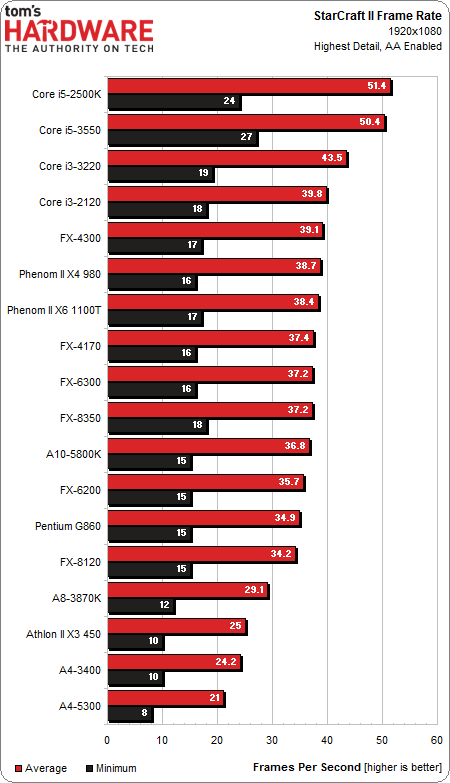 37 on Amazon
In Stock
Core i5-3550
Release Date: Apr 29th, 2012
Performance Rating
€84.13 on Amazon
In Stock
Core i9-9900K
Release Date: Oct 19th, 2018
Performance Rating
€494.01 on Amazon
In Stock
Ryzen 7 4800H
Release Date: Jan 6th, 2020
Performance Rating
Core i5-10400F
Release Date: Apr 30th, 2020
Performance Rating
€144.2 on Amazon
In Stock
Core i5-11400F
Release Date: Mar 16th, 2021
Performance Rating
€162.89 on Amazon
In Stock
Core i7-8700K
Release Date: Oct 5th, 2017
Performance Rating
€249.99 on Amazon
In Stock
Core i3-10100F
Release Date: Unknown
Performance Rating
Ryzen 7 3700X
Release Date: Jul 7th, 2019
Performance Rating
€356.34 on Amazon
In Stock
Core i7-6700K
Release Date: Aug 1st, 2015
Performance Rating
€168.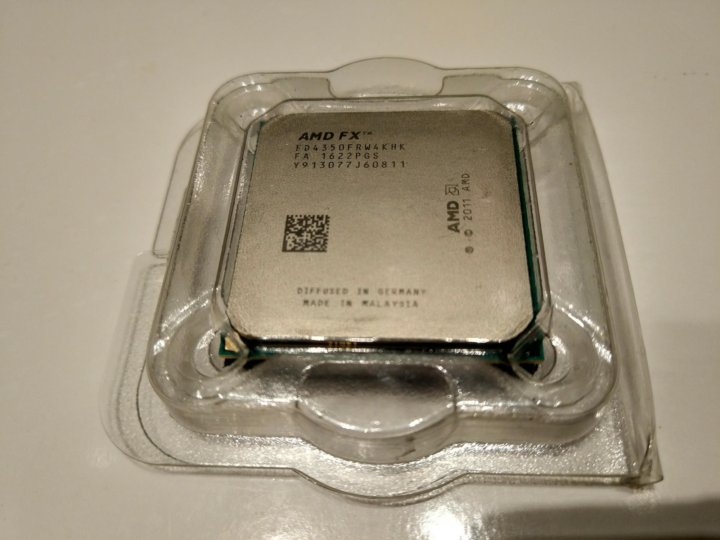 97 on Amazon
In Stock
Core i7-11700K
Release Date: Mar 16th, 2021
Performance Rating
€318 on Amazon
In Stock
Ryzen 5 5600H
Release Date: Unknown
Performance Rating
Ryzen 5 5500U
Release Date: Jan 12th, 2021
Performance Rating
Athlon X4 860K
Release Date: Aug 12th, 2014
Performance Rating
€44.11 on Amazon
In Stock
- Previous
- 1
- 2
- 3
- 4
- …
- 61
- 62
- 63
- Next
AMD FX-8350, FX-8320, FX-6300 and FX-4300 Tested
by Anand Lal Shimpion October 23, 2012 12:00 AM EST
- Posted in
- CPUs
- AMD
- FX
250 Comments
|
250 Comments
IntroductionGeneral PerformanceVideo Transcoding & Visual Studio 2012 PerformancePhotoshop & 3D Rendering Performance3D Gaming PerformancePower ConsumptionProjected Performance: Can AMD Catch up with Intel?OverclockingFinal Words
Last year’s launch of AMD’s FX processors was honestly disappointing.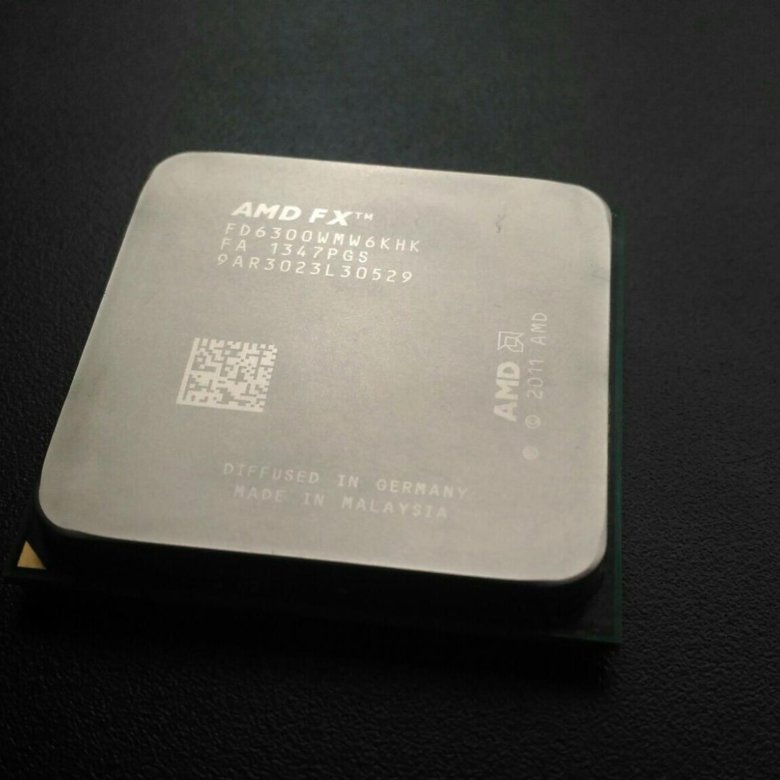 The Bulldozer CPU cores that were bundled into each Zambezi chip were hardly power efficient and in many areas couldn’t significantly outperform AMD’s previous generation platform. Look beyond the direct AMD comparison and the situation looked even worse. In our conclusion to last year’s FX-8150 review I wrote the following:
«Single threaded performance is my biggest concern, and compared to Sandy Bridge there’s a good 40-50% advantage the i5 2500K enjoys over the FX-8150. My hope is that future derivatives of the FX processor (perhaps based on Piledriver) will boast much more aggressive Turbo Core frequencies, which would do wonders at eating into that advantage.»
The performance advantage that Intel enjoyed at the time was beyond what could be erased by a single generation. To make matters worse, before AMD could rev Bulldozer, Intel already began shipping Ivy Bridge — a part that not only increased performance but decreased power consumption as well. It’s been a rough road for AMD over these past few years, but you have to give credit where it’s due: we haven’t seen AMD executing this consistently in quite a while. As promised we’ve now had multiple generations of each platform ship from AMD. Brazos had a mild update, Llano paved the way for Trinity which is now shipping, and around a year after Zambezi’s launch we have Vishera: the Piledriver based AMD FX successor.
At a high level, Vishera swaps out the Bulldozer cores from Zambezi and replaces them with Piledriver. This is the same CPU core that is used in Trinity, but it’s optimized for a very different purpose here in Vishera. While Trinity had to worry about working nicely in a laptop, Vishera is strictly a high-end desktop/workstation part. There’s no on-die graphics for starters. Clock speeds and TDPs are also up compared to Trinity.
| CPU Specification Comparison | ||||||||
| CPU | Manufacturing Process | Cores | Transistor Count | Die Size | ||||
| AMD Vishera 8C | 32nm | 8 | 1.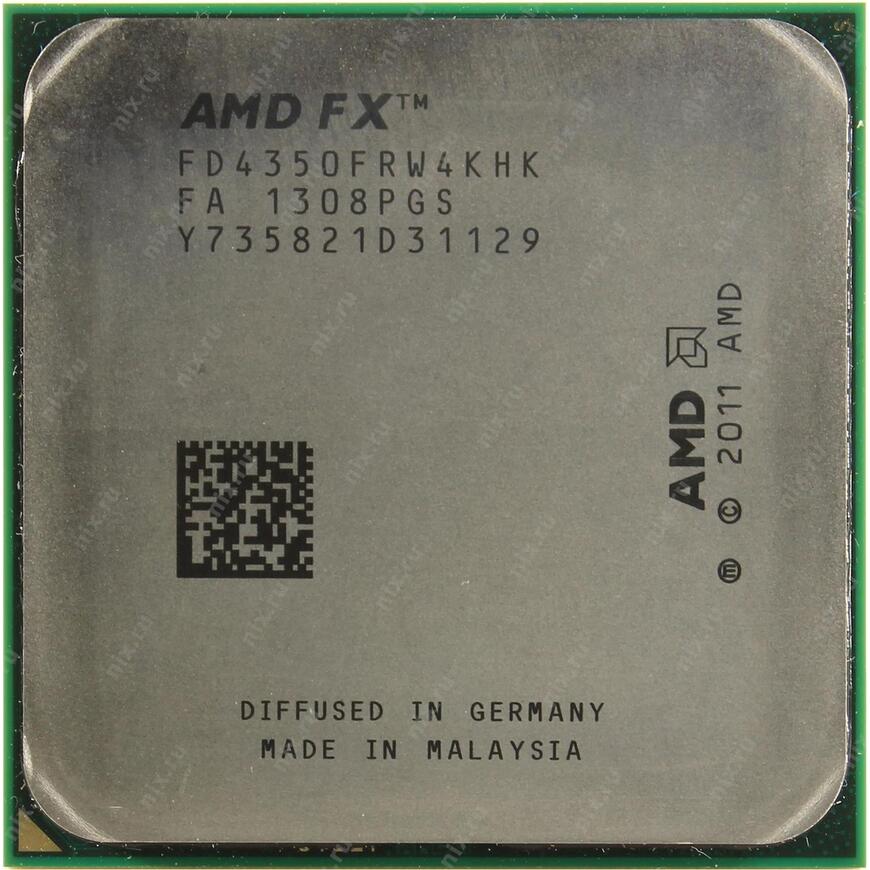 2B 2B |
315mm2 | ||||
| AMD Zambezi 8C | 32nm | 8 | 1.2B | 315mm2 | ||||
| Intel Ivy Bridge 4C | 22nm | 4 | 1.4B | 160mm2 | ||||
| Intel Sandy Bridge E (6C) | 32nm | 6 | 2.27B | 435mm2 | ||||
| Intel Sandy Bridge E (4C) | 32nm | 4 | 1. 27B 27B |
294mm2 | ||||
| Intel Sandy Bridge 4C | 32nm | 4 | 1.16B | 216mm2 | ||||
| Intel Lynnfield 4C | 45nm | 4 | 774M | 296mm2 | ||||
| Intel Sandy Bridge 2C (GT1) | 32nm | 2 | 504M | 131mm2 | ||||
| Intel Sandy Bridge 2C (GT2) | 32nm | 2 | 624M | 149mm2 | ||||
Vishera is still built on the same 32nm GlobalFoundries SOI process as Zambezi, which means there isn’t much room for additional architectural complexity without ballooning die area, and not a whole lot of hope for significantly decreasing power consumption.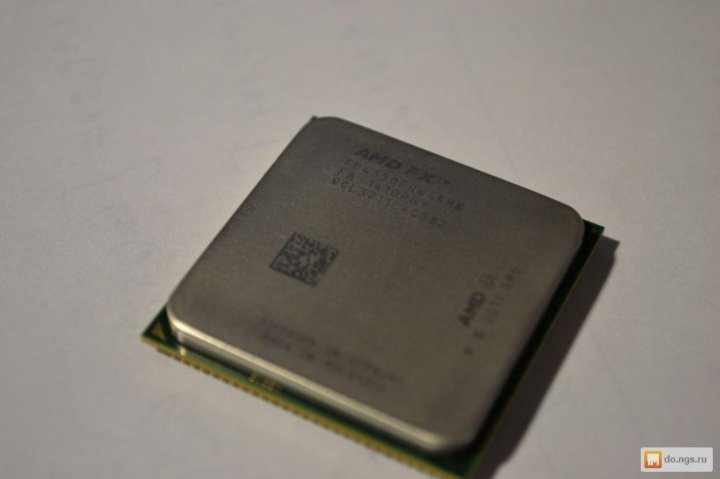 As a fabless semiconductor manufacturer, AMD is now at GF’s mercy when it comes to moving process technology forward. It simply has to make 32nm work for now. Piledriver is a light evolution over Bulldozer, so there’s actually no substantial increase in die area compared to the previous generation. Cache sizes remain the same as well, which keeps everything roughly the same. These chips are obviously much larger than Intel’s 22nm Ivy Bridge parts, but Intel has a full node advantage there which enables that.
Piledriver is a bit more power efficient than Bulldozer, which enables AMD to drive Vishera’s frequency up while remaining in the same thermal envelope as Zambezi. The new lineup is in the table below:
| CPU Specification Comparison | ||||||||||
| Processor | Codename | Cores | Clock Speed | Max Turbo | L2/L3 Cache | TDP | Price | |||
| AMD FX-8350 | Vishera | 8 | 4.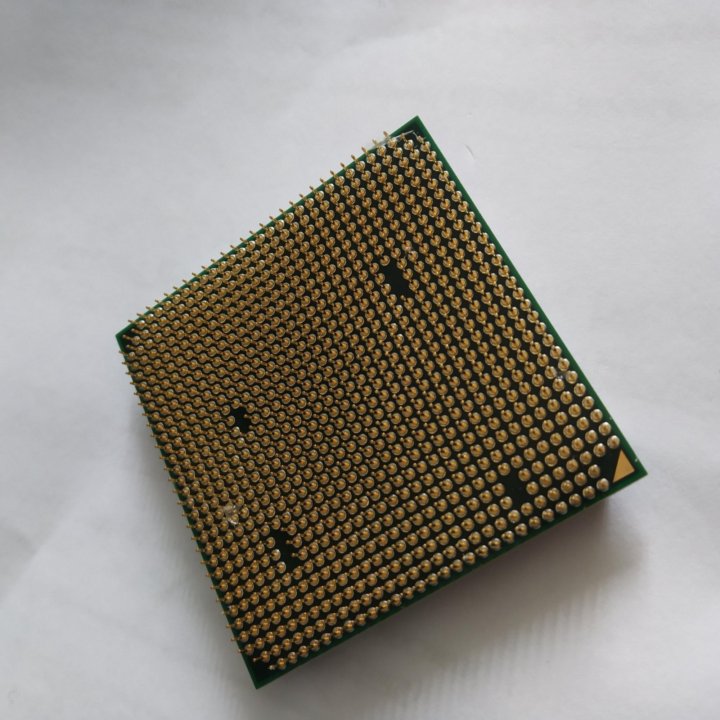 0GHz 0GHz |
4.2GHz | 8MB/8MB | 125W | $199 | |||
| AMD FX-8150 | Zambezi | 8 | 3.6GHz | 4.2GHz | 8MB/8MB | 125W | $183 | |||
| AMD FX-8320 | Vishera | 8 | 3.5GHz | 4.0GHz | 8MB/8MB | 125W | $169 | |||
| AMD FX-8120 | Zambezi | 8 | 3. 1GHz 1GHz |
4.0GHz | 8MB/8MB | 125W | $153 | |||
| AMD FX-6300 | Vishera | 6 | 3.5GHz | 4.1GHz | 6MB/8MB | 95W | $132 | |||
| AMD FX-6100 | Zambezi | 6 | 3.3GHz | 3.9GHz | 6MB/8MB | 95W | $112 | |||
| AMD FX-4300 | Vishera | 4 | 3. 8GHz 8GHz |
4.0GHz | 4MB/4MB | 95W | $122 | |||
| AMD FX-4100 | Zambezi | 4 | 3.6GHz | 3.8GHz | 4MB/4MB | 95W | $101 | |||
The table above says it all. TDPs haven’t changed, cache sizes haven’t changed and neither have core counts. Across the board Vishera ships at higher base frequencies than the equivalent Zambezi part, but without increasing max turbo frequency (in the case of the 8-core parts). The 6 and 4 core versions get boosts to both sides, without increasing TDP. In our Trinity notebook review I called the new CPU core Bulldozed Tuned. The table above supports that characterization.
It’s also important to note that AMD’s pricing this time around is far more sensible. While the FX-8150 debuted at $245, the 8350 drops that price to $199 putting it around $40 less than the Core i5 3570K. The chart below shows where AMD expects all of these CPUs to do battle:
AMD’s targets are similar to what they were last time: Intel’s Core i5 and below. All of the FX processors remain unlocked and ship fully featured with hardware AES acceleration enabled. Most Socket-AM3+ motherboards on the market today should support the new parts with nothing more than a BIOS update. In fact, I used the same ASUS Crosshair V Formula motherboard I used last year (with a much newer BIOS) for today’s review:
For more comparisons be sure to check out our performance database: Bench.
| Motherboard: | ASUS Maximus V Gene (Intel Z77) ASUS Crosshair V Formula (AMD 990FX) |
| Hard Disk: | Intel X25-M SSD (80GB) Crucial RealSSD C300 OCZ Agility 3 (240GB) Samsung SSD 830 (512GB) |
| Memory: | 4 x 4GB G. Skill Ripjaws X DDR3-1600 9-9-9-20 Skill Ripjaws X DDR3-1600 9-9-9-20 |
| Video Card: | ATI Radeon HD 5870 (Windows 7) NVIDIA GeForce GTX 680 (Windows 8) |
| Desktop Resolution: | 1920 x 1200 |
| OS: | Windows 7 x64/Windows 8 Pro x64 |
General Performance
IntroductionGeneral PerformanceVideo Transcoding & Visual Studio 2012 PerformancePhotoshop & 3D Rendering Performance3D Gaming PerformancePower ConsumptionProjected Performance: Can AMD Catch up with Intel?OverclockingFinal Words
Tweet
PRINT THIS ARTICLE
Apex Legends system requirements | Can I Run Apex Legends
Check Pricing
Can I Run Apex Legends
Check the Apex Legends system requirements.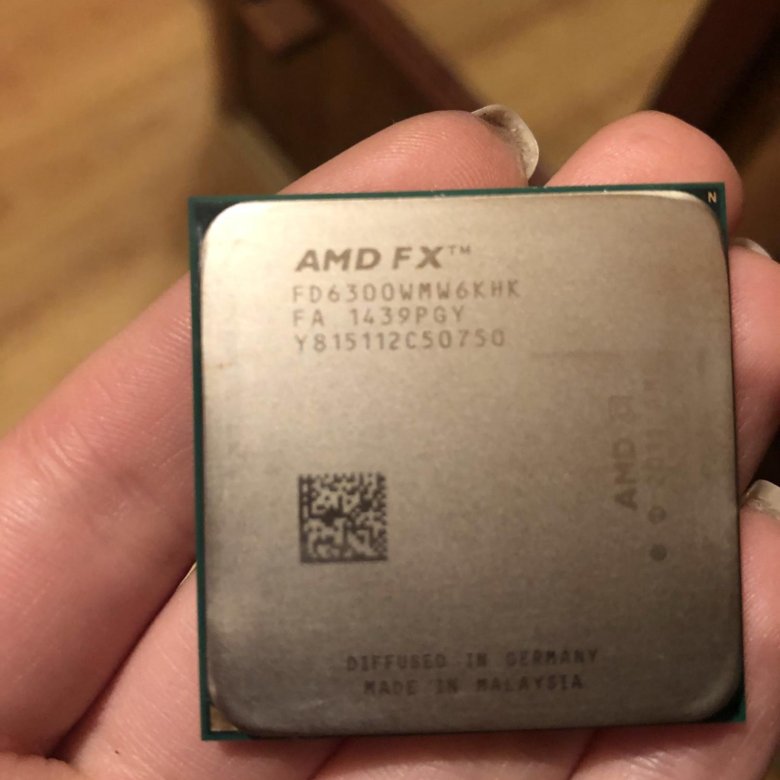 Can I Run it? Test your specs and rate your gaming PC. System requirements Lab runs millions of PC requirements tests on over 8,500 games a month.
Can You Run It?
Here are the
Apex Legends System Requirements (Minimum)
- CPU: Intel Core i3-6300 3.8GHz / AMD FX-4350 4.2 GHz Quad-Core Processor
- CPU SPEED: Info
- RAM: 6 GB
- OS: 64-bit Windows 7
- VIDEO CARD: 1 GB NVIDIA GeForce GT 640 / Radeon HD 7730
- PIXEL SHADER: 5.0
- VERTEX SHADER: 5.0
- FREE DISK SPACE: 56 GB
- DEDICATED VIDEO RAM: 1 GB
Click here to see Recommended Computer
Apex Legends Recommended Requirements
- CPU: Intel i5 3570K / Ryzen 5 CPU or equivalent
- CPU SPEED: Info
- RAM: 8 GB
- OS: 64-bit Windows 7
- VIDEO CARD: 8 GB Nvidia GeForce GTX 970 / AMD Radeon R9 290
- PIXEL SHADER: 5.
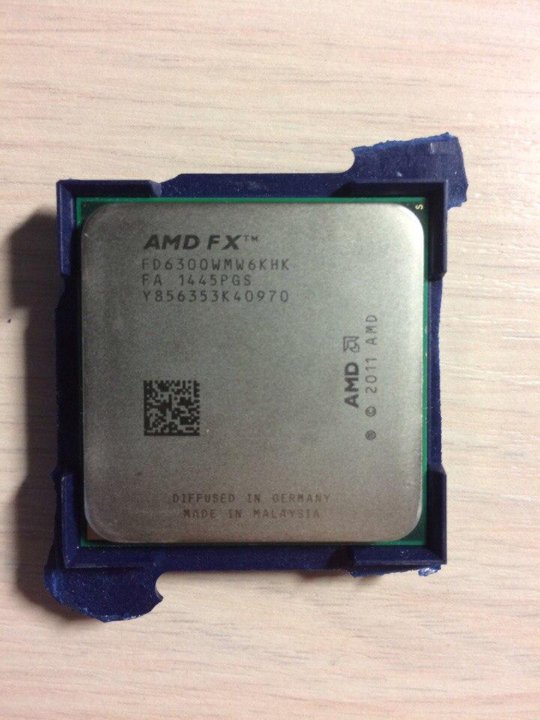 1
1 - VERTEX SHADER: 5.1
- FREE DISK SPACE: 56 GB
- DEDICATED VIDEO RAM: 8 GB
Latest Graphic Cards
Click here for the latest video card drivers
Online games
Test Latency
Can my computer play Apex Legends?
Apex Legends Min & Rec Specs — Find out if you can Run it. Apex Legends PC Specs — Can You Run Apex Legends Recommended Requirements?
Updated November 19, 2020 By Cliff Henjum
We are now a couple of weeks into Season 7 of Apex Legends, the free to play character-based Battle Royale from Respawn Entertainment. Reswan has continued to update the game with new weapons, characters, and items. The low system requirements for Apex Legends allows for a much larger variety of computers to run it, especially when compared to other Battle Royales like CoD Warzone. The Intel Core i3-6300 and the AMD FX-4350 are the minimum CPU benchmark to run Apex Legends on Low Graphics. Take the official system requirements test to determine if your hardware has what it takes.
By Cliff Henjum March 1, 2019
In a surprise announcement, Respawn Entertainment and EA Games launched a free to play battle royale game called Apex Legends! It’s set in the Titanfall universe and (at least at time of launch) features 20 teams of 3 for a maximum of 60 players per round. Apex Legends has some cool features that help set it apart from other battle royale games like the ability to revive dead teammates and a unique class system that will enhance various playstyles. On top of these gameplay mechanics, Apex Legends has created an impressive communication system that enables squadmates to communicate quickly and precisely during the heat of battle that is currently unrivaled. The game’s aesthetic, pace of play, and gun mechanics feel like Blackops 4’s Blackout with many more mobility options due to the abilities from your specific class. However, despite looking more like Black Ops 4, its system requirements are actually closer to that of Fortnite and PUBG Lite.
Due to the smaller player count, and a smaller map compared to some of PUBG’s choices, the minimum system requirements for Apex Legends are much lower than PUBG or BO4. Whether you’re grapple-hooking with Pathfinder, or running through portals as Wraith, you’ll want a computer that’s above the minimum requirements so you can enjoy a playable framerate. In order to pass the minimum video card requirement, your PC will need at least a GeForce GT 640 or a Radeon HD 7700. In contrast to Fortnite, you will need a bit more RAM to get Apex Legends running — 6 GB as opposed to 4 GB. Your computer also needs a halfway decent CPU — something along the lines of a Core i3-6300 or AMD FX-4350. If your computer meets these requirements, you’ll be hot dropping on to drop ships and down to Skull Town in no time.
In order to run Apex Legends on High or Max settings, your computer needs to pass the recommended system requirements. There is a pretty big jump in overall computing power between the minimum and recommended requirements. For a CPU, your PC needs at least a Core i5-3570K or its AMD equivalent. The recommended video card brings the requirement closer to Black Ops 4 and further away from PUBG Lite. A whopping GeForce GTX 970 or Radeon R9 290 are the recommended video card models if you want to push back that view distance and up those texture details. The required RAM shouldn’t break the bank — only 8 GB is needed as opposed to the 16 GB that PUBG requires.
The plethora of unique changes and additions to the battle royale genre will more than likely keep Apex Legends in the conversation for a long time to come. It’s free to play, it has pretty low system requirements for a battle royale, and it actually had a pretty smooth launch which is more than a lot of these other copycat games can claim. If Apex Legends rolls out regular content updates without messing up the game’s core mechanics (looking at you Realm Royale), we anticipate that it remains in the top 3 most played battle royale games for 2019.
Similar Games System Requirements
Fortnite
PLAYERUNKNOWN’S BATTLEGROUNDS
Call of Duty: Warzone
Below are some gaming computers with images that show how many games will run on each.
Each computer was tested against the minimum and recommended requirements of over 8,500 of the latest PC games.
Click here for more options.
System Requirements Lab may earn affiliate commissions from qualifying purchases via Amazon Associates, eBay Affiliates and other programs
AMD FX-4350 vs AMD FX-6300: What is the difference?
Smartphone-graphic wire headphones
39 BALLLA
AMD FX-4350
40 BALLLA
AMD FX-6300
VS
64 Facts compared to
AMD FX-4350
AMD FXD FX-6300 9000 9000 AMD FX Is 4350 better than AMD FX-6300?
- 0.
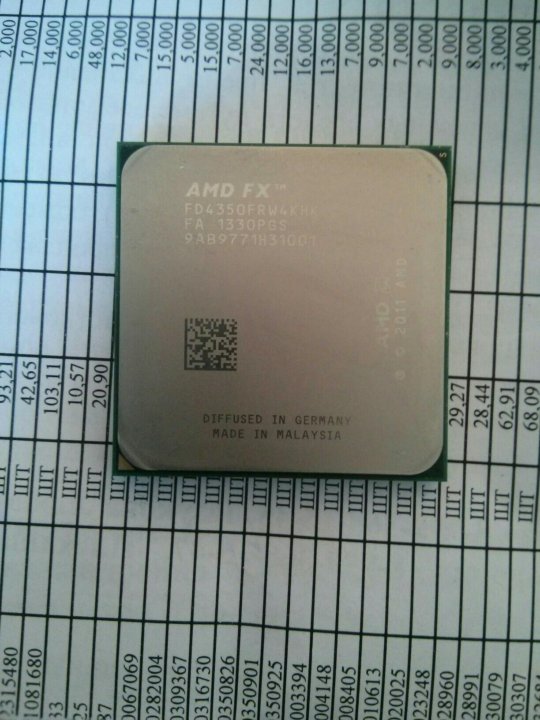 67MB/core more L3 cache per core?
2MB/core vs 1.33MB/core
- 25% higher CPU speed?
6 x 3.5GHz vs 4 x 4.2GHz - 2 more CPU threads?
6 vs 4 - 2MB more L2 cache?
6MB vs 4MB - 30W below TDP?
95W vs 125W - 1 newer PCI Express (PCIe) version?
3 vs 2 - 96KB more L1 cache?
288KB vs 192KB
What are the most popular comparisons?
AMD RYZEN 5 5500U
VS
Intel Core i5-1135g7
AMD Ryzen 3 3250U
VS
Intel Core I3-1115g4
AMD Ryzen 3 5300U
VS 9000 VS 9000.9000 9000. AMD Ryzen 7 3700U
vs
Intel Core i5-10210U
AMD Ryzen 7 3700U
vs
Intel Core i5-1135G7
AMD Ryzen 5
VS
Intel Core i5-10300h
Intel Core i3-1115G4
VS
Intel Core i5-10210u 9000u
AMD Ryzen 5 3500U 9000 VS 9000u 9000u 9000u 9000u 9000 AMD AMD AMD AMD
VS
Intel Core i3-1115g4
AMD Ryzen 7 5800h
VS
Intel Core i7-11800H
Complexation of
Users
Foreign rating
AMD FX-4350
0 Reviews of Users
AMD FX-4350
0.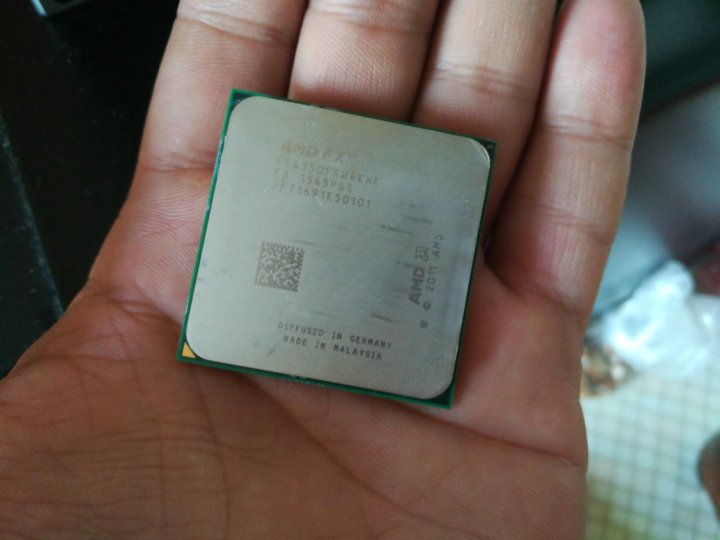 0 /10
0 /10
0 Reviews of users
AMD FX-6300
2 reviews of users
AMD FX-6300
9.5 /10 9000
Reviews 2 reviews Users
Functions
The price ratio
reviews is not
/10
2 Votes
Games
reviews yet there are no
8.0 /10
2 Votes
performance
Reviews yet not
8.5 /10
2 Votes
Reliability
9000 9000 9000 9000 8.5
2 votes
Energy efficiency
No reviews yet
7.5 /10
2 votes
CPU speed
0003
4 x 4.2GHz
6 x 3.5GHz
CPU speed indicates how many processing cycles per second a processor can perform, considering all its cores (processors). It is calculated by adding the clock speeds of each core or, in the case of multi-core processors, each group of cores.
2nd processor thread
More threads result in better performance and better multitasking.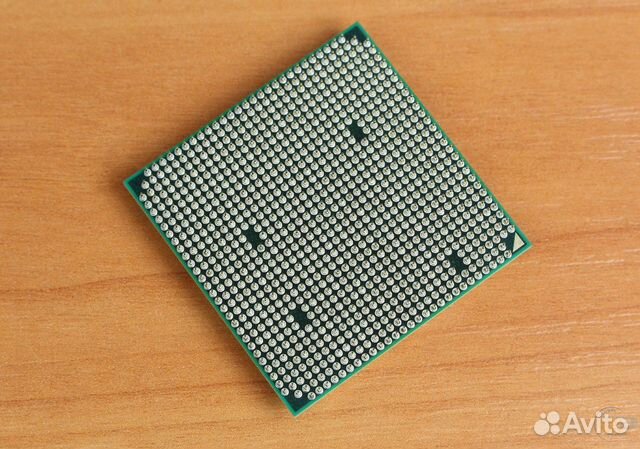
3.speed turbo clock
4.3GHz
4.1GHz
When the processor is running below its limits, it can jump to a higher clock speed to increase performance.
4. Unlocked
✔AMD FX-4350
✔AMD FX-6300
Some processors come with an unlocked multiplier and are easier to overclock, allowing for better performance in games and other applications.
5.L2 cache
More L2 scratchpad memory results in faster results in CPU and system performance tuning.
6.L3 cache
More L3 scratchpad memory results in faster results in CPU and system performance tuning.
7.L1 cache
More L1 cache results in faster results in CPU and system performance tuning.
8.core L2
1MB/core
1MB/core
More data can be stored in L2 scratchpad for access by each processor core.
9.core L3
2MB/core
1.33MB/core
More data can be stored in the L3 scratchpad for access by each processor core.
Memory
1.RAM speed
1866MHz
1866MHz
Can support faster memory which speeds up system performance.
2.max memory bandwidth
21GB/s
21GB/s
This is the maximum rate at which data can be read from or stored in memory.
3rd DDR memory version
Unknown. Help us offer a price. (AMD FX-4350)
DDR (Double Data Rate Synchronous Dynamic Random Access Memory) is the most common type of main memory. New versions of DDR memory support higher maximum speeds and are more energy efficient.
4.Memory channels
More memory channels increase the speed of data transfer between memory and processor.
5.max memory
Unknown. Help us offer a price. (AMD FX-4350)
Unknown. Help us offer a price. (AMD FX-6300)
Maximum amount of memory (RAM).
6.baud rate bus
5.4GT/s
5.4GT/s
The bus is responsible for transferring data between different components of a computer or device.
7.Supports memory error recovery code
✖AMD FX-4350
✖AMD FX-6300
Memory error recovery code can detect and correct data corruption. It is used when necessary to avoid distortion, such as in scientific computing or when starting a server.
8.eMMC version
Unknown. Help us offer a price. (AMD FX-4350)
Unknown. Help us offer a price. (AMD FX-6300)
The newer version of eMMC — built-in flash memory card — speeds up the memory interface, has a positive effect on device performance, for example, when transferring files from a computer to internal memory via USB.
9.bus frequency
Unknown. Help us offer a price. (AMD FX-4350)
Unknown. Help us offer a price. (AMD FX-6300)
The bus is responsible for transferring data between various components of a computer or device
Geotagging
1. PassMark result
Unknown. Help us offer a price. (AMD FX-4350)
This test measures processor performance using multithreading.
2nd PassMark result (single)
Unknown. Help us offer a price. (AMD FX-4350)
This test measures processor performance using a thread of execution.
3.Geekbench 5 result (multi-core)
Unknown. Help us offer a price. (AMD FX-4350)
Unknown. Help us offer a price. (AMD FX-6300)
Geekbench 5 is a cross-platform benchmark that measures multi-core processor performance. (Source: Primate Labs, 2022)
4. Cinebench R20 result (multi-core)
Unknown. Help us offer a price. (AMD FX-4350)
Unknown. Help us offer a price. (AMD FX-6300)
Cinebench R20 is a benchmark that measures the performance of a multi-core processor by rendering a 3D scene.
5.Cinebench R20 result (single core)
Unknown. Help us offer a price. (AMD FX-4350)
Unknown. Help us offer a price. (AMD FX-6300)
Cinebench R20 is a test to evaluate the performance of a single core processor when rendering a 3D scene.
6.Geekbench 5 result (single core)
Unknown. Help us offer a price. (AMD FX-4350)
Unknown. Help us offer a price. (AMD FX-6300)
Geekbench 5 is a cross-platform benchmark that measures the single-core performance of a processor. (Source: Primate Labs, 2022)
7. Blender test result (bmw27)
Unknown. Help us offer a price. (AMD FX-4350)
Unknown. Help us offer a price. (AMD FX-6300)
The Blender benchmark (bmw27) measures CPU performance by rendering a 3D scene. More powerful processors can render a scene in a shorter time.
8.Blender result (classroom)
Unknown. Help us offer a price. (AMD FX-4350)
Unknown. Help us offer a price. (AMD FX-6300)
The Blender (classroom) test measures CPU performance by rendering a 3D scene. More powerful processors can render a scene in a shorter time.
9.power per watt
Unknown. Help us offer a price. (AMD FX-4350)
This means that the processor is more efficient, giving more performance per watt of power used.
Functions
1.uses multi-threading
✖AMD FX-4350
✖AMD FX-6300
processor into logical cores, also known as threads. Thus, each core can run two instruction streams at the same time.
2. Has AES
✔AMD FX-4350
✔AMD FX-6300
AES is used to speed up encryption and decryption.
3. Has AVX
✔AMD FX-4350
✔AMD FX-6300
AVX is used to help speed up calculations in multimedia, scientific and financial applications, and to improve the performance of the Linux RAID program.
4.Version SSE
SSE is used to speed up multimedia tasks such as editing images or adjusting audio volume. Each new version contains new instructions and improvements.
5. Has F16C
✔AMD FX-4350
✔AMD FX-6300
F16C is used to speed up tasks such as image contrast adjustment or volume control.
6.bits transmitted at the same time
Unknown. Help us offer a price. (AMD FX-4350)
Unknown. Help us offer a price. (AMD FX-6300)
NEON provides faster media processing such as MP3 listening.
7. Has MMX
✔AMD FX-4350
✔AMD FX-6300
MMX is used to speed up tasks such as adjusting image contrast or adjusting volume.
8. TrustZone enabled
✖AMD FX-4350
✖AMD FX-6300
Technology is integrated into the processor to ensure device security when using features such as mobile payments and digital rights management (DRM) video streaming .
9.interface width
Unknown. Help us offer a price. (AMD FX-4350)
Unknown. Help us offer a price. (AMD FX-6300)
The processor can decode more instructions per clock (IPC), which means the processor performs better
Price comparison
Cancel
Which CPUs are better?
This page is currently only available in English.
Comparison of AMD FX-4350 and AMD FX-6300
Comparative analysis of AMD FX-4350 and AMD FX-6300 processors according to all known characteristics in the categories: General information, Performance, Memory, Compatibility, Peripherals, Technologies, Virtualization.
Analysis of processor performance by benchmarks: PassMark — Single thread mark, PassMark — CPU mark, Geekbench 4 — Single Core, Geekbench 4 — Multi-Core, CompuBench 1.5 Desktop — Face Detection (mPixels/s), CompuBench 1.5 Desktop — Ocean Surface Simulation ( Frames/s), CompuBench 1.5 Desktop — T-Rex (Frames/s), CompuBench 1.5 Desktop — Bitcoin Mining (mHash/s), 3DMark Fire Strike — Physics Score, CompuBench 1.5 Desktop — Video Composition (Frames/s).
AMD FX-4350
versus
AMD FX-6300
Advantages
Reasons to select AMD FX-4350
- The processor is more than 6 MONTH (S)
- The processor is unlocked, the unlocked factor allows you to easily make an airplane
- 13% more clock speed: 4.3 GHz vs 3.8 GHz
- Performance in PassMark — Single thread mark about 8% more: 1605 vs 1489
- Geekbench 4 — Single Core performance about 9% better: 572 vs 527
| Release date | April 2013 vs October 2012 |
| Unlocked | Unlocked / Locked |
| Maximum frequency | 4.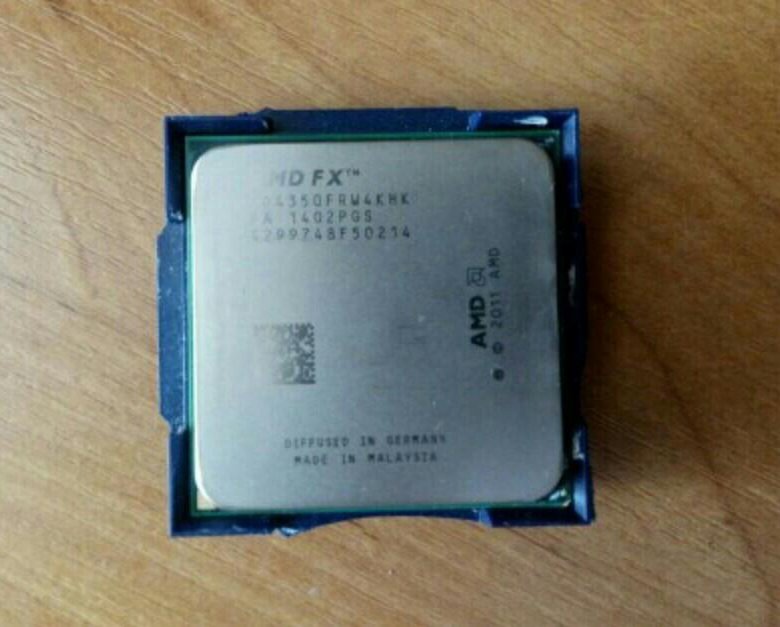 3 GHz vs 3.8 GHz 3 GHz vs 3.8 GHz |
| PassMark — Single thread mark | 1605 vs 1489 |
| Geekbench 4 — Single Core | 572 vs 527 |
Reasons to choose AMD FX-6300
- 2 more cores, ability to run more applications simultaneously: 6 vs 4
- 2 more threads: 6 vs 4
- About 15% more max core temperature: 70.50°C vs 61.10°C
- About 50% more L1 cache means more data can be stored in it for quick access
- About 50% more L2 cache means more data can be stored in it for quick access
- Approximately 32% less power consumption: 95 Watt vs 125 Watt
- Performance in PassMark — CPU mark about 28% more: 4176 vs 3267
- Performance in Geekbench 4 — Multi- Core about 20% more: 1914 vs 1589
- Approximately 27% more performance in CompuBench 1.
 5 Desktop — Face Detection (mPixels/s): 6.905 vs 5.452
 - Approximately 38% improvement in CompuBench 1.5 Desktop — Ocean Surface Simulation (Frames/s) : 16.195 vs 11.727
- CompuBench 1.5 Desktop — T-Rex (Frames/s) about 63% more performance: 0.339 vs 0.208
- CompuBench 1.5 Desktop — Bitcoin Mining (mHash/s) about 35% faster more: 4.767 vs 3.54
| Number of cores | 6 vs 4 |
| Number of threads | 6 vs 4 |
| Maximum core temperature | 70.50°C vs 61.10°C |
| Level 1 cache | 288 KB vs 192 KB |
| Level 2 cache | 6MB vs 4MB |
| Power consumption (TDP) | 95 Watt vs 125 Watt |
| PassMark — CPU mark | 4176 vs 3267 |
| Geekbench 4 — Multi-Core | 1914 vs 1589 |
CompuBench 1.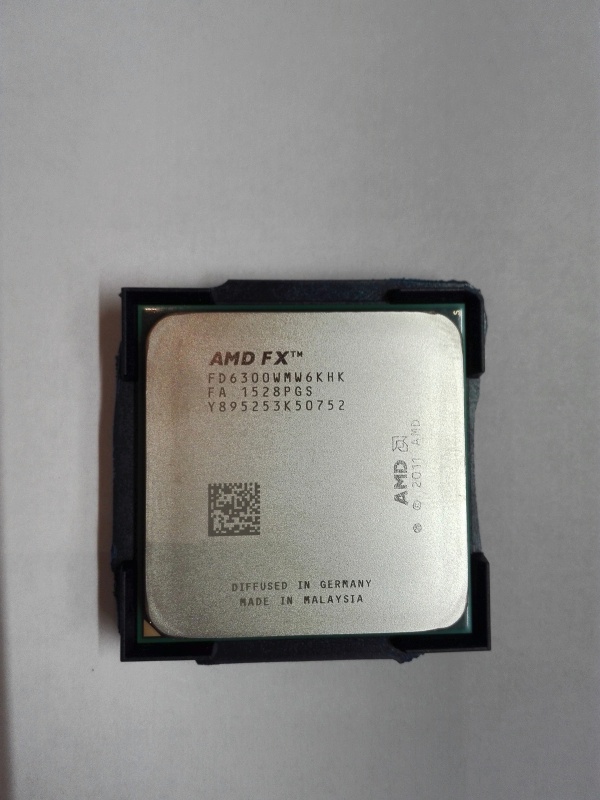 5 Desktop — Face Detection (mPixels/s) 5 Desktop — Face Detection (mPixels/s) |
6.905 vs 5.452 |
| CompuBench 1.5 Desktop — Ocean Surface Simulation (Frames/s) | 16.195 vs 11.727 |
| CompuBench 1.5 Desktop — T-Rex (Frames/s) | 0.339 vs 0.208 |
| CompuBench 1.5 Desktop — Bitcoin Mining (mHash/s) | 4.767 vs 3.54 |
Benchmark comparison
CPU 1: AMD FX-4350
CPU 2: AMD FX-6300
| PassMark — Single thread mark |
|
|||||
| PassMark — CPU mark |
|
|||||
| Geekbench 4 — Single Core |
|
|||||
| Geekbench 4 — Multi Core |
|
|||||
CompuBench 1. 5 Desktop — Face Detection (mPixels/s) 5 Desktop — Face Detection (mPixels/s) |
|
|||||
| CompuBench 1.5 Desktop — Ocean Surface Simulation (Frames/s) |
|
|
||||
| CompuBench 1.5 Desktop — T-Rex (Frames/s) |
|
|||||
CompuBench 1.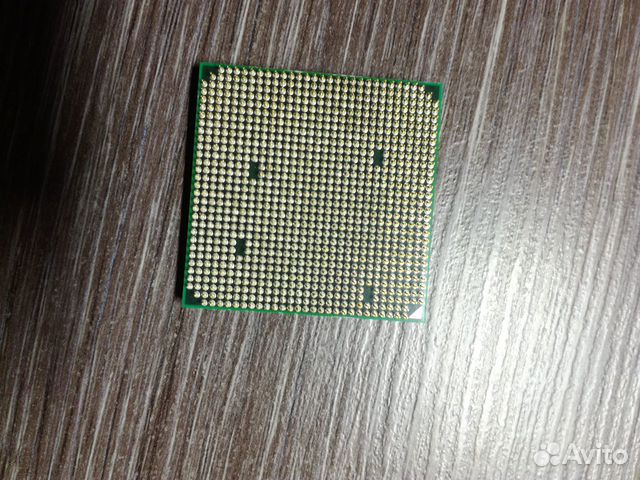 5 Desktop — Bitcoin Mining (mHash/s) 5 Desktop — Bitcoin Mining (mHash/s) |
|
| Name | AMD FX-4350 | AMD FX-6300 |
|---|---|---|
| PassMark — Single thread mark | 1605 | 1489 |
| PassMark — CPU mark | 3267 | 4176 |
| Geekbench 4 — Single Core | 572 | 527 |
| Geekbench 4 — Multi-Core | 1589 | 1914 |
CompuBench 1. 5 Desktop — Face Detection (mPixels/s) 5 Desktop — Face Detection (mPixels/s) |
5.452 | 6.905 |
| CompuBench 1.5 Desktop — Ocean Surface Simulation (Frames/s) | 11.727 | 16.195 |
| CompuBench 1.5 Desktop — T-Rex (Frames/s) | 0.208 | 0.339 |
| CompuBench 1.5 Desktop — Bitcoin Mining (mHash/s) | 3.54 | 4.767 |
| 3DMark Fire Strike — Physics Score | 2098 | |
| CompuBench 1.5 Desktop — Video Composition (Frames/s) | 0.85 |
Feature comparison
| AMD FX-4350 | AMD FX-6300 | |
|---|---|---|
| Architecture name | Vishera | Vishera |
| Family | AMD FX-Series Processors | AMD FX-Series Processors |
| Issue date | April 2013 | October 2012 |
| OPN PIB | FD4350FRHKBOX | FD6300WMHKBOX |
| OPN Tray | FD4350FRW4KHK | FD6300WMW6KHK |
| Place in the rating | 1979 | 1981 |
| Price now | $129.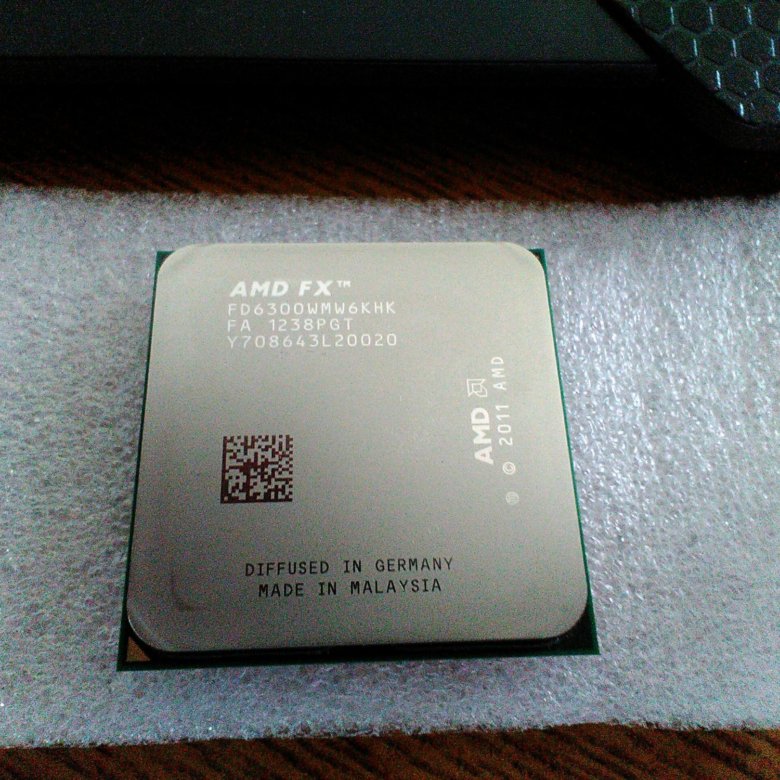 99 99 |
$58.99 |
| Series | AMD FX 4-Core Black Edition Processors | AMD FX 6-Core Black Edition Processors |
| Price/performance ratio (0-100) | 12.09 | 31.81 |
| Applicability | Desktop | Desktop |
| Support 64 bit | ||
| Base frequency | 4.2 GHz | 3.5 GHz |
| Crystal area | 315 mm | 315 mm |
| Level 1 cache | 192KB | 288KB |
| Level 2 cache | 4MB | 6MB |
| Level 3 cache | 8MB | 8MB |
| Process | 32nm SOI | 32nm SOI |
| Maximum core temperature | 61. 10°C 10°C |
70.50°C |
| Maximum frequency | 4.3 GHz | 3.8 GHz |
| Number of cores | 4 | 6 |
| Number of threads | 4 | 6 |
| Voltage P0 Vcore | Min: 1.275 V — Max: 1.4 V | Min: 1.15V — Max: 1.3875V |
| Number of transistors | 1200 million | 1200 million |
| Unlocked | ||
| Supported memory frequency | 1866 MHz | 1866 MHz |
| Supported memory types | DDR3 | DDR3 |
| Maximum number of processors in | 1 | 1 |
| Supported sockets | AM3+ | AM3+ |
| Power consumption (TDP) | 125 Watt | 95 Watt |
| PCI Express revision | n/a | 3.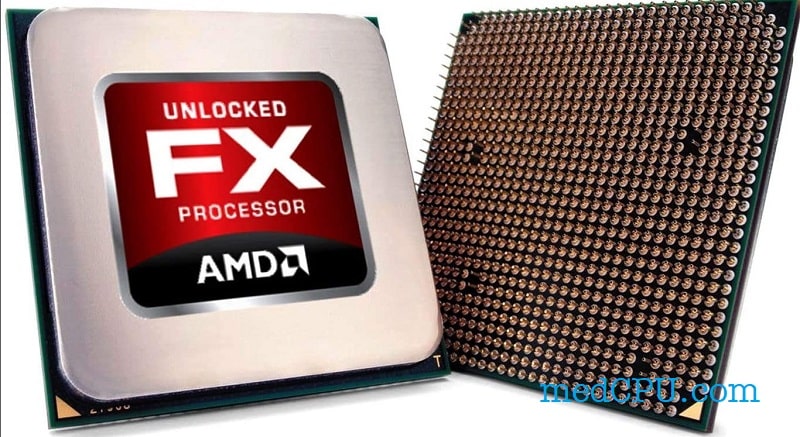 0 0 |
| Fused Multiply-Add (FMA) | ||
| Intel® Advanced Vector Extensions (AVX) | ||
| Intel® AES New Instructions | ||
| Fused Multiply-Add 4 (FMA4) | ||
| AMD Virtualization (AMD-V™) |
AMD FX-4350 vs. AMD FX-6300
AMD FX-4350
AMD FX-4350 runs with 4 and 4 CPU threads It runs at 4.30 GHz base 4.30 GHz all cores while the TDP is set to 125 W .The processor plugs into an AM3+ CPU socket This version includes 8. 00 MB of L3 cache on a single chip, supports 2 to support DDR3-1866 RAM, and supports PCIe Gen . Tjunction is kept below — degrees C. In particular, the Vishera (Bulldozer) Architecture is advanced beyond 32 nm and supports AMD-V . The product was launched Q2/2013
AMD FX-6300
AMD FX-6300 runs with 6 and 4 CPU threads It runs at 4.10 GHz base 4.10 GHz all cores while TDP is set to 95 W .CPU connects to AM3+ CPU socket This version includes 8.00 MB of L3 cache on a single die, supports 2 to support RAM, and supports 3.0 PCIe Gen . Tjunction stays below 71°C degrees C. In particular, the Vishera (Bulldozer) architecture is advanced over 32 nm and supports AMD-V. The product was launched Q4/2012
AMD FX-4350
AMD FX-6300
 30GHz
30GHz  00MB
00MB Show more details
Show more details
Cinebench R20 (Single-Core)
Cinebench R20 is the successor to Cinebench R15 and is also based on Cinema 4 Suite. Cinema 4 is software used all over the world to create 3D forms. The single-core test uses only one CPU core, the number of cores or hyper-threading capability is not taken into account.
Cinebench R20 (Multi-Core)
Cinebench R20 is the successor to Cinebench R15 and is also based on Cinema 4 Suite. Cinema 4 is software used all over the world to create 3D forms. The multi-core test uses all the CPU cores and has a big advantage of hyper-threading.
Cinebench R15 (Single-Core)
Cinebench R15 is the successor to Cinebench 11.5 and is also based on the Cinema 4 Suite. Cinema 4 is software used all over the world to create 3D shapes. The single-core test uses only one CPU core, the number of cores or hyper-threading capability is not taken into account.
Cinebench R15 (Multi-Core)
Cinebench R15 is the successor to Cinebench 11.5 and is also based on the Cinema 4 Suite. Cinema 4 is software used all over the world to create 3D shapes. The multi-core test uses all the CPU cores and has a big advantage of hyper-threading.
Geekbench 5, 64bit (Single-Core)
Geekbench 5 is a memory-intensive, cross-platform test. A fast memory will greatly push the result. The single-core test uses only one CPU core, the number of cores or hyper-threading capability is not taken into account.
Geekbench 5, 64bit (Multi-Core)
Geekbench 5 is a memory-intensive, cross-platform test. A fast memory will greatly push the result. The multi-core test uses all the CPU cores and has a big advantage of hyper-threading.
Blender 2.81 (bmw27)
Blender is a free 3D graphics software for rendering (creating) 3D bodies that can also be textured and animated in the program. The Blender test creates predefined scenes and measures the time(s) required for the entire scene. The less time it takes, the better. We chose the bmw27 as our reference scene.
Geekbench 3, 64bit (Single-Core)
Geekbench 3 is a cross-platform benchmark that is memory intensive. A fast memory will greatly push the result. The single-core test uses only one CPU core, the number of cores or hyper-threading capability is not taken into account.
Geekbench 3, 64bit (Multi-Core)
Geekbench 3 is a cross-platform benchmark that is memory intensive. A fast memory will greatly push the result. The multi-core test uses all the CPU cores and has a big advantage of hyper-threading.
Cinebench R11.5, 64bit (Single-Core)
Cinebench 11.5 is based on Cinema 4D Suite, a software that is popular for creating shapes and other things in 3D. The single-core test uses only one CPU core, the number of cores or hyper-threading capability is not taken into account.
Cinebench R11.5, 64bit (Multi-Core)
Cinebench 11.5 is based on the Cinema 4D Suite, a software that is popular for creating shapes and other things in 3D. The multi-core test uses all the CPU cores and has a big advantage of hyper-threading.
Estimated results for PassMark CPU Mark
Some of the processors listed below have been tested with CPU-Comparison. However, most of the processors were not tested and the results were evaluated by the secret patented CPU-Comparison formula. As such, they do not accurately reflect the actual values of Passmark CPU ratings and are not endorsed by PassMark Software Pty Ltd.
Energy usage estimate
Average hours of use per day
Average CPU usage (0-100%)
Cost of electricity, USD/kWh
Energy usage estimate
Average hours of use per day
Average CPU usage (0-100%)
Cost of electricity, USD/kWh
| AMD FX-4350 | AMD FX-6300 | |
| 125W | Max TDP | 95W |
| NA | Power consumption per day (kWh) | NA |
| NA | Operating cost per day | NA |
| NA | Power consumption per year (kWh) | NA |
| NA | Operating cost per year | NA |
Comments
Intel Core i3-4350 or AMD FX-6300
- Main Page
- FX-6350 SIX-Core
Compare
0029
Speed in games
Core i3-4350
55. 8 (+5.7%)
FX-6300
52.6
Production in games and similar applications, according to our tests, according to our tests .
The performance of 4 cores, if any, and performance per core has the greatest impact on the result, since most games do not fully use more than 4 cores.
The speed of caches and working with RAM is also important.
Speed in office use
Core i3-4350
62.1 (+11.1%)
FX-6300
55.2
Performance in everyday work such as browsers and office programs.
The performance of 1 core has the greatest impact on the result, since most of these applications use only one, ignoring the rest.
Similarly, many professional applications such as various CADs ignore multi-threaded performance.
Speed in heavy applications
Core i3-4350
30.2 (+1%)
FX-6300
29.9
Performance in resource-intensive tasks loading a maximum of 8 cores.
The performance of all cores and their number have the greatest impact on the result, since most of these applications willingly use all the cores and increase the speed accordingly.
At the same time, certain periods of work can be demanding on the performance of one or two cores, for example, applying filters in the editor.
Data obtained from tests by users who tested their systems with and without overclocking. Thus, you see the average values corresponding to the processor.
Speed of numerical operations
Simple household tasks |
|
Core i3-4350 58.8 (+19.7%) FX-6300 47.2 |
Demanding games and tasks |
|
Core i3-4350 23.4 FX-6300 23.4 |
Extreme |
|
Core i3-4350 4.6 FX-6300 5. |
 5 (+16.4%)
 Different tasks require different CPU strengths. A system with few fast cores and low memory latency will be fine for the vast majority of games, but will be inferior to a system with a lot of slow cores in a rendering scenario.
We believe that a minimum of 4/4 (4 physical cores and 4 threads) processor is suitable for a budget gaming PC. At the same time, some games can load it at 100%, slow down and freeze, and performing any tasks in the background will lead to a drop in FPS.
Ideally, the budget shopper should aim for a minimum of 4/8 and 6/6. A gamer with a big budget can choose between 6/12, 8/8 and 8/16. Processors with 10 and 12 cores can perform well in games with high frequency and fast memory, but are overkill for such tasks. Also, buying for the future is a dubious undertaking, since in a few years many slow cores may not provide sufficient gaming performance.
When choosing a processor for your work, consider how many cores your programs use. For example, photo and video editors can use 1-2 cores when working with filtering, and rendering or converting in the same editors already uses all threads.
Data obtained from tests by users who tested their systems both with overclocking (maximum value in the table) and without (minimum). A typical result is shown in the middle, the more filled in the color bar, the better the average result among all tested systems.
Benchmarks
Benchmarks were run on stock hardware, that is, without overclocking and with factory settings. Therefore, on overclocked systems, the points can noticeably differ upwards. Also, small performance changes may be due to the BIOS version.
Basic
| Manufacturer | Intel | AMD |
| DescriptionInformation about the processor, taken from the official website of the manufacturer. | Intel® Core™ i3-4350 Processor (4M Cache, 3. 60 GHz) 60 GHz) |
|
| ArchitectureCode name for the microarchitecture generation. | Haswell | |
| Process The manufacturing process, measured in nanometers. The smaller the technical process, the more perfect the technology, the lower the heat dissipation and power consumption. | 22 | No data |
| Release dateMonth and year of the processor’s availability. | 09-2016 | 09-2015 |
| Model Official name. | i3-4350 | |
| Cores The number of physical cores. | 2 | 6 |
ThreadsNumber of threads. The number of logical processor cores that the operating system sees. The number of logical processor cores that the operating system sees. |
4 | 6 |
| Multi-Threading Technology With Intel’s Hyper-threading and AMD’s SMT technology, one physical core is recognized as two logical cores by the operating system, thereby increasing processor performance in multi-threaded applications. | Hyper-threading (note that some games may not work well with Hyper-threading, you can disable the technology in the BIOS of the motherboard for maximum FPS). | Missing |
Base frequencyGuaranteed frequency of all processor cores at maximum load. Performance in single-threaded and multi-threaded applications and games depends on it. It is important to remember that speed and frequency are not directly related. For example, a new processor at a lower frequency may be faster than an old one at a higher one. |
3.6 GHz | 3.5 GHz |
| Turbo frequency The maximum frequency of one processor core in turbo mode. Manufacturers allow modern processors to independently increase the frequency of one or more cores under heavy load, due to which performance is noticeably increased. It may depend on the nature of the load, the number of loaded cores, temperature and the specified limits. Significantly affects the speed in games and applications that are demanding on the frequency of the CPU. | No data | No data |
| L3 cache size The third level cache acts as a buffer between the computer’s RAM and the processor’s level 2 cache. Used by all cores, the speed of information processing depends on the volume. | 4 | No data |
| Instructions | 64-bit | |
| Extended instruction set Allows you to speed up calculations, processing and execution of certain operations. Also, some games require instruction support. |
SSE4.1/4.2, AVX 2.0 | |
| Embedded Options Available Two enclosure versions. Standard and designed for mobile devices. In the second version, the processor can be soldered on the motherboard. | No | No |
| Bus frequency The speed of communication with the system. | 5 GT/s DMI2 | |
| Number of QPI links | ||
| TDPThermal Design Power is an indicator that determines heat dissipation in standard operation. The cooler or water cooling system must be rated for a larger value. Remember that with a factory bus or manual overclocking, TDP increases significantly. | 54 | No data |
| Cooling system specifications | PCG 2013C |
Video core
Integrated graphics core Allows you to use your computer without a discrete graphics card. The monitor is connected to the video output on the motherboard. If earlier integrated graphics made it possible to simply work at a computer, today it can replace budget video accelerators and makes it possible to play most games at low settings. The monitor is connected to the video output on the motherboard. If earlier integrated graphics made it possible to simply work at a computer, today it can replace budget video accelerators and makes it possible to play most games at low settings. |
Intel® HD Graphics 4600 | |
| GPU base clockFrequency in 2D and idle. | 350 | No data |
| Max GPU ClockMaximum 3D clock. | 1150 | No data |
| Intel® Wireless Display (Intel® WiDi) Supports Wireless Display technology over Wi-Fi 802.11n. Thanks to it, a monitor or TV equipped with the same technology does not require a cable to connect. | No data | |
Supported monitorsThe maximum number of monitors that can be connected to the integrated video core at the same time. |
3 |
RAM
| Maximum amount of RAMThe amount of RAM that can be installed on the motherboard with this processor. | 32 | No data |
| Supported type of RAM The type of RAM depends on its frequency and timings (speed), availability, price. | DDR3-1333/1600, DDR3L-1333/1600 @ 1.5V | |
| RAM Channels The multi-channel memory architecture increases data transfer speed. On desktop platforms, two-channel, three-channel and four-channel modes are available. | 2 | |
| RAM bandwidth | 25.6 GB/s | |
| ECC Memory Support for error-correcting memory that is used in servers. Usually more expensive than usual and requires more expensive server components. However, second-hand server processors, Chinese motherboards and ECC memory sticks, which are sold relatively cheaply in China, have become widespread. |
No data | No data |
PCI
| PCI-E The PCI Express computer bus version. The bandwidth and power limit depend on the version. There is backward compatibility. | No data | No data |
| PCI | Up to 1×16, 2×8, 1×8+2×4 | Up to 1×16, 2×8, 1×8+2×4 |
| Number of PCI lanes | 16 | Up to 1×16, 2×8, 1×8+2×4 |
Data Security
AES-NI The AES command set extension speeds up applications that use appropriate encryption. |
No data | No data |
| Intel® Secure Key An RDRAND instruction that allows you to create a high performance random number generator. | No data | No data |
Decoration
| Dimensions | No data | No data |
| Supported sockets | No data | No data |
| Maximum processors per motherboard | No data | No data |
Which is better
Intel Core i3-4350
- On average, gaming performance is 3% better.
- The speed of work in office applications and browsers is increased by 7%.

- The base frequency is 0.1 GHz higher.
AMD FX-6300
- Faster and 1% better in complex multi-threaded applications.
- $20 down
- 4 more physical cores.
- 2 more threads.
AMD FX-6300 vs AMD FX-8300 comparison
| AMD FX-6300 | AMD FX-8300 |
|---|---|
| Both processors from amd0535 | |
| Both processors have a die area of 315 sq. mm | |
| AMD FX-6300 | AMD FX-8300 |
|---|---|
| FX-6300 Strongly behind the number of 8 | |
| FX-6300 is very far behind in terms of number of threads, 6 vs. 8 | FX-8300 is far superior in terms of number of threads, 8 vs. 6 6 |
| FX-630 does not win much frequencies, 3500 MHz vs. 3300 MHz | FX-8300 is slightly behind in terms of clock frequency, 3300 MHz vs. 3500 MHz |
| FX-6300 is not far behind in terms of frequency, 4100 MHz0535 | FX-8300 slightly better in terms of auto overclocking, 4200 MHz compared to 4100 MHz FX-6300 |
| AMD FX-6300 supports PCI Express version 3.0 | 0 supports PCI Express version 3.0 |
| The L1 cache of the FX-6300 CPU is much smaller compared to the FX-8300 and is 288 KB | The L1 cache of the FX-8300 is much larger than that of the FX-6300 and equals 385 Kilobytes 905 |
| The FX-6300 L2 cache is much smaller compared to the FX-8300 and is 6144 Kilobytes | The FX-8300 L2 cache is much larger than the FX-6300 and is 8192 KB |
Comparison of instructions and technologies
| Technology or instruction name | AMD FX-6300 | AMD FX-8300 | Short description |
|---|---|---|---|
| Turbo Core | AMD Auto Overclocking Technology . |
| Technology or instruction name | AMD FX-6300 | AMD FX-8300 | Short description |
|---|---|---|---|
| PowerNow! | PowerNow! idle frequency reduction technology. |
| Technology or instruction name | AMD FX-6300 | AMD FX-8300 | Short description |
|---|---|---|---|
| MMX (Multimedia Extensions) | Multimedia extensions. | ||
| SSE (Streaming SIMD Extensions) | Streaming SIMD processor extension. | ||
| SSE2 (Streaming SIMD Extensions 2) | Processor Streaming SIMD Extension 2. |
||
| SSE3 (Streaming SIMD Extensions 3) | Processor Streaming SIMD Extension 3. | ||
| SSSE3 (Supplemental Streaming SIMD Extension 3) | Additional SIMD Extensions for Streaming 3. | ||
| SSE4 (Streaming SIMD Extensions 4) | Processor Streaming SIMD Extension 4. | ||
| AES (Intel Advanced Encryption Standard New Instructions) | Command system extension. | ||
| AVX (Advanced Vector Extensions) | Command system extension. | ||
| F16C (16-bit Floating-Point conversion) | 16-bit floating point conversion. |
||
| FMA3 (Fused Multiply-Add 3) | Multiply Add with Round One (FMA3). | ||
| SSE4A (Streaming SIMD Extensions 4A) | — | Processor Streaming SIMD 4A Extension. | |
| BMI1 (Bit manipulation instructions 1) | BMI1 bit control command set. | ||
| AMD64 | 64-bit microprocessor architecture developed by AMD. | ||
| FMA4 (Fused Multiply-Add 4) | Multiply Add with Round One (FMA4). | ||
| XOP (eXtended Operations) | Advanced operations. | ||
| FMA (Fused Multiply-Add) | Fused multiplication-addition.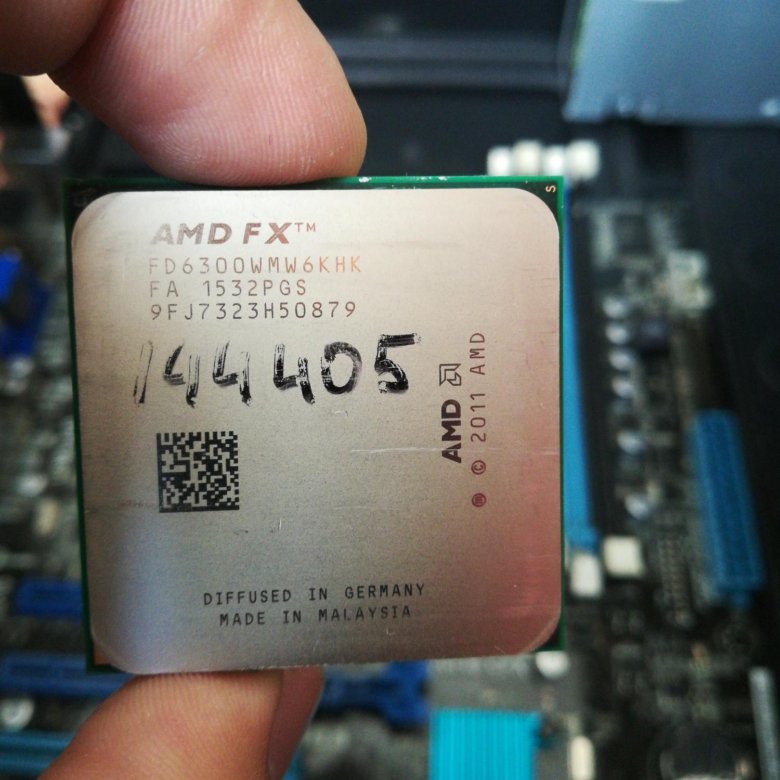 |
| Technology or instruction name | AMD FX-6300 | AMD FX-8300 | Short description |
|---|---|---|---|
| EVP (Enhanced Virus Protection) | Improved virus protection. |
| Technology or instruction name | AMD FX-6300 | AMD FX-8300 | Short description |
|---|---|---|---|
| AMD-V | AMD-V Virtualization Technology. |
| Technology or instruction name | AMD FX-6300 | AMD FX-8300 | Short description |
|---|---|---|---|
| TBM (Trailing Bit Manipulation) | End Bit Manipulation. |
Other data
| Technology or parameter name | AMD FX-6300 | AMD FX-8300 |
|---|---|---|
| Voltage P0 Vcore | Min: 1.15 V — Max: 1.3875 V | Min: 1.075 V — Max: 1.2875 V |
Benchmarks
Overall performance rating
The main rating can be calculated by the formula, taking into account all the data: test results of all benchmarks, socket, temperature conditions, release year, structure, frequency, auto-overclocking technologies, number of cores and threads, instructions , and much more. The results of the overall rating showed that the FX-8300 processor is not much superior to its rival FX-6300. The FX-6300 processor itself managed to score 4755.28 points, slightly outperforming its competitor.
PassMark CPU Mark
All of our CPUs have passed the PassMark test. It includes a large pool of tools for a large-scale assessment of the performance of personal computers, in particular the CPU. Among the tests there are compression, floating point calculations, encryption, integer calculations, game physics calculations, extended instructions checking, multi-threaded and single-threaded tests. At the same time, it is possible to compare indicators with other configurations in the database. Perhaps the most famous benchmark tester on the web. The Performance Test showed a clear advantage for the FX-8300 processor (5260 points) over the FX-6300 (4137 points). The FX-6300 with a score of 4137 clearly loses in this test.
Cinebench 10 (32 bit) Single-threaded test
It is possible to test multiple processor systems. This benchmark for testing video cards and processors is very outdated in our time. The test is carried out under the control of Windows, Mac systems. Released by MAXON, and based on the Cinema 4D 3D editor. Uses the ray tracing method. The main performance test mode is spatial light sources, working with light, global illumination simulation, multi-level reflections, photorealistic rendering of a 3D scene, and procedural shaders. Single version — in its test uses only one thread for rendering and one core.
Cinebench 10 (32 bit) Multi-threaded test
Multi-Core version is another testing option in Cinebench R10, which already uses multi-threaded and multi-core testing method. It should be taken into account that the possible number of threads in this version of the program is limited to 16.
Cinebench 11.5 (64-bit) Multi-threaded test
64-bit version of the CINEBENCH R11.5 benchmark — which has the ability to test the processor to the fullest, using all threads and cores. It differs from previous versions of the program, 64 threads are supported here. Testing the FX-8300 in the Cinebench 11.5 benchmark showed a result of 6.17 points, slightly ahead of its competitor. At this time, the FX-6300 gets its 5. 31 points, which fully justifies their close positions in the ranking.
Cinebench 11.5 (64-bit) Single-threaded test
Good old fully functional Cinebench 11.5 from Maxon. His tests are still relevant today. In this Single-Core variant, tests are performed using one core and one thread. In testing, the ray tracing process is also used, a highly detailed 3D space is calculated with a large number of translucent and crystalline and glass balls. The result of the check is the value » frame rate per second «. Testing in single-threaded mode of the FX-6300 processor in Cinebench 11.5 Single-Core showed that with a score of 0.73 points, it is not far ahead of the competitor. But the FX-8300 itself scored 0.64 points in this test.
Cinebench 15 (64-bit) Multi-threaded test
Multi Core version of Cinebench 15 — will test your system to the full, demonstrating what it is capable of. All threads and processor cores are turned on when rendering high-poly 3D objects. The program is suitable for testing new multi-threaded processors from AMD and Intel. it can use 256 computational threads. The FX-8300, with a score of 649, unconditionally scores more in the Multi-Core test from Cinebench 15. While its competitor FX-6300 is far behind with a score of 456 in the test.
Cinebench 15 (64-bit) Single-threaded test
Cinebench Release 15 is the latest benchmark from the Finnish company Maxon. The Single Core version uses 1 thread for rendering. The whole system is tested: both video cards and processors. For processors, the result of the analysis is the number of PTS points, and for video cards, the number of frames per second. FPS. A complex 3D scene is rendered with many objects, light sources and reflections. Single-threaded test of the FX-8300 processor in the Cinebench R15 program showed a result of 96 points, slightly ahead of the competitor. With a score of 94 on this test, the FX-6300 is not far behind.
Geekbench 4.
 0 (64-bit) Multi-threaded test
64-bit multi-threaded Geekbench 4 benchmark. It is the wide multi-platform device and OS support that makes Geekbench tests the most common today. That’s already In Geekbench 4, the 64-bit multi-core processor FX-8300 received 9688 points, which is slightly higher than that of the FX-6300. In this test, the FX-6300 scores its 8615 points.
Geekbench 4.0 (64-bit) Single-threaded test
The current single-threaded version of Geekbench 4 for testing laptops and desktop PCs. The Single-Core version uses 1 thread. For the first time, both iOS and Android smartphones and tablets are supported in this version of the benchmark. The program, like its earlier versions, runs on systems: Windows, Mac OS, Linux. The FX-8300 scores the highest in Geekbench 4 single-threaded testing with a score of 2797 points, but not much ahead of the opponent. But the FX-6300 itself also showed a good score of 2743 points, slightly losing its place to the FX-8300 model.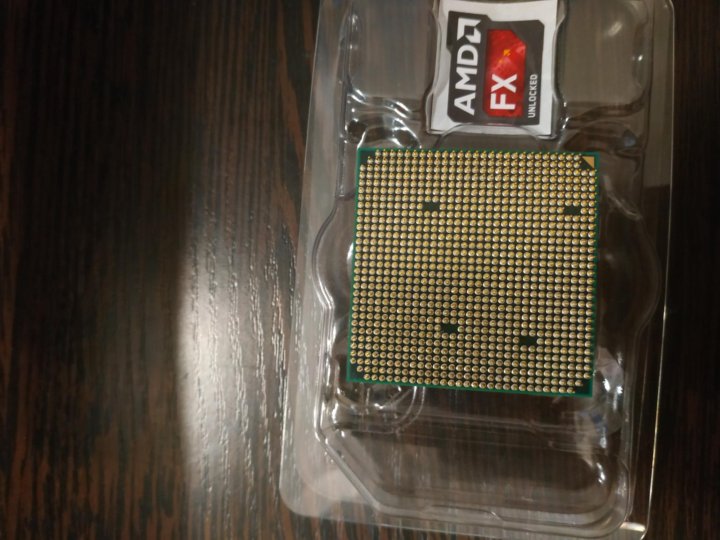
Geekbench 3 (32 bit) Multi-thread test
The Multi-Thread version of Geekbench 3 can provide a powerful «strength» test of your CPU and demonstrate how powerful your system is.
Geekbench 3 (32 bit) Single-threaded test
The Geekbench cross-platform benchmark is often used to evaluate the system under Mac, although it will run on both Windows and Linux. The basic purpose is to check the performance of processors. The 32-bit version of the test loads no more than one processor core and one thread.
Geekbench 2
Now outdated version of the Geekbench 2 tester. There are almost two hundred processor models on our website that have test results in this benchmark. To date, there are newer updates, the fifth and fourth.
X264 HD 4.0 Pass 1
This is a practical test of system performance by transcoding HD video files to the new H.264 format, the so-called MPEG 4 x264 codec. Frame rate processed per sec. — test result. An ideal benchmark for multi-core and multi-threaded CPUs. This test is faster than Pass 2 because the calculation is done at a constant speed. The MPEG 4 video processing speed of the FX-8300 is significantly higher at 149.23 fps. But the FX-6300 did a poor job, its speed was 116.19 FPS.
X264 HD 4.0 Pass 2
This is a slightly different, slower test based on video file compression. It is important to understand that a very real task is being simulated, and the x264 codec is used in a large number of encoders. The same MPEG4 x264 codec is used, but the processing is already happening at an inconsistent rate. The result is a better quality video file. The final value is also defined in frames per second. Therefore, the test results realistically assess the performance of the platform. During the encoding of a video file by the FX-8300 processor into mpeg4 format, a processing speed of 35.24 Frames / s was obtained. While the FX-6300 trailed slightly behind with 28. 21 fps.
3DMark06 CPU
This test is often used by overclockers, gamers and overclockers. Written using the DirectX API by Futuremark. Benchmark for testing video system, and CPU. The processors are tested in two ways: the AI does the pathfinding, and the other test simulates the game engine using PhysX. The FX-8300 performed significantly faster in the pathfinding and game physics tests, with a score of 7679.88. The FX-6300 processor coped worse with this task, receiving 5884.4 points.
3DMark Fire Strike Physics
Approximately 2 hundred CPUs on our website have 3DMark FSP test data. It presents a math test that makes calculations in game physics. In 3DMark’s Fire Strike Physics test, the FX-8300 was faster with a score of 6090. The FX-6300 does not lag behind, although it scored less: 4900 points.
WinRAR 4.0
A familiar file archiver. The tests were performed under Windows OS. The speed of compression by the RAR algorithm was estimated; for these purposes, huge amounts of randomly generated data were used. The resulting speed during compression «kilobytes per second» — this is the result of the test. FX-8300 has a clear advantage in WinRAR data compression and packing speed, the result of file processing was 3420.38 Kb/s. The FX-6300 was far behind it, the speed of which did not exceed 2603.35 Kb / s.
TrueCrypt AES
Not exactly a tester, but the results of his work can help evaluate system performance. Our site presents the results of encryption speed in Gb / s using the AES algorithm. It can run on Mac OS X, Linux and Windows operating systems. It so happened that support for this project was stopped on May 28, 2014. The program has a built-in ability to quickly encrypt disk partitions.
Comprehensive overclocking of AMD FX 6300. +40% to FPS
Detailed overclocking guide for AMD FX 6300 processor on socket AM3+. As a result, we get an increase in performance in games up to + 40% FPS, in synthetic tests up to 49%, in Adobe Premiere Pro + 25% and + 28% in the speed of writing and reading RAM. All this with budgetary cooling.
Interesting?
We will overclock the frequency of the processor, RAM, North Bridge (NB) and Hyper Trance (HT) bus.
FX 6300 will be overclocked on ASUS M5A97 LE R2.0 motherboard. But you can repeat this process on any AM3+ board. I will give you information on where the settings we need are located on motherboards from other manufacturers (Gigabyte, MSI, Asus).
Overclocking the fx 8350 also read on the site, the overclocking of the FX 8350 took place on a motherboard from Gigabyte.
If you prefer video format, you can watch FX 6300 overclocking in video format on our youtube channel:
Purpose of overclocking FX 6300
Adobe Premiere Pro software.
The main problem with FX series processors is the minimum FPS or 1% Low. Because of this, starters and friezes can slip in games. Comprehensive overclocking of the six-core FX6300 allows you to solve these problems and even raise the average FPS, which, even without overclocking, is at the level of a comfortable game of 50-60 FPS at maximum settings.
Test gtx1060 vs rx 580 in top games.
Features of the Pildriver architecture on which AMD FX
processors work
Many people know about the weak memory subsystem of this architecture. All processors of the FX series have a huge overclocking potential, on the one hand, and a dead memory subsystem in the form of an L3 cache. This memory does not allow the processor to load all the logical threads in order to provide them with instructions.
Processor needs high memory and northbridge (NB) bandwidth. The point is that the L3 cache in the Pildriver architecture (on which AMD FX chips are built) operates at the northbridge (NB) frequency and its speed is not enough to load all the FX6300 logical threads.
Therefore, the main task is to overclock the CPU / NB memory controller, RAM and processor frequency. Only when overclocking the processor in combination with the memory subsystem, we can count on a serious performance boost.
And it makes no sense to drive one processor frequency in this architecture, we will only increase the throughput inside the processor, and L3 cache will remain a bottleneck. Because of what we get the so-called corn overclocking.
Let’s move on to the test configuration …
Test configuration for overclocking
- Processor : AMD FX 6300. 6 cores, 6 threads at up to 3.8 GHz in turbo boost. TDP 95W.
- Motherboard : Asus M5A97 LE R 2.0 socket AM3+.
- Cooling System : AMD Wraith Prism with heatsink up to 125W.
- RAM : Kingston HyperX Fury. Kit for 8 Gb with two sticks of 4. At the factory frequency of 1866 MHz in dual-channel mode.
- Video card from NVIDIA : Gigabyte GTX 1060 with 3 GB of video memory.
- SSD : Kingston A400 240 Gb. For Windows 10 operating system.
- HDD : Western Digital Blue 1TB with 7200rpm spindle speed and 64MB cache for games.
- Power supply : Aerocool VX-600 at 600W.
Instructions and recommendations before overclocking
- Frequencies and voltages that have been stabilized on the test stand, not the fact that they will work just as stably for you.
And you may have to adjust the frequencies and voltages for your motherboard and processor, even if they are identical.
- Make sure your cooler is capable of dissipating at least 125 watts of heat.
- Be prepared for the fact that the system will behave unstable, crash into a blue screen, freeze, flicker and slow down at the time of entering the system. This is normal during acceleration.
- Remember that you do this at your own peril and risk, I will give conditionally safe values of voltages and frequencies, above which it is advisable not to go.
- Radeon ReLive recording averages 5 frames of frame loss. I also do not claim the accuracy of the FPS readings. But you will see the dynamics of personnel changes clearly.
System baseline in BIOS (out of the box)
If you have not changed anything yet, then by default we will have the following values:
- Processor (CPU) frequency : 3.5GHz with turbo boost up to 3.
8GHz.
- Random access memory (RAM) : 1866MHz.
- Integrated northbridge (NB) : 2000MHZ.
- Hypertransport bus (HT) : 2000MHZ
- All bios power saving features enabled .
We will test the system performance at the minimum graphics settings in order to exclude the dependence of the result on the video card. These are the main indicators that you should rely on.
Test at maximum settings only for those who do not perceive other results than 1080p at maximum settings. To understand what you can count on with a GTX 1060 3Gb video card (since performance will rest on the card).
Tests will be conducted in FULL HD resolution, at maximum graphics presets.
Let’s see what this configuration can do out of the box.
System benchmarks in default state (before overclocking)
Cinebench R20 (default bios settings)
Cinebench R20 results (default)
Results:
- Per single core (sigle core): 197
in multithread
Adobe Premiere Pro (default bios settings)
Adobe Encoder. export media. h364. Full HD
Media file export in Adobe Premiere Pro 2020 using a single processor completed in 2 minutes 9second.
Aida 64 Cash & Memory Benchmark (default bios settings)
Memory test in AIDA 64
Write speed to RAM is 23922 MB/s, read speed is 14454 MB/s.
Let me remind you, this is at a frequency of 1866 MHz, and a frequency of NB 2000MHz.
The Witcher: Wild Hunt (default bios settings)
Minimum and average FPS in The Witcher: Wild Hunt (default)
Minimum graphics settings:
- 1% low — 53 fps
- AVG — 77 fps
Maximum graphics settings:
- 1% low — 23 fps
- AVG — 38 fps
Hitman 2 (default bios settings)
Minimum and average FPS in Hitman 2 (default) 902 902 Minimum graphics settings
Maximum graphics settings:
- 1% low — 35 fps
- AVG — 62 fps
9002 Maximum graphics settings:
0023 1% low — 29 fps
Star Wars Jedi: Fallen Order (default bios settings)
Minimum and average FPS in Star Wars Jedi: Fallen Order (default)
Minimum graphics settings:
- 1% low — 30 fps
- AVG — 54 fps
Maximum graphics settings:
- Battlefield V (default)
Minimum graphics settings:
- 1% LOW — 25 FPS
- AVG — 52 FPS
Maximum graphics settings:
- 1% LOW — 13 FPS
- AVG — 35 FPS
- On ASUS boards — these options are in Advanced Mode / Advanced / CPU Configuration /
- On GIGABYTE 9 boards0673 — These parameters are located in the M.I.T. / Advanced Frequency Settings / Advanced CPU Core Features
- On MSI boards — located in the OC / CPU Features section
- CPU Load Line Calibration switch to Enabled
- CPU/NB Load Line Calibration switch to Enabled
- On ASUS boards — Advanced Mode / CPU Load Line Calibration
- On GIGABYTE boards — LLC can be changed in the M.I.T. / Advanced Voltage Settings / VCORE Loadline Calibration
- MSI — LLC boards are NOT
- ASUS — Advanced Mode / AI Tweaker / CPU Ratio
- GIGABYTE — 90.IIT / Advanced Frequency Settings / CPU Clock Ratio
- On MSI boards — OC / Adjust CPU Ratio
- On ASUS boards — Advanced Mode / AI Tweaker / CPU & Voltage / CPU Manual Voltage
- On GIGABYTE 9 boards0673 — M.I.T. / Advanced Voltage Settings / CPU Vcore
- On MSI boards — OC / CPU Voltage
- Advanced Mode / AI Tweaker / Dram O.
C. Profile — set DDR3-2133MHz
- Memory Frequency — DDR3-2133MHz
- On Gigabyte boards — M.I.T. / Advanced Memory Settings / System Memory Multiplier
On MSI boards — OC / Dram Frequency - On ASUS boards — Advanced Mode / AI Tweaker / DRAM Voltage
- On GIGABYTE boards — M.I.T. / Advanced Voltage Settings / Dram Voltage
On MSI boards — OC / Dram Voltage - On ASUS boards — Advanced Mode / AI Tweaker / CPU / NB Frequency
- On GIGABYTE boards — M.
I.T. / Advanced Frequency Settings / CPU Northbridge Frequency
- On MSI boards — OC / Adjust CPU-NB Ratio (there is information that does not work in Windows, it only changes in BIOS).
- On ASUS boards — Advanced Mode / AI Tweaker / CPU / CPU & NB Voltagae / CPU / NB Manual Voltage
- On Gigabyte 90.IT boards — M.IT. / Advanced Voltage Settings / NB Core
- On MSI boards — OC / CPU-NB Voltage
- Single core (sigle core): 215 points
- In multithread: 1011 points
- 1% LOW — 54 FPS
- AVG — 85 FPS
- 1% LOW — 27 FPS
- AVG — 41 FPS
- 1% low — 39 fps
- AVG — 65 fps
- 1% low — 30 fps
- AVG — 54 fps
- 1% low — 45 fps
- AVG — 76 fps
9000 9000 9000 9000 9000 9000 the biggest problem in games is the very low FPS in the 1% low rare event column.
This is what makes the game on AMD FX processors uncomfortable.
And the problem lies in the slow memory subsystem, which we will now overclock. Let’s start overclocking the FX 6300…
Staged overclocking of the AMD FX 6300 processor
Do not forget that the power profile is enabled in Windows — High performance, which can be changed in the Control Panel in the «Power Options» section. Power Mode in Windows 10
Be sure to install the latest BIOS version.
We go into the BIOS (Del or F2) ?
We will overclock the FX 6300 in stages. Checking every change in bios to achieve stability. This is necessary to represent the overclocking potential of your particular system blocks. This will make it easier to identify the cause of unstable behavior during complex overclocking.
First we drive the frequency of the processor, memory, northbridge.
Disabling power saving in BIOS
The first thing we need to do when overclocking is to disable all power saving features.
These options give performance degradation and instability during overclocking.
Let’s see what these functions are responsible for:
Core C6 State — control of the processor state when, in case of its weak activity, the cores, modules and parts of the cache are turned off, removing the supply voltage from them.
APM Master Mode — Enables or disables the frequency and consumption control unit built into the processor. This feature limits the maximum CPU consumption to a TDP rating of 95W (in the case of the FX6300), at the cost of reduced performance. Disabling APM in most cases breaks the operation of the turbocore.
C1E — disconnects the core from the clock generator without removing voltage from it.
Cool’N’Quiet — reduces the frequency and voltage of the cores in idle time.
HPC Mode — when Cool’N’Quiet is off, it is not needed. Since it reduces the capabilities of Cool’N’Quiet, leaving only the minimum, maximum and boost frequencies from all frequencies available for switching.
All these options are set to Disabled.
Where to find:
My result:
Advanced \ CPU Configuration >
HPC Mode I left it enabled. But you can safely turn it off. I do not have all the power management functions in the BIOS. Because at the time of the screenshot, I already had a D. O. C. P profile. Read more about this …
Processor overclocking (CPU overclocking)
Let’s start with overclocking the processor cores.
Our goal is 4.2GHz, for this we need to raise the frequency multiplier and adjust the voltage.
I overclocked my stone to 4.4 GHz, but the increase in performance is not comparable with the increase in voltages to stabilize the processor at this frequency and the increase in heating.
For such overclocking, you need a tower cooling system capable of discharging at least 200 TDP.
In the FX 8350 overclocking article, let’s see how much you can overclock a processor with bequit top-end cooling! Dark Rock Pro 4 at 250 TDP.
On Asus motherboards, in the AI Tweaker / AI Overclock Tuner / section, switch to the D. O. C. P. position (by default, the BIOS offers Auto mode). Unlock overclocking mode. Switch Ai Overclock Tuner -> D. O. C. P.
Enable CPU Load Line Calibration
First of all, enable CPU Load Line Calibration.
Enable CPU Load Line Calibration
Where to look:
For example, on ASUS boards you can simply enable LLC, and on GIGABYTE boards you need to set one of the modes: normal, extreme, etc.
The normal mode will be enough, you can switch to the extreme position.
LLC (Load Line Calibration) — a function to combat drawdowns. Overclocking used to have to deal with a very annoying phenomenon known as voltage sag or Vdroop. Vdroop is the voltage drop across the processor as the load increases. The LLC function increases the vCore voltage to compensate for its drawdown under high load.
Change the processor frequency multiplier
On ASUS motherboards, the CPU Ration parameter is responsible for this, for me it is 21, which corresponds to 4.2 GHz.
AMD Turbo CORE technology set to Disabled.
Where to find:
We select the voltage
On the ASUS board — switch CPU & NB Voltage to Manual Mode (by default, the BIOS offers offset mode).
In my case, I got the processor stable at 4.2GHz with a voltage of 1.368V (volts).
In this configuration, the processor passes the AIDA64 stress test and works stably in games and editing programs.
The voltage is controlled by the CPU Manual Voltage parameter.
Where to find:
On MSI and GIGABYTE boards, there is no way to immediately enter the voltage value we need, but only add or subtract from the existing processor VID. Those. add or decrease the current voltage by the minimum division.
When selecting the voltage, you need to find the minimum stable voltage at which the processor remains stable under load, lowering or increasing the voltage by one step.
For starters, you can set the voltage around 1.4 volts and lower it until you achieve stable operation. But you should not raise the voltage above 1.45V without top-end cooling.
Be sure to pass the AIDA64 stress test and play games for 10 minutes. To make sure everything is stable.
My result: CPU Manual Voltage
After the frequencies and voltage stabilize, write down the values and return them to the default state.
RAM overclocking
Let’s move on to overclocking DDR3 RAM. We will overclock the memory to 2133MHz. In my case, this is quite an achievable frequency, and you proceed from your memory bars.
You don’t have to stop at this frequency and go for 2300MHz or higher if your kit allows it. I didn’t touch the timings.
Overclocking the RAM frequency (without timings)
On the ASUS motherboard, we need to set the memory profiles.
On ASUS motherboard:
Where to look:
We select the voltage
Out of the box, the memory operates at a voltage of 1.5 volts. Stable memory operation was achieved at 1.65 volts.
The safe memory voltage for FX processors is up to 1.8 volts with a RAM heatsink. Without heatsink, up to 1.7 volts.
On an ASUS motherboard, the DRAM Voltage parameter of the AI Tweaker subsection is responsible for the voltage.
Where to find:
My results: RAM overclocking.
DRAM FrequncyDRAM Voltage
Test stability in AIDA 64 memory stress test or in games for 5-10 minutes.
After frequencies and voltages have stabilized, write down the values and return them to their default state.
Northbridge overclocking (CPU NB overclocking)
Let’s move on to CPU NB northbridge overclocking. We will overclock NB to 2600MHz. There is no point in overclocking higher, only if your memory sticks operate at a frequency above 2400MHz.
Overclocking the North Bridge (NB) frequency
On ASUS motherboards, the NB frequency is changed in the Ai Tweaker — CPU / NB Frequency section.
We also change the frequency of HT Link Speed, and set it to 2400 MHz. This is the HyperTransport bus. On the tested motherboard, this is the maximum value, if you have the opportunity, set it to 2600 or 2800MHz. HyperTransport must be 1 step above NB.
On other boards, the NB frequency can be changed in the following sections:
My results: CPU/NB Frequency
We select the voltage
The voltage can be changed in the CPU/NB Voltage section of the Ai Tweaker subsection on Asus motherboards.
On other motherboards this can be done :
I managed to get stable values for NB operation at a frequency of 2600Mhz with a voltage of 1.45V, which are set to auto by default. But it is better to set these values manually.
Like mine: CPU/NB Voltage
Comprehensive overclocking of all components
By now, you have overclocked the frequencies of the processor, RAM and northbridge separately.
You have data on the overclocking potential of each component and the voltages to stabilize them.
The next step is a complex overclocking of all components above.
Why am I writing about this separately? After setting all the values \u200b\u200bin the BIOS, the system may start to work unstably. Despite the fact that individually all overclocked components worked stably.
If this happens, add voltage where you think it might not be enough. Add 1 step and test again. Or you can add 1 voltage step to all components, and after obtaining a stable result, remove from each until you understand where there is not enough.
Well, let’s look at the result of overclocking the FX 6300!
AMD FX 6300 complex overclocking result
Cinebench R20
AMD FX 6300 overclocking result in Cinebench R20
Results:
In overclocking, the processor scored 215 points in single thread, 1011 in multithread.
Which is an impressive result. FX6300 overclocking result in Cinebench R20
In single-thread computing, the processor improved by 9.14%, in multi-thread by 48.68%.
Adobe Premiere Pro
Result in Adobe Premiere Pro
Exporting a media file in Adobe Premiere Pro 2020 using a single overclocked FX6300 processor completed in 1 minute 43 seconds. Which is 25% higher than the base frequency of the processor and memory subsystem. The result of overclocking the FX6300 in Adobe Premiere Pro
Aida 64 Cash & Memory Benchmark
Result in Adobe Premiere Pro
Write speed to RAM is 28128 MB/s, read speed is 18530 MB/s. and frequency NB 2600MHz. The results are very good. Write speed increased by 28.20%, read speed by 17.58%.
The Witcher: Wild Hunt
FX6300 overclocking result in The Witcher: Wild Hunt
Minimum graphics settings:
2 Maximum graphics settings:
in Witcher 3 recorded the most minimum productivity increase.
Most likely the game completely rested on the capabilities of the video card.
Hitman 2
FX6300 overclocked result in Hitman 2
Minimum graphics settings:
Maximum graphics settings:
Decent overclocking result. Average 20% for medium and rare events.
Shadow Of The Tomb Rider
FX6300 overclocked in Shadow Of The Tomb Rider
Minimum graphics settings:
Maximum graphics settings: 9002 — 30 fps
- AVG — 62 fps
An impressive increase. The only thing that practically did not react to overclocking was 1% Low at maximum settings. But the average FPS has grown by 10%. Again, these are the maximum settings, and here we run into the capabilities of the GTX 1060 3Gb video card.
Star Wars Jedi: Fallen Order
Overclocked FX6300 in Star Wars Jedi: Fallen Order
Minimum graphics settings:
- 1% low — 36
- AVG — 63
Maximum graphics settings:
- 1% low — 33
- AVG — 58
Star Wars Jedi: Fallen Order shows excellent fps growth results.