9 Years of AMD CPUs: From AMD FX to Ryzen 5000 Series, Tested
Recently we took an interesting look at how much progress Intel CPUs have made over the past six years, testing 5th-gen Core against 10th-gen Core processors’ gaming performance. We covered two angles: first we isolated gains that have come from increasing the operating frequency, and second what they achieved by adding more cores. This gave us a clear picture of the architectural refinements Intel’s achieved while stuck on their 14nm process.
Of course, over the years they’ve also achieved much greater operating frequencies while also expanding the core count. That being the case, we also took a look at how increasing to 6, 8 and even 10 cores has improved gaming performance, though we did ignore the frequency gains as that’s been well explored at this point and frequency scaling is more predictable. Ultimately, we found that Intel’s journey on the 14nm process has seen limited improvements from 5th-gen to 10th-gen, amounting to a ~10% jump in gaming performance, when comparing CPUs at the same core count and operating frequency, and that gain includes the transition from DDR3 to DDR4.
By far, the biggest performance gains for Intel have come from increasing L3 cache capacity, cranking up the operating frequency near to its limit, and of course, adding more cores. Essentially, Intel could have created their 2020 10th-gen lineup five years before with Skylake, but because there was no competitive pressure, they didn’t see the need and therefore cashed in on smaller 122mm2 dies.
Speaking of the competition, today’s review is all about AMD’s own progress using the same testing methodology. We’ll be comparing flagship parts of each generation with just 4 cores enabled at a fixed frequency, along with some current-gen parts running with all cores enabled.
Without even looking at any new numbers, we acknowledge this could paint AMD in a more positive light as we’re bound to highlight the massive gains the company has achieved since the FX days and now on Ryzen’s latest generation. However, the fact is that the company’s CPUs have come from miles behind Intel as AMD was mostly irrelevant during the FX era.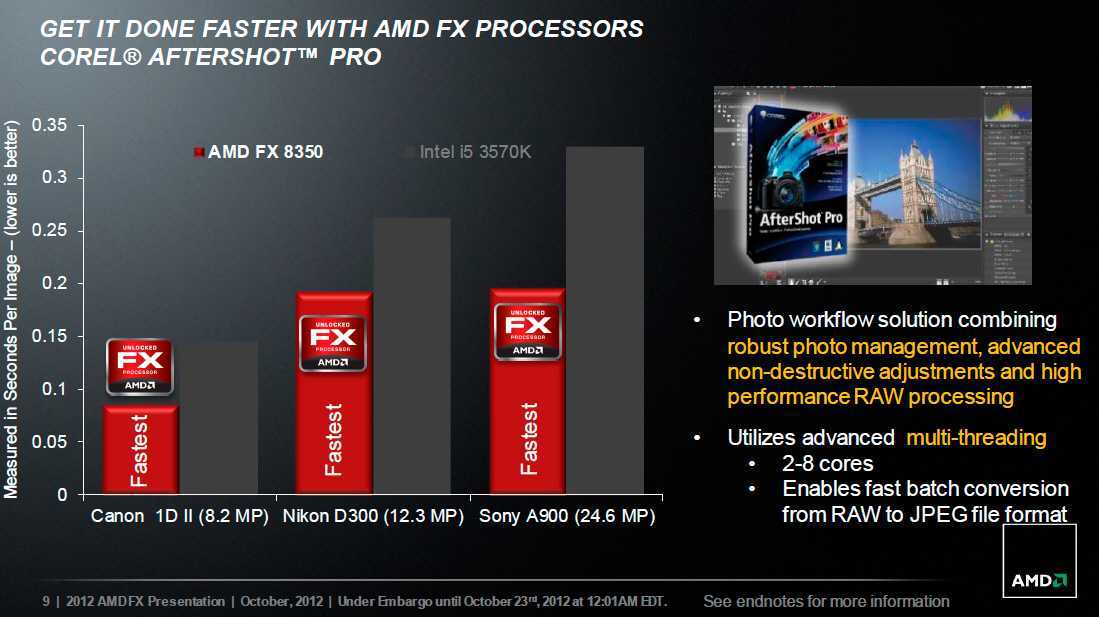
So let’s talk about what exactly we’re looking at here…
We’re going back to 2012 when AMD released the FX-8350 based on the Piledriver core using GlobalFoundries’ troubled 32nm process. Technically, the first FX series processors arrived a year prior and were codenamed Bulldozer, but we’re going to skip the FX-8150 and that entire series, we really only need one FX processor and we might as well go with with the «best,» and I do like to use that term loosely when discussing FX processors.
There was also the FX-8370 which arrived two years later and was the same CPU, as well as the super dumb FX-9370 and 9590 which were essentially the same parts again but with an increased TDP of 220 watts, or almost 80% higher than the 8350 (!). These were just overclocked models and in the case of the FX-9370 and FX-9590, the base and boost frequencies weren’t even improved by 20%.
Because we’re testing all parts at 4.2 GHz, we went with the FX-8350 and locked it at that frequency. We’re also testing with only 4 cores enabled, but since the FX series only went up to 4 cores with 8 threads, we haven’t had to make any changes here. Some might still argue that the FX-8350 is an 8 core CPU, but it’s not, and it’s certainly not according to the California Consumers Legal Remedies Act. In 2015, AMD was successfully sued for allegedly misrepresenting the specifications of Bulldozer chips and in August 2019, AMD agreed to settle the suit for $12.1M.
The latest motherboard BIOS revisions still claim the FX-8350 is an 8 core processor while Windows states it’s a 4 core CPU with 8 logical processors, so basically a quad-core with SMT support. For testing the FX-8350, we’re using the Asus M5A99FX Pro R2.0 with DDR3-2400 CL11-13-13-31 memory.
Then for comparison we have the Ryzen 7 1800X, 2700X, 3800X and 5800X. With the exception of the 1800X, we limited all CPUs to 4 cores running at 4.2 GHz. The 1800X still ran with just 4 cores enabled, but they were clocked at 4. 1 GHz as that was the highest stable frequency I could achieve with that part.
We’ve also included the Ryzen 5 5600X and Ryzen 9 5950X for 6 to 16-core comparisons and these can be directly compared with the FX-8350, though they are at a clock speed disadvantage given they’re underclocked at just 4.2 GHz.
The Ryzen 7 2700X up to the 5000 series were tested on the Gigabyte X570S Aorus Master, while the 1800X was tested on the MSI B450 Tomahawk Max.
All Ryzen CPUs were paired with DDR4-3200 CL14 dual-rank, dual-channel memory with all primary, secondary and tertiary timings manually configured. Then finally all CPU configurations were tested with the Radeon RX 6900 XT. Let’s check out the results…
Benchmarks
Starting with Rainbow Six Siege we see that the FX-8350 was good for 211 fps on average, which is obviously plenty of performance and this Vulkan title really doesn’t require a great deal of CPU performance. That said, it was still miles slower than even the first generation Ryzen part with the 1800X offering almost 40% more performance, and remember only half the Ryzen CPU is enabled, though it is heavily overclocked.
The 2700X only offered a small upgrade from the 1800X, here we’re looking at a 9% performance boost. Then as we know Zen 2 provided a sizable performance boost from Zen+, and in this example we’re looking at a 23% increase in frame rate, taking the Radeon 6900 XT to 390 fps which is an incredible 84% increase over the FX-8350.
Then we see the biggest step forward with the introduction of Zen 3 and here the 5800X with half the cores enabled was 135% faster than the FX-8350, and this highlights just how bad the FX series was, limiting the performance of the 6900 XT by more than half.
For those wondering, the 5800X has been tested in a 4+0 configuration because AMD moved to an 8-core CCX with Zen 3, where as Zen 2, Zen + and Zen featured just 4-cores per CCX. Finally, it’s interesting to see just a 9% performance increase when testing with Rainbow Six Siege when increasing the Zen 3 core count from 4 to 6 and then just a 10% performance increase when going from 4 to 16-cores.
Obviously this title doesn’t heavily leverage the CPU and it’s why the FX-8350 is able to deliver highly playable performance.
The experience playing Assassin’s Creed Valhalla is very different, at least with the FX-8350. Whereas things remained very smooth in Rainbow Six Siege, constant stuttering was very noticeable when playing Valhalla with a 1% low result of just 39 fps. The 1800X boosted 1% low performance by almost 60% and this provided a significantly better gaming experience.
The 2700X was much faster again, boosting 1% low performance by a further 21% and then we came very close to maxing out the 6900 XT with the 3800X. In fact, the 4-core 5800X wasn’t any faster while the full fledged 5950X only improved the frame rate by 7%.
Battlefield V is a great example of just how bad the AMD FX series was, and of course, still is. It seems the more you leverage the FX processors, the more they fall apart. Low-level APIs like Vulkan which help bypass the CPU, resulting in significantly less CPU overhead, often play well with heavily underpowered CPUs, such as the FX-8350 and we just saw that a moment ago in Rainbow Six Siege.
But playing Battlefield V using the preferred DX11 API for this title, the FX-8350 crumbles. With just 47 fps on average and a 29 fps 1% low the game was completely unplayable by my standards and utterly useless for even semi-competitive gameplay, and remember we’re using a Radeon RX 6900 XT for this testing.
The Ryzen 7 1800X, on the other hand, was 160% faster, that’s a 160% performance uplift from one generation to the next for AMD, a failed generation to a somewhat successful generation. AMD were then able to improve performance by a further 11% with the Zen+ update and then another 16% with Zen 2, as the 3800X allowed for 158 fps on average.
Then with Zen 3 we see a further 21% performance increase hitting 191 fps, a 306% increase from the FX-8350.
Going from the 4-core configuration using the 5800X, performance in this title was boosted by 10% with 6-cores and then 27% with 16-cores. That means the Ryzen 9 5950X is offering 415% more performance than the FX-8350, wow.
F1 2020 isn’t the most demanding title and it also supports DirectX 12. So here the FX-8350 does reasonably well and certainly enables an enjoyable and very playable gaming experience. Even so we’re still looking at a 46% performance uplift with the 1800X, which again only has half the cores enabled for a more apples to apples comparison of the architectures.
Again AMD made a small step with 2nd-gen Ryzen, here the 2700X offered a 9% performance uplift and then we see a further 15% uplift with 3rd-gen. When we see a rather substantial 24% increase from the 3800X to the 5800X, hitting 266 fps.
Then when enabling more cores for the Zen 3 architecture, we see a 14-15% boost going from just 4 cores up to 16 cores. In this example, the 5950X was 162% faster than the FX-8350, and we’re looking at a similar margin for the 6-core version.
Hitman 2 is far more CPU intensive than F1 2020 and this causes issues for the FX-8350. The game was more playable than Battlefield, but the experience with a 6900 XT wasn’t ideal to say the least. The 1800X offered a 67% increase to the average frame rate and an improvement in 1% low performance of 82%, so the 1st generation Ryzen processor was miles faster.
We see similar performance improvements throughout the Ryzen generations, and by the time we hit Zen 3, AMD has improved performance from the FX-8350 by 147% when making a normalized core and frequency comparison.
Then from the 4-core 5800X configuration, the 6-core 5600X was 10% faster and the 16-core 5950X 21% faster. We’re looking at roughly a 200% performance increase from the FX-8350 to the 5950X, with both CPUs running at 4.2 GHz.
Horizon Zero Dawn plays well on the FX-8350 and what we have here is a game using a low-level API that’s not particularly CPU demanding again. Even so, the 1800X with half its cores enabled offered 35% greater performance and by the time we reach the 5800X, which still only has half its cores enabled, we’re looking at a 105% performance improvement from the FX processor.
Interestingly, adding more cores doesn’t do much for this game, so if there was a quad-core Zen 3 CPU it would be more than capable of getting very near the most out of the 6900 XT in this game.
Cyberpunk 2077 is another game that makes use of a low level API, but this games is very CPU demanding and as a result the FX-8350 tanks, delivering a 1% low result of just 32 fps and let me tell you, compared to every other CPU tested, the experience with the FX processor was horrible.
Even the 1800X with half its cores enabled was able to improve 1% low performance by 94%, an incredible performance uplift. Then from the 1800X to the 5800X AMD was able to improve their core performance by 53%, seen when looking at the average frame rate. Then with 2 more cores enabled the 1% low performance is improved the most, going from 86 fps to 101 fps, so a nice 17% performance boost.
The 5600X and 5950X delivered virtually the same level of performance in this title and that meant the 5600X was 216% faster than the FX-8350 when comparing 1% low performance.
Shadow of the Tomb Raider is another DX12 title that’s very CPU demanding. For testing we don’t use the built-in benchmark as it’s more of a GPU test, instead we test in a large village which increases CPU load dramatically.
Here the FX-8350 kind of delivers playable performance, depending on your standard. For a single player game I’d say it’s playable but not desirable considering we’re using a very fast GPU like the Radeon RX 6900 XT. This meant that the Ryzen 7 1800X was able to improve 1% low performance by 51%, a massive generational improvement, made possible by the fact that the FX series was a dumpster fire that AMD took 6 years to put out and even then the stench hung around for another year or so.
AMD was really away with the arrival of Zen 2, which boosted performance over the 1800X by almost 30% when matched at the same core and clock frequency, which was never the case as TSMC’s 7nm process clocked much better. By the time Zen 3 came out, AMD was offering 126% more performance than the FX-8350 when matching the core count and clock frequency.
But with 6-cores enabled we’re looking at a further 30% increase and then a 38% increase with the 5950X. So the 5950X is 213% faster than the FX-8350 when comparing the average frame rate and 250% faster when comparing the 1% low result. So yeah, it’s a bit faster.
Last up we have Watch Dogs Legion which is also CPU demanding and thus crushed the FX-8350 to the point where I’d say it wasn’t entirely playable with a 1% low of just 28 fps. The 1800X with half its cores enabled blasted ahead with 76 fps on average, an 81% performance uplift.
After that we see a massive 126% performance uplift with the 3800X and 152% with the 5800X, again with only 4 cores enabled. Jumping up from quad Zen 3 cores to 6 nets us an improvement of 18% when looking at the average frame rate, or 29% for the 1% low. The jump from 6 to 16 cores doesn’t do much in this title and we’re miles off that kind of processing power being a requirement for gaming.
Performance Summary
As expected from AMD’s dark days of the FX series, the company has made serious performance improvements with Ryzen and finally managed to overtake Intel with Zen 3, though Intel is expected to strike back with Alder Lake (12th gen Core series) shortly.
Before we go any further with this discussion, let’s take a look at the average performance seen across the 9 games tested.
On average, the FX-8350 was good for 70 fps with a 1% low of 47 fps. In comparison the Zen architecture represented by the 1800X with half the cores disabled, but a fairly substantial frequency boost, improved clock for clock performance by a whopping 60%, or 70% if we look at the 1% low results. That’s a mega generational performance improvement and although the 1800X didn’t come clocked at 4.1 GHz and only the best silicon made it to that frequency, that remains a massive architectural improvement when matched at the same clock speed.
Even if we were to wind the 1800X down to 3.6 GHz, which is a 12% frequency reduction, you’d only expect to see around a 10% drop in performance. However you slice it, 1st-gen Ryzen was a monumental upgrade for AMD.
Then from Zen to Zen+ we see another 10% boost. This time the 4.2 GHz frequency was more realistic from an out of the box product perspective. AMD managed a further 15% increase with Zen 2 and then 17% more with Zen 3. Those are solid clock for clock gains seen across Ryzen generations.
An Impressive Run
It’s crazy to see AMD’s progress over the last decade and how much catch up it had to do to finally knock at Intel’s door with 3rd-gen Ryzen. At the time Intel was plucking away with Coffee Lake which architecturally was just Skylake from 2 years prior.
Back in 2016, a year before the release of the first Ryzen processors, AMD was relying on parts like the FX-8350 to fight against Skylake; CPUs like the 4C/4T 6600K and 4C/8T 6700K, AMD struggled to keep pace even with the Core i3 dual cores of the time as most games only required an Intel 2C/4T CPU.
Roughly speaking, the i7-6700K is equivalent to the 3800X when locked at the same frequency and core count. Which means, there was a period of time that if you removed GPU limits, Intel processors offered ~100% more performance. This is why the FX-8350, which realistically was the flagship part of the series, came in cheaper than Intel’s fastest Core i5’s and at that price it was still a terrible buy.
Since then, AMD’s made serious inroads with Ryzen, boosting performance by ~50% from the 1000 series to the 5000 series when matched at the same frequency. Given Zen 3 clocks higher and has 12 and 16-core models, the true performance uplift is much greater.
In case you’re asking yourself «where are the power consumption figures?,» we prefer not to include them in these «for science» type benchmarks because they’re horribly inaccurate and no real conclusions can be drawn from them. This is because parts like the 1800X are heavily overclocked and as such were fed a serious amount of voltage to achieve stability, while the 5800X was essentially underclocked. Power measurements are best performance at stock, allowing us to make a performance per watt comparison, and you can already find that information in the day one reviews for these parts.
Granted, you can’t compare Intel’s 10% architectural gains over the past six years to AMD’s 50% uplift over the past four, because they were coming from two very different starting points and it’s taken them a very long time to get back on top.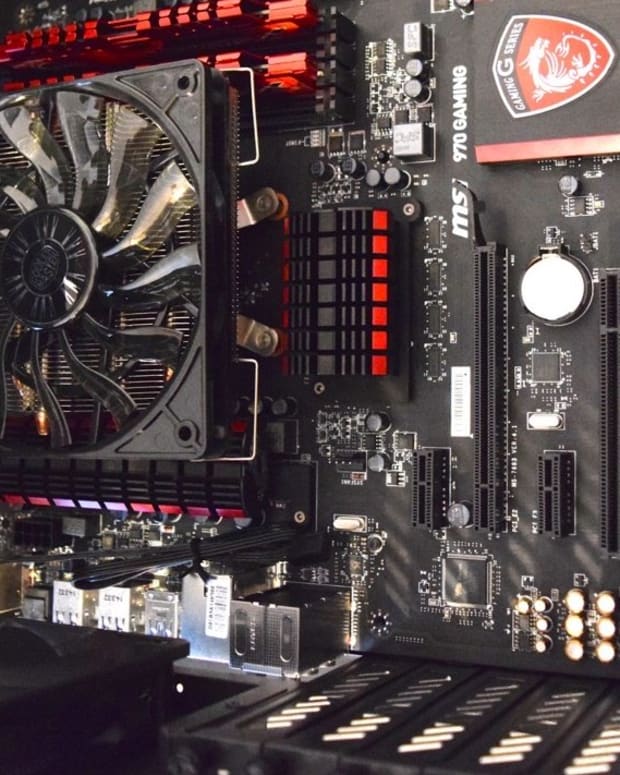
Shopping Shortcuts:
- AMD Ryzen 7 5800X on Amazon
- AMD Ryzen 5 5600X on Amazon
- AMD Ryzen 9 5900X on Amazon
- AMD Radeon RX 6900 XT on Amazon
- AMD Radeon RX 6800 XT on Amazon
- AMD Radeon RX 6600 XT on Amazon
FX-8350 [in 17 benchmarks]
AMD
FX-8350
Buy
- Interface
- Core clock speed
- Max video memory
- Memory type
- Memory clock speed
- Maximum resolution
Summary
AMD started AMD FX-8350 sales 23 October 2012. This is Vishera architecture desktop processor primarily aimed at office systems. It has 8 cores and 8 threads, and is based on 32nm SOI manufacturing technology, with a maximum frequency of 4200 MHz and a locked multiplier.
Compatibility-wise, this is AM3+ processor with a TDP of 125 Watt. It supports DDR3 memory.
It provides poor benchmark performance at
5.89%
of a leader’s which is AMD EPYC 7h22.
FX
8350
vs
EPYC
7h22
General info
FX-8350 processor market type (desktop or notebook), architecture, sales start time and pricing.
| Place in performance rating | 1130 | |
| Place by popularity | 61 | |
| Value for money | 1.36 | |
| Market segment | Desktop processor | |
| Series | AMD FX-Series (Desktop) | |
| Architecture codename | Vishera (2012−2015) | |
| Release date | 23 October 2012 (10 years ago) | |
| Current price | $240 | of 16317 (EPYC 7351) |
Value for money
To get the index we compare the characteristics of the processors and their cost, taking into account the cost of other processors.
- 0
- 50
- 100
Technical specs
Basic microprocessor parameters such as number of cores, number of threads, base frequency and turbo boost clock, lithography, cache size and multiplier lock state. These parameters can generally indicate CPU performance, but to be more precise you have to review its test results.
| Physical cores | 8 (Octa-Core) | |
| Threads | 8 | |
| Base clock speed | 4 GHz | of 4.7 (FX-9590) |
| Boost clock speed | 4.2 GHz | of 5.8 (Core i9-13900K) |
| L2 cache | 8192 KB | of 12288 (Core 2 Quad Q9550) |
| Chip lithography | 32 nm | of 5 (Apple M1) |
| Die size | 315 mm2 | |
| Maximum core temperature | 61 °C | of 110 (Atom x7-E3950) |
| Number of transistors | 1,200 million | of 57000 (Apple M1 Max) |
| 64 bit support | + | |
| Windows 11 compatibility | — | |
| Unlocked multiplier | 1 | |
| P0 Vcore voltage | Min: 1.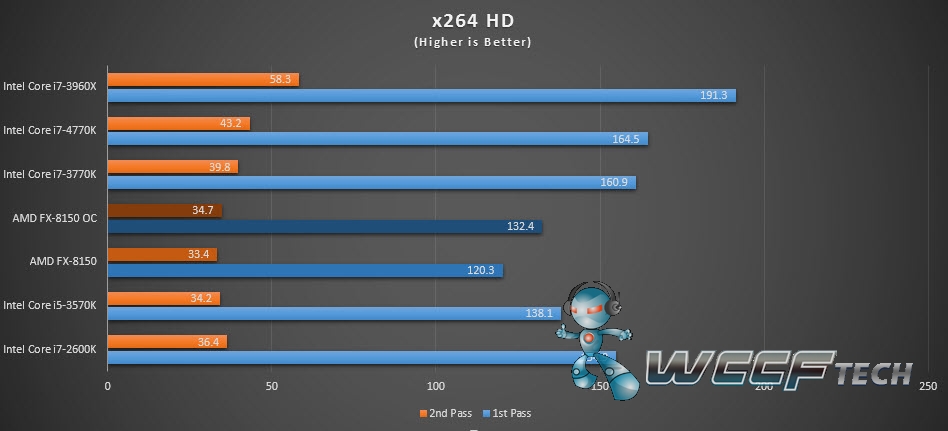 2 V — Max: 1.4 V 2 V — Max: 1.4 V |
Compatibility
Information on FX-8350 compatibility with other computer components and devices: motherboard (look for socket type), power supply unit (look for power consumption) etc. Useful when planning a future computer configuration or upgrading an existing one.
Note that power consumption of some processors can well exceed their nominal TDP, even without overclocking. Some can even double their declared thermals given that the motherboard allows to tune the CPU power parameters.
| Number of CPUs in a configuration | 1 | of 8 (Opteron 842) |
| Socket | AM3+ | |
| Thermal design power (TDP) | 125 Watt | of 400 (Xeon Platinum 9282) |
Technologies and extensions
Technological capabilities and additional instructions supported by FX-8350. You’ll probably need this information if you require some particular technology.
| Instruction set extensions | MMX, SSE, SSE2, SSE3, SSSE3, SSE4.1, SSE4.2, SSE4a, AMD64, AMD-V, AES, AVX, CLMUL, CVT16, EVP, FMA4, XOP, Turbo Core, HT3.1 | |
| AES-NI | + | |
| FMA | + | |
| AVX | + |
Virtualization technologies
Supported virtual machine optimization technologies. Some are specific to Intel only, some to AMD.
| AMD-V | + |
Memory specs
Types, maximum amount and channel number of RAM supported by FX-8350’s memory controller. Depending on the motherboard, higher memory frequency may be supported.
| Supported memory types | DDR3 | of 5200 (Ryzen 5 7600X) |
Peripherals
Specifications and connection types of supported peripherals.
| PCIe version | n/a | of 5 (Core i9-12900K) |
Benchmark performance
Single-core and multi-core benchmark results of FX-8350. Overall benchmark performance is measured in points in 0-100 range, higher is better.
Overall score
This is our combined benchmark performance rating. We are regularly improving our combining algorithms, but if you find some perceived inconsistencies, feel free to speak up in comments section, we usually fix problems quickly.
FX-8350
5.89
- Passmark
- GeekBench 5 Single-Core
- GeekBench 5 Multi-Core
- Cinebench 10 32-bit single-core
- Cinebench 10 32-bit multi-core
- 3DMark06 CPU
- Cinebench 11.5 64-bit multi-core
- Cinebench 15 64-bit multi-core
- Cinebench 15 64-bit single-core
- Cinebench 11.
 5 64-bit single-core
 - TrueCrypt AES
- WinRAR 4.0
- x264 encoding pass 2
- x264 encoding pass 1
- Geekbench 2
- 3DMark Fire Strike Physics
Passmark
Passmark CPU Mark is a widespread benchmark, consisting of 8 different types of workload, including integer and floating point math, extended instructions, compression, encryption and physics calculation. There is also one separate single-threaded scenario measuring single-core performance.
Benchmark coverage: 69%
FX-8350
5936
GeekBench 5 Single-Core
GeekBench 5 Single-Core is a cross-platform application developed in the form of CPU tests that independently recreate certain real-world tasks with which to accurately measure performance. This version uses only a single CPU core.
Benchmark coverage: 37%
FX-8350
566
GeekBench 5 Multi-Core
GeekBench 5 Multi-Core is a cross-platform application developed in the form of CPU tests that independently recreate certain real-world tasks with which to accurately measure performance. This version uses all available CPU cores.
Benchmark coverage: 37%
FX-8350
2776
Cinebench 10 32-bit single-core
Cinebench R10 is an ancient ray tracing benchmark for processors by Maxon, authors of Cinema 4D. Its single core version uses just one CPU thread to render a futuristic looking motorcycle.
Benchmark coverage: 20%
FX-8350
3201
Cinebench 10 32-bit multi-core
Cinebench Release 10 Multi Core is a variant of Cinebench R10 using all the processor threads. Possible number of threads is limited by 16 in this version.
Benchmark coverage: 20%
FX-8350
16904
3DMark06 CPU
3DMark06 is a discontinued DirectX 9 benchmark suite from Futuremark. Its CPU part contains two scenarios, one dedicated to artificial intelligence pathfinding, another to game physics using PhysX package.
Benchmark coverage: 19%
FX-8350
6648
Cinebench 11.5 64-bit multi-core
Cinebench Release 11.5 Multi Core is a variant of Cinebench R11.5 which uses all the processor threads. A maximum of 64 threads is supported in this version.
Benchmark coverage: 17%
FX-8350
7
Cinebench 15 64-bit multi-core
Cinebench Release 15 Multi Core (sometimes called Multi-Thread) is a variant of Cinebench R15 which uses all the processor threads.
Benchmark coverage: 14%
FX-8350
636
Cinebench 15 64-bit single-core
Cinebench R15 (standing for Release 15) is a benchmark made by Maxon, authors of Cinema 4D. It was superseded by later versions of Cinebench, which use more modern variants of Cinema 4D engine. The Single Core version (sometimes called Single-Thread) only uses a single processor thread to render a room full of reflective spheres and light sources.
Benchmark coverage: 14%
FX-8350
97
Cinebench 11.5 64-bit single-core
Cinebench R11.5 is an old benchmark by Maxon, authors of Cinema 4D. It was superseded by later versions of Cinebench, which use more modern variants of Cinema 4D engine. The Single Core version loads a single thread with ray tracing to render a glossy room full of crystal spheres and light sources.
Benchmark coverage: 14%
FX-8350
1.1
TrueCrypt AES
TrueCrypt is a discontinued piece of software that was widely used for on-the-fly-encryption of disk partitions, now superseded by VeraCrypt. It contains several embedded performance tests, one of them being TrueCrypt AES, which measures data encryption speed using AES algorithm. Result is encryption speed in gigabytes per second.
Benchmark coverage: 13%
FX-8350
4
WinRAR 4.0
WinRAR 4.0 is an outdated version of a popular file archiver. It contains an internal speed test, using ‘Best’ setting of RAR compression on large chunks of randomly generated data. Its results are measured in kilobytes per second.
Benchmark coverage: 12%
FX-8350
4562
x264 encoding pass 2
x264 Pass 2 is a slower variant of x264 video compression that produces a variable bit rate output file, which results in better quality since the higher bit rate is used when it is needed more. Benchmark result is still measured in frames per second.
Benchmark coverage: 12%
FX-8350
44
x264 encoding pass 1
x264 version 4.0 is a video encoding benchmark uses MPEG 4 x264 compression method to compress a sample HD (720p) video. Pass 1 is a faster variant that produces a constant bit rate output file. Its result is measured in frames per second, which means how many frames of the source video file were encoded per second.
Benchmark coverage: 12%
FX-8350
139
Geekbench 2
Benchmark coverage: 5%
FX-8350
11198
3DMark Fire Strike Physics
Benchmark coverage: 4%
FX-8350
7380
Relative perfomance
Overall FX-8350 performance compared to nearest competitors among desktop CPUs.
Intel Pentium 4 560
100.68
Intel Core i7-5700HQ
100.34
AMD FX-9370
100.34
AMD FX-8350
100
Intel Core i7-4770T
99. 66
66
Intel Pentium Gold G7400T
99.15
Intel Core i3-8300T
98.47
Intel equivalent
We believe that the nearest equivalent to FX-8350 from Intel is Core i7-5700HQ, which is nearly equal in speed and higher by 2 positions in our rating.
Core i7
5700HQ
Compare
Here are some closest Intel rivals to FX-8350:
Intel Pentium 4 660
101.87
Intel Pentium 4 560
100.68
Intel Core i7-5700HQ
100.34
AMD FX-8350
100
Intel Core i7-4770T
99. 66
66
Intel Pentium Gold G7400T
99.15
Intel Core i3-8300T
98.47
Similar processors
Here is our recommendation of several processors that are more or less close in performance to the one reviewed.
Core i7
4770T
Compare
Core i7
5700HQ
Compare
FX
9370
Compare
Core i7
3820
Compare
Core i5
6600
Compare
Phenom II
X6 1100T BE
Compare
Recommended graphics cards
These graphics cards are most commonly used with FX-8350 according to our statistics.
GeForce GTX
1050 Ti
11.4%
GeForce GTX
1060 6 GB
6.3%
GeForce GTX
1060 3 GB
4.7%
Radeon RX
570
4.3%
Radeon RX
580
4.2%
GeForce GTX
750 Ti
3.7%
GeForce GTX
1050
2.9%
GeForce GTX
1650
2. 6%
6%
GeForce GTX
970
2.6%
GeForce GTX
960
2.5%
User rating
Here is the rating given to the reviewed processor by our users. Let others know your opinion by rating it yourself.
Questions and comments
Here you can ask a question about FX-8350, agree or disagree with our judgements, or report an error or mismatch.
Please enable JavaScript to view the comments powered by Disqus.
90,000 characteristics AMD FX-8350, price, competitors, competitors
- Home
- >
- Processors
- >
- AMD
- FX-8350
FX-8350 Processor is marked by a manufacturer as: FD8350FRHKBOX.
Number of cores — 8.
The base frequency of the FX-8350 cores is 4 GHz.
Price in Russia
Want to buy cheap FX-8350? Look at the list of stores that already sell the processor in your city.
Family
- FX-8300
- FX-8320
- FX-8320E
- FX-8370
- FX-83704
AMD FX-8350
Speed in games
Production productivity in games and such productivity in the Games and similar apparatus. , according to our tests.
The performance of 4 cores, if any, and performance per core has the greatest impact on the result, since most games do not fully use more than 4 cores.
The speed of caches and working with RAM is also important.
Speed in office use
Performance in everyday work such as browsers and office applications.
The performance of 1 core has the greatest impact on the result, since most of these applications use only one, ignoring the rest.
Similarly, many professional applications such as various CAD programs ignore multi-threaded performance.
Speed in heavy applications
Performance in resource-intensive tasks loading a maximum of 8 cores.
The performance of all cores and their number has the greatest impact on the result, since most of these applications willingly use all the cores and increase the speed accordingly.
At the same time, certain periods of work can be demanding on the performance of one or two cores, for example, applying filters in the editor.
Data obtained from tests by users who tested their systems with and without overclocking. Thus, you see the average values corresponding to the processor.
Speed of numerical operations
Simple household tasks |
||
| Minimum | Average | Maximum |
| 71 | Memory: 84 | 93 9007 8 |
|
Memory 89 |
||
| 55 | 1 core: 73 | 83 |
|
1 core 35. |
||
| 98 | 2 cores: 140 | 163 |
|
2 cores 34.8 |
||
 5
5
Demanding games and tasks |
||
| Minimum | Average | Maximum |
| 188 | 4 cores: 265 | 307 |
|
4 cores 33.3 |
||
| 268 | 8 cores: 449 | 534 |
|
8 cores 29 |
Extreme |
||
| Minimum | Average | Maximum |
| 278 | All cores: 456 | 535 |
|
All cores 8. |
 4
4 Different tasks require different CPU strengths. A system with few fast cores and low memory latency will be fine for the vast majority of games, but will be inferior to a system with a lot of slow cores in a rendering scenario.
We believe that a minimum of 4/4 (4 physical cores and 4 threads) processor is suitable for a budget gaming PC. At the same time, some games can load it at 100%, slow down and freeze, and performing any tasks in the background will lead to a drop in FPS.
Ideally, the budget shopper should aim for a minimum of 4/8 and 6/6. A gamer with a big budget can choose between 6/12, 8/8 and 8/16. Processors with 10 and 12 cores can perform well in games with high frequency and fast memory, but are overkill for such tasks. Also, buying for the future is a dubious undertaking, since in a few years many slow cores may not provide sufficient gaming performance.
When choosing a processor for your work, consider how many cores your programs use. For example, photo and video editors can use 1-2 cores when working with filtering, and rendering or converting in the same editors already uses all threads.
Data obtained from tests by users who tested their systems both with overclocking (maximum value in the table) and without (minimum). A typical result is shown in the middle, the more filled in the color bar, the better the average result among all tested systems.
Benchmarks
Benchmarks were run on stock hardware, that is, without overclocking and with factory settings. Therefore, on overclocked systems, the points can noticeably differ upwards. Also, small performance changes may be due to the BIOS version.
Cinebench R23 Single Core
Intel Core i7-2760QM
607
Intel Core i5-8265U
606
Intel Core I5-2400S
601
6019
6019
6019
0019
601
Intel Core i5-2450M
582
AMD FX-8350
579
Intel Core i3-8130U
556
AMD Athlon II X4 860K
517
AMD Phenom II X4 955
488
Intel Core i5-3317U
481
Intel Core2 Quad Q9650
461
Cinebench R23 Multi Core
Intel Core i7-7820HQ
4186
Intel Core i5-10310U
4170
Intel Core i5-10210U
4013
Intel Core i5-6600K
3965
Intel Core i3-9100F
3921
AMD FX-8350
3803
Intel Core i5-6600
3741
Intel Core i7-3770
3650
Intel Core i3-8100
3618
AMD Ryzen 3 2200G
3587
Intel Core i7-8650U
3576
Cinebench R20 Single Core
Intel Core i7- 3517U
223
Intel Core i5-4200u
216
Intel Xeon E5-1650 V2
Intel Core I3-7100U
AM 110018 AMD PHENOM II X6 1100 20 20
209
Intel Xeon E5-1650 v2
209
Intel Core i3-7100U
209
AMD Phenom II X6 1100T
209
Intel Core i7-4702HQ
207
AMD FX-8370
204
Cinebench R20 Multi Core
AMD Ryzen 5 2500U
1352
Intel Core i7-4770
1349
AMD Ryzen 3 2200G
1307
Intel Core i7-8650U
1299
Intel Core i5-6500
1299
AMD FX-8350
1298
AMD Phenom II X6 1090T
1288
Intel Core i5-5675C
1283
AMD FX-8370
1281
Intel Core i7- 4720HQ
1279
Intel Core i5-4670
1245
Cinebench R15 Multi Core
Intel Core i7-4790S
671
Intel Core i7-3770
669
Intel Core i5-7600
666
Intel Core i7-4850HQ
666
AMD FX-8310
665
AMD FX-8350
665
AMD FX-8310
665
Intel Core i5-1035G7
664
Intel Core i7-6700T
663
AMD Ryzen 7 2700U
662
Intel Core i3-9100
660
Blender 2.
 81 bmw27
Intel Xeon E3-1225 v3
707.1
Intel Core i5-8250U
705.3
AMD Ryzen 3 2200G
701.4
Intel Core i7-8650U
700
Intel Core i5-4570
699
AMD FX-8350
691.3
Intel Core i7-4810MQ
683.8
Intel Core i5-4590
677.5
Intel Core i5-3570K
673.9
Intel Core i7-8550U
671.5
Intel Core i5-4670
654
Geekbench 3 Multi Core
Intel Core i5 -7300HQ
11375
Intel Core i5-4690
11339
Intel Core i5-4690K
11339
AMD FX-8370
11300
AMD FX-8310
11164
AMD FX-8350
11164
AMD FX-8310
11164
Intel Xeon E3-1220 v5
11161
Intel Core i5-7400
11124
Intel Core i7-4702MQ
11070
Intel Core i7-4702HQ
11070
Cinebench R11.
 5
5
AMD Phenom II X6 1100T
1.12
AMD Phenom II X4 980
1.12
Intel Core i5-4250U
1.12
AMD FX-8300
1.11
Intel Core i3-6100U
1.11
AMD FX-8350
1.11
AMD Phenom II X4 975
1.09
AMD Phenom II X6 1090T
1.09
Intel Core i3-4000M
1.07
AMD FX-6300
1.07
Intel Core i5-4210U
1.07
Cinebench R11.5
Intel Core i7-4800MQ
7.03
AMD FX-8370
7.02
Intel Core i7-4720HQ
7
Intel Core i7-4850HQ
6. 94
94
AMD FX-8310
6.94
AMD FX-8350
6.94
Intel Core i7-2600K
6.83
AMD FX-8300
6.77
Intel Core i3-8300
6.73
Intel Core i7-8650U
6.73
Intel Core i7-4940MX
and Tests in the games
FPS. system requirements. Please note that the official requirements of developers in games do not always match the data of real tests. Also, the result is strongly influenced by the overclocking of the system and the graphic settings in the game. We test at high settings in FullHD resolution to get numbers close to real gameplay.
The most popular config: motherboard for AMD FX-8350 — MSI 970 GAMING, graphics card — Radeon R5, RAM — Fury DDR3 1866 C10 2x8GB, SSD — 850 Evo 250GB.
Characteristics
The data is not yet filled in, so the tables may lack information or omit existing functions.
Main
| Manufacturer | AMD |
| Release dateMonth and year of the processor’s availability. | 10-2015 |
| Cores The number of physical cores. | 8 |
| ThreadsNumber of threads. The number of logical processor cores that the operating system sees. | 8 |
| Multi-Threading Technology With Intel’s Hyper-threading and AMD’s SMT technologies, one physical core is recognized as two logical cores in the operating system, thereby increasing processor performance in multi-threaded applications. | Missing |
Base frequencyGuaranteed frequency of all processor cores at maximum load. Performance in single-threaded and multi-threaded applications and games depends on it. It is important to remember that speed and frequency are not directly related. For example, a new processor at a lower frequency may be faster than an old one at a higher one. For example, a new processor at a lower frequency may be faster than an old one at a higher one. |
4GHz |
| Embedded Options Available Two enclosure versions. Standard and designed for mobile devices. In the second version, the processor can be soldered on the motherboard. | No |
Video core
RAM
PCI
Data protection
Design
Competitors
Please note that competitors are selected automatically based on performance in a particular task. Therefore, some may puzzle you. We are improving our selection algorithm, treat with understanding.
Compare
AMD FX-8350 vs Intel Core i7-1065G7
AMD FX-8350 vs Intel Core i5-4570R
AMD FX-8350 vs Intel Core i5-6600T
AMD FX-8350 vs Intel Xeon X3450
AMD FX-8350 vs Intel Pentium G3258
AMD FX-8350 vs Intel Core i7 975
Testing the AMD FX-6300 BE and FX-4300 BE processors in games
A big ship has a big voyage, and a powerful processor needs high-quality cooling to unleash the potential of all components of a gaming computer.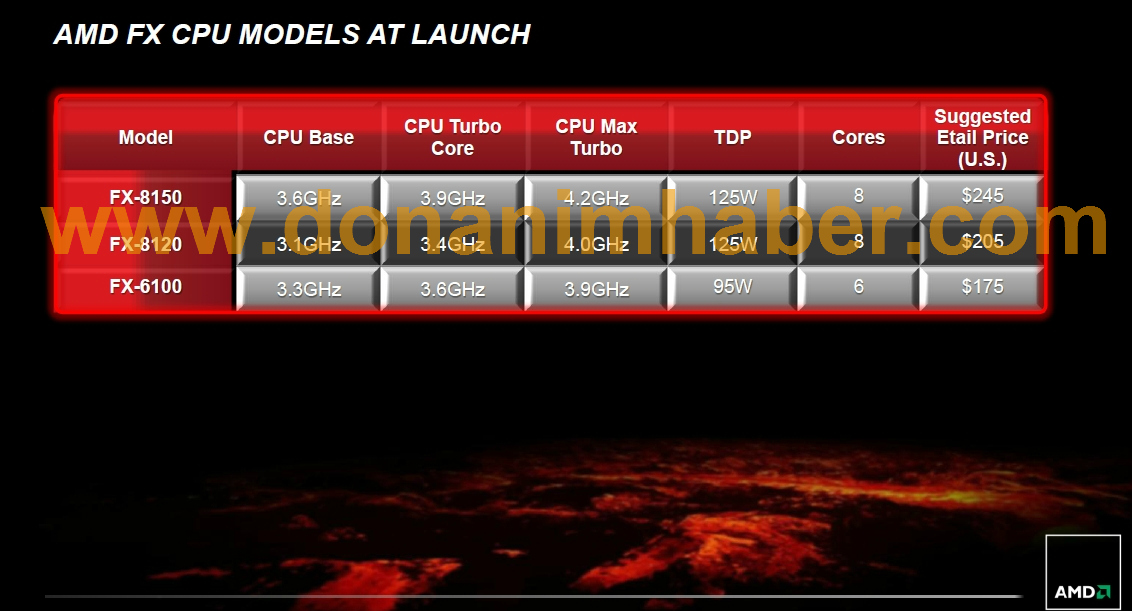 The manufacturer releases most of the processors for games, endowing them with unique features. Naturally, the price of gaming components is clearly not in the budget class. This dilemma can be solved by the AMD FX-6300 Black Edition processor, which is positioned as a gaming processor, but its price does not exceed one hundred conventional units. Another marketing ploy or a way out of a difficult situation?
Performance characteristics
The Vishera family processor, created using 32-nm technology, has six cores. When studying the characteristics of the cache of the first and second levels, doubts arise about the independence, the work of all the cores separately. So, the L1 cache in the characteristics is registered as 3×64, and L2 — 3×2048. On the manufacturer’s website, you can find that all AMD FX-6300 processors are based on the Piledriver architecture and have paired resource sharing between cores. And to put it simply, three dual-core processors are hidden in crystals. Apparently, because of this, the problem with heat dissipation. The cores placed on the AM3 socket show a power dissipation of 95 watts.
Two modifications are available on the market — the AMD FX-6300 OEM processor, that is, without a cooling system, and the boxed version. Judging by the numerous reviews of the owners, preference is given to the first option, since the native cooler hums a lot during operation, showing poor cooling results.
Feature Comparison
| AMD FX-4300 | AMD FX-6300 | |
General Information |
||
| Intel® AES New Instructions | ||
| Fused Multiply-Add 4 (FMA4) | ||
Cost is the main factor in choosing its
FX processor. However, in addition to this, many users are attracted by the unlocked multiplier, which allows you to increase the frequency of the device’s core. Overclocking the AMD FX-6300 processor can be considered an excellent prospect for the future. An increase in the nominal voltage from 1.3 to 1.55 Volts leads to an increase in the core frequency to 4.8 GHz. Naturally, the motherboard in the computer must have support for the Load-Line Calibration function, which must be enabled, because no one has canceled Ohm’s law. In addition, the frequency of 4800 MHz is far from the limit — it all depends on high-quality cooling. Having a water plant or a liquid nitrogen system available, the processor will not refuse overclocking, this is its wonderful plus.
In addition to overclocking, the user may be interested in the «Turbo» mode, which is supported by the processor at the hardware level and turns on when there is a significant drop in performance. Accelerating on its own from 3500 MHz to 4100 MHz, the system shows a slight increase, but it is often enough to correct the situation with braking.
Memory handling
| AMD FX 6300 | Intel Core i3 2100 | 32768 MB |
Processor Pros Compared to Core i5
The Intel Core i5-3470 is an acceptable competitor against which to compare the AMD FX-6300 processor. Reviews comparing these two models can often be found in the media. Perhaps these two processors were chosen not only for similar performance, but also in order to show the difference in price — the AMD representative on the market is exactly two times cheaper.
- The FX-6300 processor can work with faster memory at 1866 MHz, unlike its competitor (1600 MHz).
- Six cores versus four provide a performance boost for applications that can run separate threads on each core.
- AMD’s huge L2 cache gives a performance boost in mathematical calculations.
- Synthetic tests show high data transfer for the FX-6300 — 5.4GT / s (competitor — 5GT / s).
Benchmarks
General result
on the basis of 8 tests: Intel Core i5 3450 20%
Intel Core i5 3450
120
AMD FX 6300
100
Geekbench 3 (Multi-Core)
Its faster at 16.68%
Intel Core i5 3450
9184
AMD FX 6300
7871
Geekbench 3 (Single Core)
3450 3450
% 9001% 9001% 900,900 200019
Intel Core i5 3450
1847
AMD FX 6300
1446
AMD disadvantages when compared to Core i5
, office applications and working with large amounts of data. This result suggests that AMD FX-6300 processors are not designed for the above jobs. Low power consumption and the presence of integrated graphics add positive qualities to the processor from Intel.
Judging by the numerous user reviews, they knew what they were getting into and were ready for the loss of productivity in office applications due to their rare use. But the processor performs well in games, and an attractive price allows you to spend the saved money on the purchase of a gaming-class video card or an SSD drive that will increase the overall performance of the system.
Benchmark comparison
CPU 1: AMD FX-4300 CPU 2: AMD FX-6300
| PassMark — Single thread mark | CPU 1 |
| CPU 2 |
Dig deeper
In the post-Soviet space, it is customary to buy either an economical option, for example, an AMD FX-6300 OEM processor, or a “space rocket” from Intel Core i5 / i7, so as not to deny yourself anything. Because of what, on many popular resources, buyers are offered to choose between expensive and cheap devices. And what is interesting about Intel in the price range of the processor in question? The unremarkable Core i3-3220 processor, the cost of which is in the region of 100 conventional units, is quite suitable for comparison.
With six cores versus Intel’s two and a huge cache, the FX-6300 shows the same result in almost all games and applications. A significant gap is observed only in applications that can work with several processes at the same time.
Supported instructions
| Intel Core i5 3450 | AMD FX 6300 | ||||
| sse3 | |||||
| ssse3 | |||||
| sse4 | |||||
| sse41 | |||||
| sse4a | |||||
| sse42 | |||||
| fma3 | |||||
| fma4 | |||||
| amd64 | |||||
| amd_v | |||||
| ABM | |||||
| XOP | |||||
| TBM | |||||
| AVX | |||||
| AVX_11 | |||||
| BMI1 | |||||
| F16C | |||||
| AES | |||||
| CVT16 | |||||
| CLMUL | |||||
| Intel Core i5 3450 | AMD FX 6300 | ||||
| Frequency | 3.1 GHz | 3.5 GHC | |||
| Frequency in turbo-mode | |||||
| Number | 4 | 6 | |||
| Processor socket | LGA 1155 | AM3+ | |||
| NO | NO | NO0075 Architecture | x86-64 | x86-64 | |
| Flowers | 4 | 6 | |||
| CESH 2 levels | 1 MB/Nucleus | ||||
| level 3 levels | 6 MB | 8 MB | |||
| 1.5 MB/Nucleus | 1.33 MB 1.5 MB 1.5 MB 1.5 MB /core | ||||
| Characteristics | 6 VS 4 | ||||
| Cache 1-level | 288 KB VS 192 KB | ||||
| CASH 2nd level | 6 MB VS 4 MB | ||||
| Cache of the 3rd level 9th level level | 16.205 vs 10.042 | ||||
| CompuBench 1.5 Desktop — T-Rex (Frames/s) | 0.347 vs 0.216 | ||||
| CompuBench 1.5 Desktop — Bitcoin Mining (mHash/s) | 4.767 vs 3.548 | ||||
to go — to smart or beautiful?
Resellers in stores recommend AMD FX-6300 processors only to users who want a low-cost upgrade.