AMD Ryzen 9 5900HS Processor Benchmarks and Specs
|
|
|
|
|
AMD Ryzen 9 5900HS Processor Benchmarks and Specs
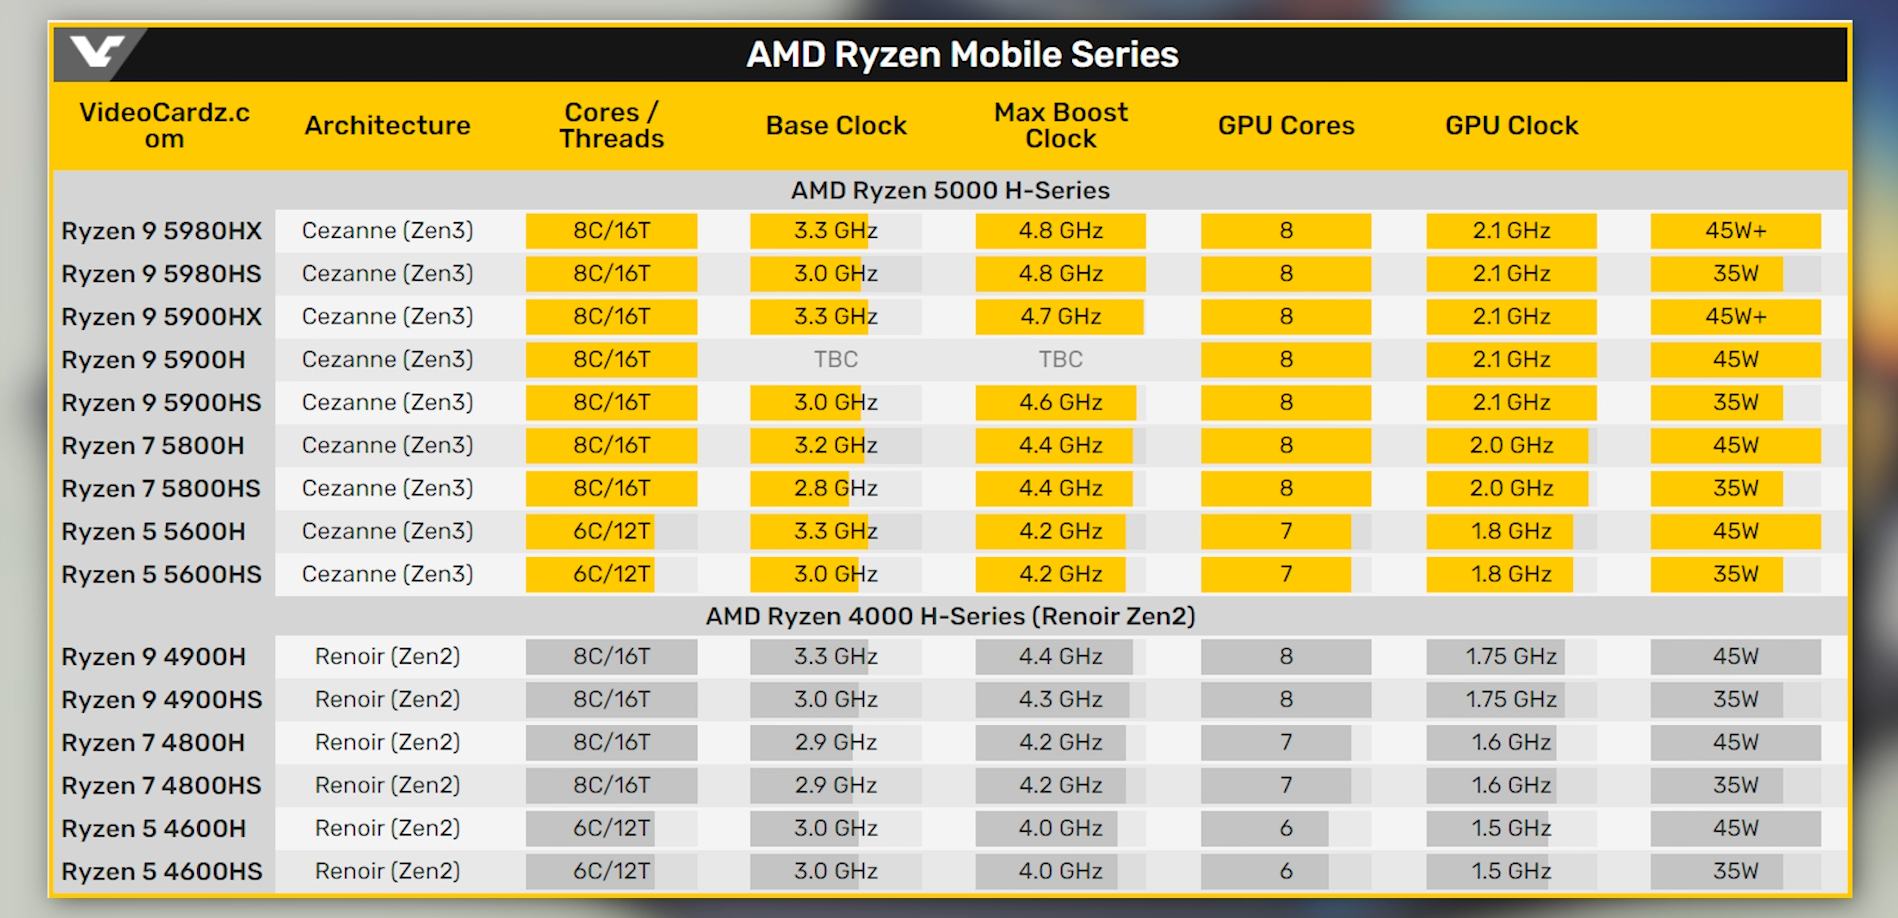
Specifications of the AMD Ryzen 9 5900HS processor dedicated to the big gaming laptop sector, it has 8 cores, 16 threads, a maximum frequency of 4,6GHz. The table below makes it possible to observe well the lithography, the number of transistors (if present), the offered cache memory, the maximum capacity of RAM memory that we can get, the type of compatible memory, the release date, the maximum number of PCIe lanes, the values obtained in the Passmark platform, Cinebench R23 and Geekbench 5.
Note: Commissions may be earned from the link above.
This page contains references to products from one or more of our advertisers. We may receive compensation when you click on links to those products. For an explanation of our advertising policy, please visit this page.
Specifications:
| Processor | AMD Ryzen 9 5900HS | |||
| Market (main) | Big gaming laptop | |||
| ISA | x86-64 (64 bit) | |||
| Microarchitecture | Zen 3 | |||
| Core name | Cezanne | |||
| Family | Ryzen 9 5000 | |||
| Part number(s), S-Spec | 100-000000300 | |||
| Release date | Q1 2021 | |||
| Lithography | 7 nm FinFET | |||
| Transistors | 10.700.000.000 | |||
| Cores | 8 | |||
| Threads | 16 | |||
| Base frequency | 3,0 GHz | |||
| Turbo frequency | 4,6 GHz | |||
| Cache memory | 16 MB | |||
| Max memory capacity | 48 GB | |||
| Memory types |
DDR4-3200, LPDDR4-4266 |
|||
| Max # of memory channels | 4 | |||
| Max memory bandwidth | 68,3 GB/s | |||
| Max PCIe lanes | 16 | |||
| TDP | 35 W | |||
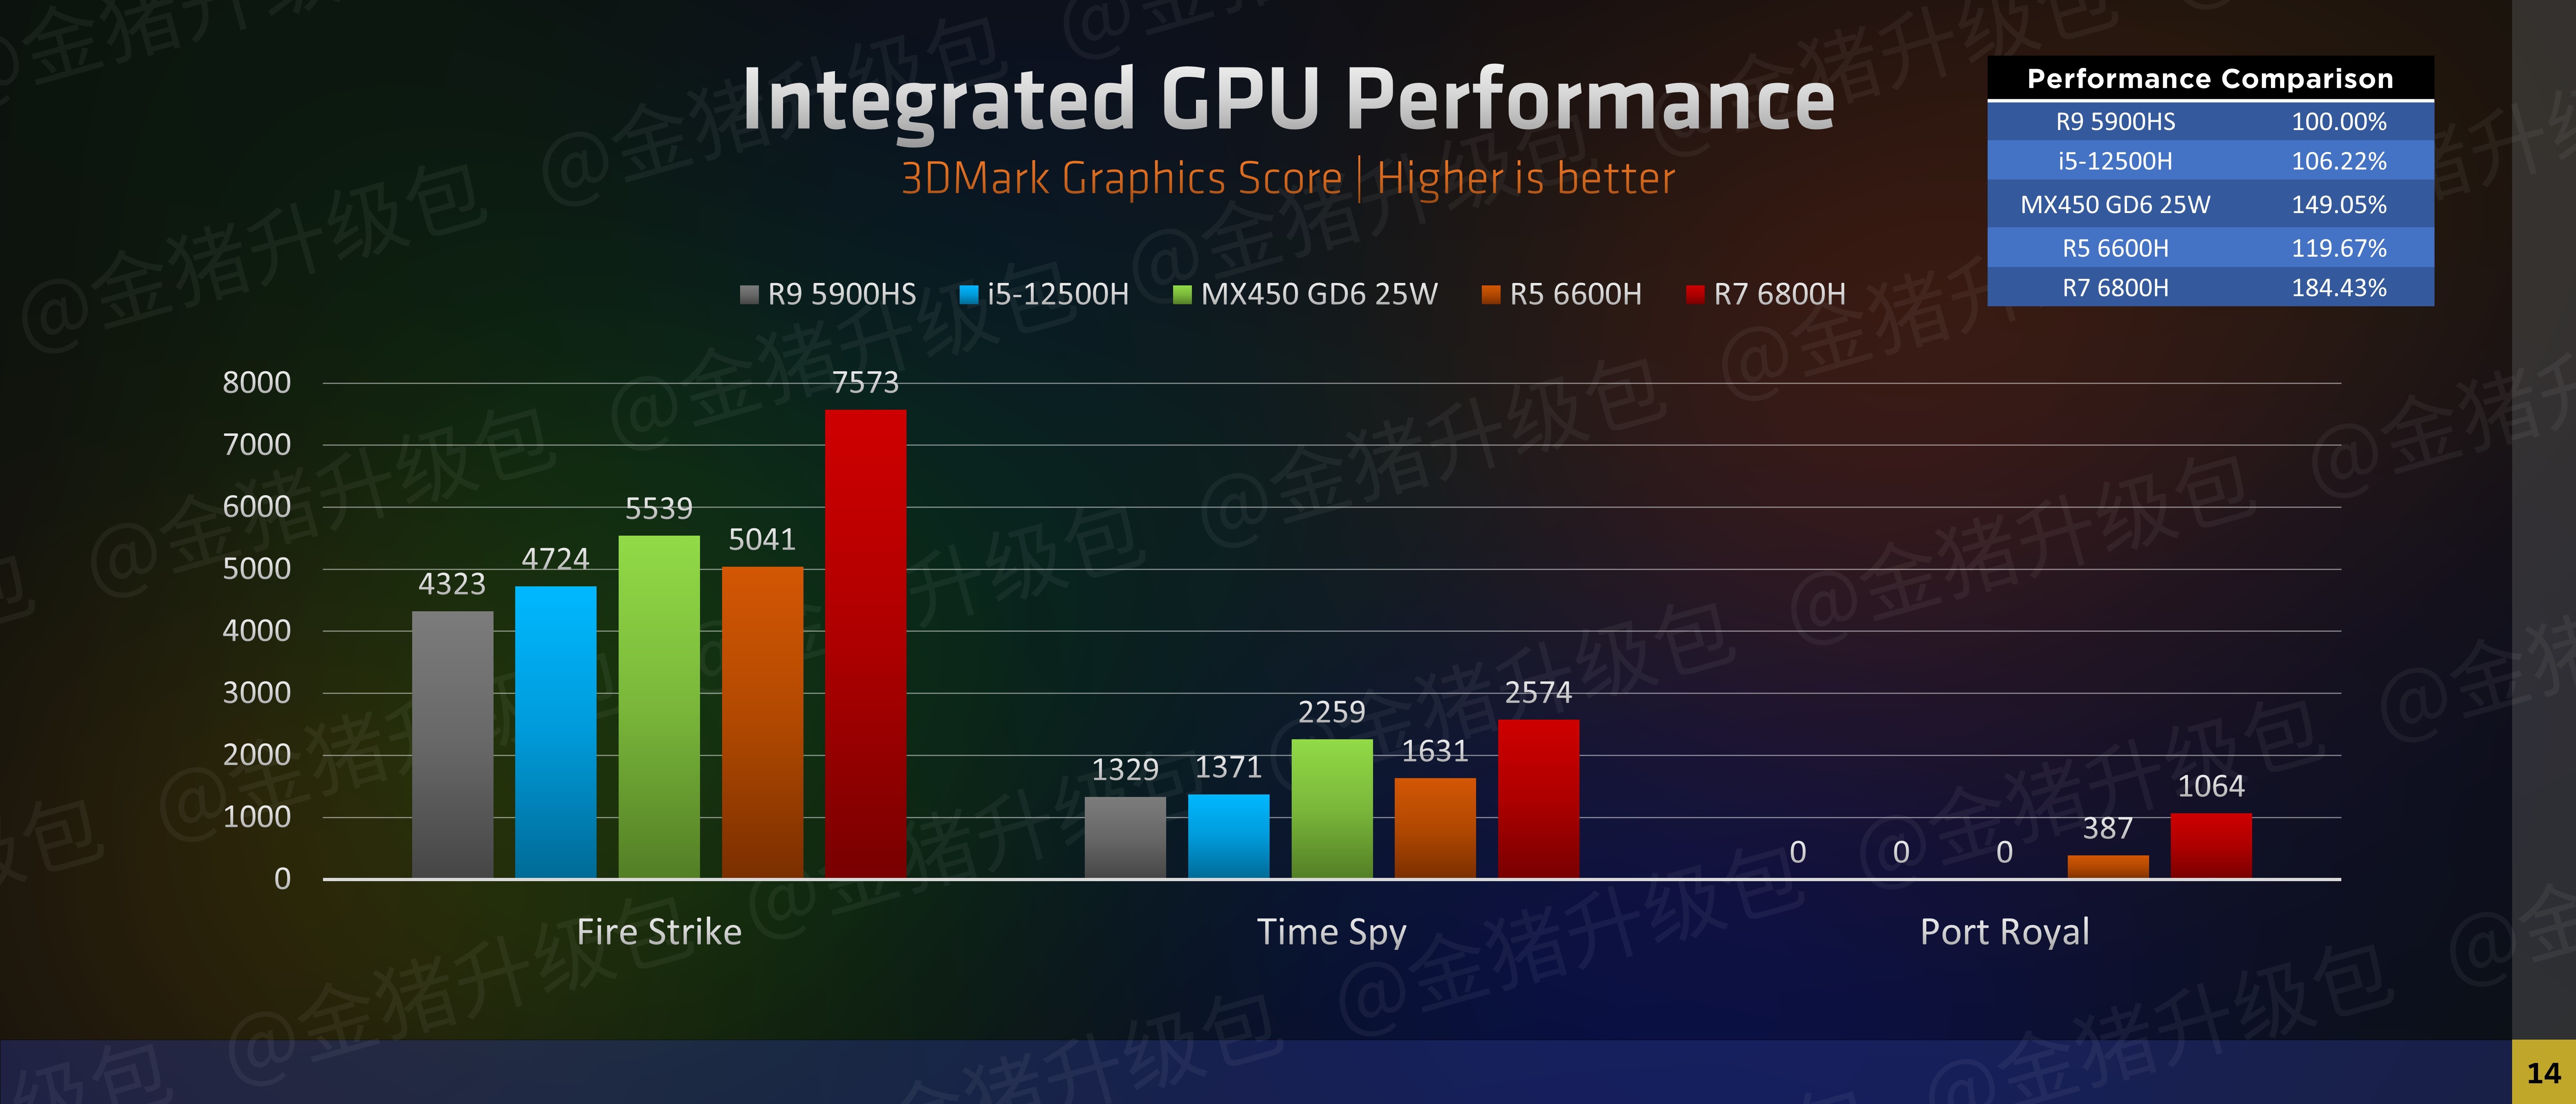
| GPU integrated graphics | AMD Radeon RX Vega 8 | |||
| GPU cores | 8 | |||
| GPU shading units | 512 | |||
| GPU base clock | 400 MHz | |||
| GPU boost clock | 2. 100 MHz 100 MHz |
|||
| GPU FP32 floating point | 1.792 GFLOPS | |||
| Socket | FP6 | |||
| Maximum temperature | 105°C | |||
| Cinebench R15 single thread | 203 | |||
| Cinebench R15 multi-thread | 2.009 | |||
| Cinebench R20 single thread | 552 | |||
| Cinebench R20 multi-thread | 4.717 | |||
| Cinebench R23 single thread | 1.465 | |||
| Cinebench R23 multi-thread | 12.344 | |||
| PassMark single thread | 3.277 | |||
| PassMark CPU Mark | 23.155 | |||
| (Windows) Geekbench 4 single core |
6. 075 075 |
|||
| (Windows) Geekbench 4 multi-core |
30.886 | |||
| (Windows) Geekbench 5 single core |
1.469 | |||
| (Windows) Geekbench 5 multi-core |
7.689 | |||
| (SGEMM) GFLOPS performance |
455,4 GFLOPS | |||
| (Multi-core / watt performance) Performance / watt ratio |
882 pts / W | |||
| Amazon | ||||
| eBay |
Note: Commissions may be earned from the links above.
Performance with the benchmarks:
Performance comparison between this processor and those of equivalent power, for this we consider the results generated on benchmark softwares such as Geekbench.
Price: For technical reasons, we cannot currently display a price less than 24 hours, or a real-time price. This is why we prefer for the moment not to show a price. You should refer to the respective online stores for the latest price, as well as availability.
Performance comparison on the Cinebench R15 benchmark platform for IT devices:
| Cinebench R15 — Multi-thread & single thread score | |
|---|---|
|
AMD Ryzen 7 5800HS |
244 2.065 |
|
Intel Core i7-12650H |
253 2.047 |
|
AMD Ryzen 7 7736U |
254 2.033 |
|
AMD Ryzen 7 5800H |
222 2.023 |
|
AMD Ryzen 9 5900HS |
203 2.  009 009 |
|
AMD Ryzen 7 6800HS |
239 2.009 |
|
Intel Core i7-11800H |
257 1.988 |
|
AMD Ryzen 7 7730U |
219 1.964 |
|
Intel Xeon W-11955M |
226 1.862 |
|
AMD Ryzen 9 4900HS |
190 1.860 |
Note: Commissions may be earned from the links above. These scores are only an
average of the performances got with these processors, you may get different results.
 The faster the rendering of the scene is created, the more powerful the PC is, with a high number of points.
Performance comparison on the Cinebench R20 benchmark platform for computers:
| Cinebench R20 — Multi-thread & single thread score | |
|---|---|
|
AMD Ryzen 9 5900HX |
559 5.056 |
|
Intel Core i9-11900H |
583 4.974 |
|
AMD Ryzen 7 5800HS |
550 4.916 |
|
Intel Core i9-11980HK |
589 4.798 |
|
AMD Ryzen 7 6800HS |
564 4.723 |
|
AMD Ryzen 9 5900HS |
552 4.717 |
|
AMD Ryzen 7 5800H |
562 4.  691 691 |
|
Intel Core i7-1280P |
634 4.669 |
|
Intel Core i9-11950H |
621 4.646 |
|
AMD Ryzen 9 5980HS |
591 4.640 |
Note: Commissions may be earned from the links above. These scores are only an
average of the performances got with these processors, you may get different results.
Performance comparison on the Cinebench R23 benchmark platform for computer processors:
| Cinebench R23 — Multi-thread & single thread score | |
|---|---|
|
AMD Ryzen 7 7736U |
1.  534 53412.787 |
|
AMD Ryzen 7 5800HS |
1.444 12.766 |
|
AMD Ryzen 9 5980HS |
1.520 12.618 |
|
Apple M1 Max |
1.511 12.398 |
|
Apple M1 Pro (10 cores) |
1.522 12.369 |
|
AMD Ryzen 9 5900HS |
1.465 12.344 |
|
Intel Core i9-11980HK |
1.577 12.259 |
|
Intel Core i7-11800H |
1.489 12.178 |
|
Intel Core i9-11950H |
1.555 12.143 |
|
AMD Ryzen 7 5800H |
1.  403 40312.056 |
Note: Commissions may be earned from the links above. These scores are only an
average of the performances got with these processors, you may get different results.
Performance comparison on the Passmark benchmark platform for computing machines:
| PassMark — CPU Mark | |
|---|---|
|
AMD Ryzen 9 5900HX |
3.297 23.991 |
|
AMD Ryzen 7 7736U |
3.  432 43223.883 |
|
Intel Core i9-12900HK |
2.981 23.848 |
|
AMD Ryzen 7 6800H |
3.262 23.766 |
|
Intel Core i9-11950H |
3.378 23.271 |
|
AMD Ryzen 9 5900HS |
3.277 23.155 |
|
AMD Ryzen 9 5980HS |
3.354 23.067 |
|
Intel Core i5-12600HX |
3.702 23.054 |
|
Intel Core i7-12800H |
3.527 23.053 |
|
AMD Ryzen 7 6800HS |
3.195 22.934 |
Note: Commissions may be earned from the links above. These scores are only an
average of the performances got with these processors, you may get different results.
On Windows: performance comparison in Geekbench 4 with Windows operating system.
| Geekbench 4 — Multi-core & single core score — Windows | |
|---|---|
|
Intel Core i5-12450H |
7.103 31.655 |
|
AMD Ryzen 7 6800U |
6.375 31.629 |
|
Intel Core i9-10880H |
5.794 31.352 |
|
Intel Core i7-1355U |
7.  922 92231.335 |
|
Intel Xeon W-10885M |
5.860 31.115 |
|
AMD Ryzen 9 5900HS |
6.075 30.886 |
|
AMD Ryzen 5 6600H |
6.191 30.406 |
|
Intel Core i9-10980HK |
5.722 30.298 |
|
Intel Core i5-1335U |
7.393 30.266 |
|
Intel Core i9-10885H |
5.794 30.064 |
Note: Commissions may be earned from the links above. These scores are only an
average of the performances got with these processors, you may get different results.
On Linux: performance comparison in Geekbench 4 with Linux operating system.
| Geekbench 4 — Multi-core & single core score — Linux | |
|---|---|
|
Intel Core i7-1260P |
7.210 35.839 |
|
Intel Core i5-12500H |
7.307 35.105 |
|
Intel Core i5-1240P |
7.159 34.128 |
|
Intel Core i7-10870H |
5.400 33.744 |
|
Intel Xeon E-2286M |
6.442 33.335 |
|
AMD Ryzen 9 5900HS |
5.933 32.807 |
|
AMD Ryzen 9 5900HX |
6.344 32.137 |
|
Intel Core i9-10980HK |
5.  769 76931.115 |
|
Intel Core i7-10875H |
5.372 30.065 |
|
AMD Ryzen 7 5800H |
6.393 29.325 |
Note: Commissions may be earned from the links above. These scores are only an
average of the performances got with these processors, you may get different results.
On Windows: performance comparison in Geekbench 5 with Windows operating system.
| Geekbench 5 — Multi-core & single core score — Windows | |
|---|---|
|
Intel Core i7-11850H |
1.  533 5337.846 |
|
AMD Ryzen 9 5980HS |
1.439 7.844 |
|
Intel Core i7-10875H |
1.340 7.809 |
|
Intel Xeon W-10885M |
1.246 7.751 |
|
Intel Xeon E-2286M |
1.264 7.699 |
|
AMD Ryzen 9 5900HS |
1.469 7.689 |
|
AMD Ryzen 7 5800H |
1.389 7.685 |
|
Intel Core i7-11850HE |
1.436 7.664 |
|
Intel Core i9-11900H |
1.546 7.663 |
|
AMD Ryzen 5 6600HS |
1.  500 5007.655 |
Note: Commissions may be earned from the links above. These scores are only an
average of the performances got with these processors, you may get different results.
On Linux: performance comparison in Geekbench 5 with Linux operating system.
| Geekbench 5 — Multi-core & single core score — Linux | |
|---|---|
|
AMD Ryzen 9 4900H |
1.220 7.741 |
|
Intel Xeon W-10885M |
1.122 7.647 |
|
Intel Core i5-13500H |
1.766 7.625 |
|
Intel Xeon W-11855M |
1.692 7.376 |
|
Intel Core i5-1335U |
1.  570 5707.369 |
|
AMD Ryzen 9 5900HS |
1.339 7.266 |
|
Intel Core i9-9980HK |
1.240 7.146 |
|
AMD Ryzen 7 5800HS |
1.497 7.128 |
|
Intel Core i9-9880H |
1.252 7.075 |
|
Intel Core i5-1235U |
1.724 7.017 |
Note: Commissions may be earned from the links above. These scores are only an
average of the performances got with these processors, you may get different results.
On macOS: performance comparison in Geekbench 5 with macOS operating system.
| Geekbench 5 — Multi-core & single core score — macOS | |
|---|---|
|
Intel Core i7-10875H |
1.  211 2117.290 |
|
Intel Core i9-10980HK |
1.120 7.108 |
|
Intel Core i7-10870H |
1.141 7.012 |
|
AMD Ryzen 7 5800H |
1.259 6.771 |
|
Intel Core i9-9880H |
1.057 6.549 |
|
AMD Ryzen 9 5900HS |
1.167 6.315 |
|
AMD Ryzen 5 5600H |
985 6.109 |
|
Intel Core i9-9980HK |
975 6.105 |
|
Intel Xeon E-2186M |
1.081 6.066 |
|
Intel Core i5-10500H |
159 6.  013 013 |
Note: Commissions may be earned from the links above. These scores are only an
average of the performances got with these processors, you may get different results.
List of comparisons:
AllwinnerAMDAMD A10AMD A12AMD A4AMD A6AMD A8AMD A9AMD AthlonAMD Athlon 64AMD Athlon 64 X2AMD Athlon GoldAMD Athlon IIAMD Athlon SilverAMD Athlon X2AMD EPYCAMD FXAMD JaguarAMD OpteronAMD PhenomAMD RyzenAMD Ryzen 1000AMD Ryzen 2000AMD Ryzen 3AMD Ryzen 3 1000AMD Ryzen 3 2000AMD Ryzen 3 3000AMD Ryzen 3 4000AMD Ryzen 3 5000AMD Ryzen 3 MobileAMD Ryzen 3000AMD Ryzen 4000AMD Ryzen 5AMD Ryzen 5 1000AMD Ryzen 5 2000AMD Ryzen 5 3000AMD Ryzen 5 4000AMD Ryzen 5 5000AMD Ryzen 5 6000 MobileAMD Ryzen 5 7000AMD Ryzen 5 MobileAMD Ryzen 5000AMD Ryzen 6000 MobileAMD Ryzen 7AMD Ryzen 7 1000AMD Ryzen 7 2000AMD Ryzen 7 3000AMD Ryzen 7 4000AMD Ryzen 7 5000AMD Ryzen 7 6000 MobileAMD Ryzen 7 7000AMD Ryzen 7 MobileAMD Ryzen 7000AMD Ryzen 9AMD Ryzen 9 3000AMD Ryzen 9 4000AMD Ryzen 9 5000AMD Ryzen 9 6000 MobileAMD Ryzen 9 7000AMD Ryzen 9 MobileAMD Ryzen MobileAMD Ryzen ThreadripperAMD Ryzen Threadripper 1000AMD Ryzen Threadripper 2000AMD Ryzen Threadripper 3000AMD Ryzen Threadripper 5000AMD Ryzen Threadripper ProAMD ZenAMD Zen 2AMD Zen 3AMD Zen+AmlogicAppleARMARM CortexARM Cortex-A15ARM Cortex-A17ARM Cortex-A35ARM Cortex-A5ARM Cortex-A53ARM Cortex-A55ARM Cortex-A57ARM Cortex-A7ARM Cortex-A72ARM Cortex-A73ARM Cortex-A75ARM Cortex-A76ARM Cortex-A77ARM Cortex-A78ARM Cortex-A8ARM Cortex-A9ARM Cortex-X1ARM920TAutoChipsBroadcomDeca coreDodeca coreDual AMDDual AMD EPYCDual AMD OpteronDual coreDual Intel XeonDual Intel Xeon E5Dual Intel Xeon PlatinumHexa coreHexadeca coreHiSiliconHiSilicon KirinIBMIBM POWERIBM POWER10IBM POWER9Icosi coreIngenicIntelIntel Alder LakeIntel Amber LakeIntel Apollo LakeIntel AtomIntel Bay TrailIntel BraswellIntel BroadwellIntel Cascade LakeIntel Cascade Lake-XIntel CeleronIntel Celeron NIntel Coffee LakeIntel Comet LakeIntel CoreIntel Core 1000Intel Core 10000Intel Core 1100Intel Core 11000Intel Core 1200Intel Core 12000Intel Core 12000 MobileIntel Core 1300Intel Core 13000Intel Core 2Intel Core 2 DuoIntel Core 2 QuadIntel Core 2000Intel Core 3000Intel Core 4000Intel Core 5000Intel Core 6000Intel Core 7000Intel Core 8000Intel Core 9000Intel Core DuoIntel Core iIntel Core i3Intel Core i3-1000Intel Core i3-10000Intel Core i3-1100Intel Core i3-11000Intel Core i3-1200Intel Core i3-12000Intel Core i3-1300Intel Core i3-13000Intel Core i3-2000Intel Core i3-3000Intel Core i3-4000Intel Core i3-5000Intel Core i3-6000Intel Core i3-7000Intel Core i3-8000Intel Core i3-9000Intel Core i5Intel Core i5-1000Intel Core i5-10000Intel Core i5-1100Intel Core i5-11000Intel Core i5-1200Intel Core i5-12000Intel Core i5-12000 MobileIntel Core i5-1300Intel Core i5-13000Intel Core i5-2000Intel Core i5-3000Intel Core i5-4000Intel Core i5-5000Intel Core i5-6000Intel Core i5-7000Intel Core i5-8000Intel Core i5-9000Intel Core i7Intel Core i7 mobile quad coreIntel Core i7 quad coreIntel Core i7-1000Intel Core i7-10000Intel Core i7-1100Intel Core i7-11000Intel Core i7-1200Intel Core i7-12000Intel Core i7-12000 MobileIntel Core i7-1300Intel Core i7-13000Intel Core i7-2000Intel Core i7-3000Intel Core i7-4000Intel Core i7-5000Intel Core i7-6000Intel Core i7-6000KIntel Core i7-7000Intel Core i7-7000KIntel Core i7-8000Intel Core i7-9000Intel Core i9Intel Core i9-10000Intel Core i9-11000Intel Core i9-12000Intel Core i9-12000 MobileIntel Core i9-12000KIntel Core i9-13000Intel Core i9-13000KIntel Core i9-7000Intel Core i9-8000Intel Core i9-9000Intel Core mIntel Core m3Intel Core m5Intel Core XIntel deca coreIntel dual coreIntel Gemini LakeIntel HaswellIntel hexa coreIntel Ice LakeIntel Ivy BridgeIntel Kaby LakeIntel LGA1150Intel LGA1151Intel LGA1200Intel LGA1700Intel LGA775Intel octa coreIntel PentiumIntel Pentium 4Intel Pentium DIntel Pentium dual coreIntel Pentium GoldIntel Pentium IIIntel Pentium IIIIntel Pentium quad coreIntel Pentium SilverIntel quad coreIntel Raptor LakeIntel Rocket LakeIntel Sandy BridgeIntel Sapphire RapidsIntel SkylakeIntel Skylake-XIntel Tiger LakeIntel XeonIntel Xeon BronzeIntel Xeon E3Intel Xeon E5Intel Xeon GoldIntel Xeon PlatinumIntel Xeon WJLQLGLG α5LG α7LG α9MarvellMediaTekMediaTek DimensityMediaTek Helio GMediaTek Helio PMediaTek PentonicMicrosoftMono coreNvidiaNvidia TegraNXPNXP i. MXNXP i.MX 8NXP i.MX 8MNXP i.MX 8XOcta coreOcta Intel XeonOctodeca coreQuad coreQuad Intel XeonQualcommQualcomm Kryo 260Qualcomm Kryo 468Qualcomm Kryo 585Qualcomm Kryo 670Qualcomm SnapdragonQualcomm Snapdragon 700Qualcomm Snapdragon 8Qualcomm Snapdragon 800 seriesRealtekRockchipSamsungSamsung ExynosSamsung Exynos 7Samsung Exynos 7 OctaSamsung Exynos 9Samsung Exynos 9 OctaSonyTessaradeca coreTexas InstrumentsUnisocUnisoc TigerXiaomiProcessors groups
List of benchmarks:
Cinebench R15Cinebench R20Cinebench R23Geekbench 4 on LinuxGeekbench 4 on WindowsGeekbench 5 on LinuxGeekbench 5 on macOSGeekbench 5 on WindowsPassMarkGFLOPS performance
Equivalence:
AMD Ryzen 9 5900HS Intel equivalent
See also:
AMD Ryzen 9 5900HAMD Ryzen 9 5900HX
Ryzen 9 5900HS [in 7 benchmarks]
Summary
AMD started Ryzen 9 5900HS sales 7 January 2021. This is a Cezanne-HS (Zen 3) architecture notebook processor primarily aimed at office systems. It has 8 cores and 16 threads, and is based on 7 nm manufacturing technology, with a maximum frequency of 4600 MHz and a locked multiplier.
Compatibility-wise, this is FP6 processor with a TDP of 35 Watt.
It provides poor benchmark performance at
17.42%
of a leader’s which is AMD EPYC 9654.
EPYC9654
Compare
General info
Ryzen 9 5900HS processor market type (desktop or notebook), architecture, sales start time and pricing.
| Place in performance ranking | 360 | |
| Market segment | Laptop | |
| Series | AMD Cezanne (Zen 3, Ryzen 5000) | |
| Architecture codename | Cezanne-HS (Zen 3) | |
| Release date | 7 January 2021 (2 years old) |
Technical specs
Basic microprocessor parameters such as number of cores, number of threads, base frequency and turbo boost clock, lithography, cache size and multiplier lock state. These parameters can generally indicate CPU performance, but to be more precise you have to review its test results.
| Physical cores | 8 (Octa-Core) | |
| Threads | 16 | |
| Base clock speed | 3 GHz | of 4.7 (Ryzen 9 7900X) |
| Boost clock speed | 4.6 GHz | of 6 (Core i9-13900KS) |
| L1 cache | 512 KB | of 7475.2 (Apple M2 Pro 10-Core) |
| L2 cache | 4 MB | of 36 (Apple M2 Max) |
| L3 cache | 16 MB | of 768 (EPYC 7773X) |
| Chip lithography | 7 nm | of 4 (Ryzen 9 7940HS) |
| 64 bit support | + | |
| Windows 11 compatibility | + |
Compatibility
Information on Ryzen 9 5900HS compatibility with other computer components and devices: motherboard (look for socket type), power supply unit (look for power consumption) etc. Useful when planning a future computer configuration or upgrading an existing one.
Note that power consumption of some processors can well exceed their nominal TDP, even without overclocking. Some can even double their declared thermals given that the motherboard allows to tune the CPU power parameters.
| Socket | FP6 | |
| Power consumption (TDP) | 35 Watt | of 400 (Xeon Platinum 9282) |
Technologies and extensions
Technological capabilities and additional instructions supported by Ryzen 9 5900HS. You’ll probably need this information if you require some particular technology.
| Instruction set extensions | XFR, FMA3, SSE 4.2, AVX2, SMT | |
| AES-NI | + | |
| AVX | + |
Virtualization technologies
Supported virtual machine optimization technologies. Some are specific to Intel only, some to AMD.
| AMD-V | + |
Graphics specifications
General parameters of a GPU integrated into Ryzen 9 5900HS.
| Integrated graphics card | AMD Radeon RX Vega 8 (Ryzen 4000/5000) |
Benchmark performance
Single-core and multi-core benchmark results of Ryzen 9 5900HS. Overall benchmark performance is measured in points in 0-100 range, higher is better.
Combined synthetic benchmark score
This is our combined benchmark performance rating. We are regularly improving our combining algorithms, but if you find some perceived inconsistencies, feel free to speak up in comments section, we usually fix problems quickly.
Ryzen 9 5900HS
17.42
Passmark
Passmark CPU Mark is a widespread benchmark, consisting of 8 different types of workload, including integer and floating point math, extended instructions, compression, encryption and physics calculation. There is also one separate single-threaded scenario measuring single-core performance.
Benchmark coverage: 68%
Ryzen 9 5900HS
21961
Cinebench 10 32-bit single-core
Cinebench R10 is an ancient ray tracing benchmark for processors by Maxon, authors of Cinema 4D. Its single core version uses just one CPU thread to render a futuristic looking motorcycle.
Benchmark coverage: 20%
Ryzen 9 5900HS
6380
Cinebench 10 32-bit multi-core
Cinebench Release 10 Multi Core is a variant of Cinebench R10 using all the processor threads. Possible number of threads is limited by 16 in this version.
Benchmark coverage: 20%
Ryzen 9 5900HS
41235
Cinebench 11.5 64-bit multi-core
Cinebench Release 11.5 Multi Core is a variant of Cinebench R11.5 which uses all the processor threads.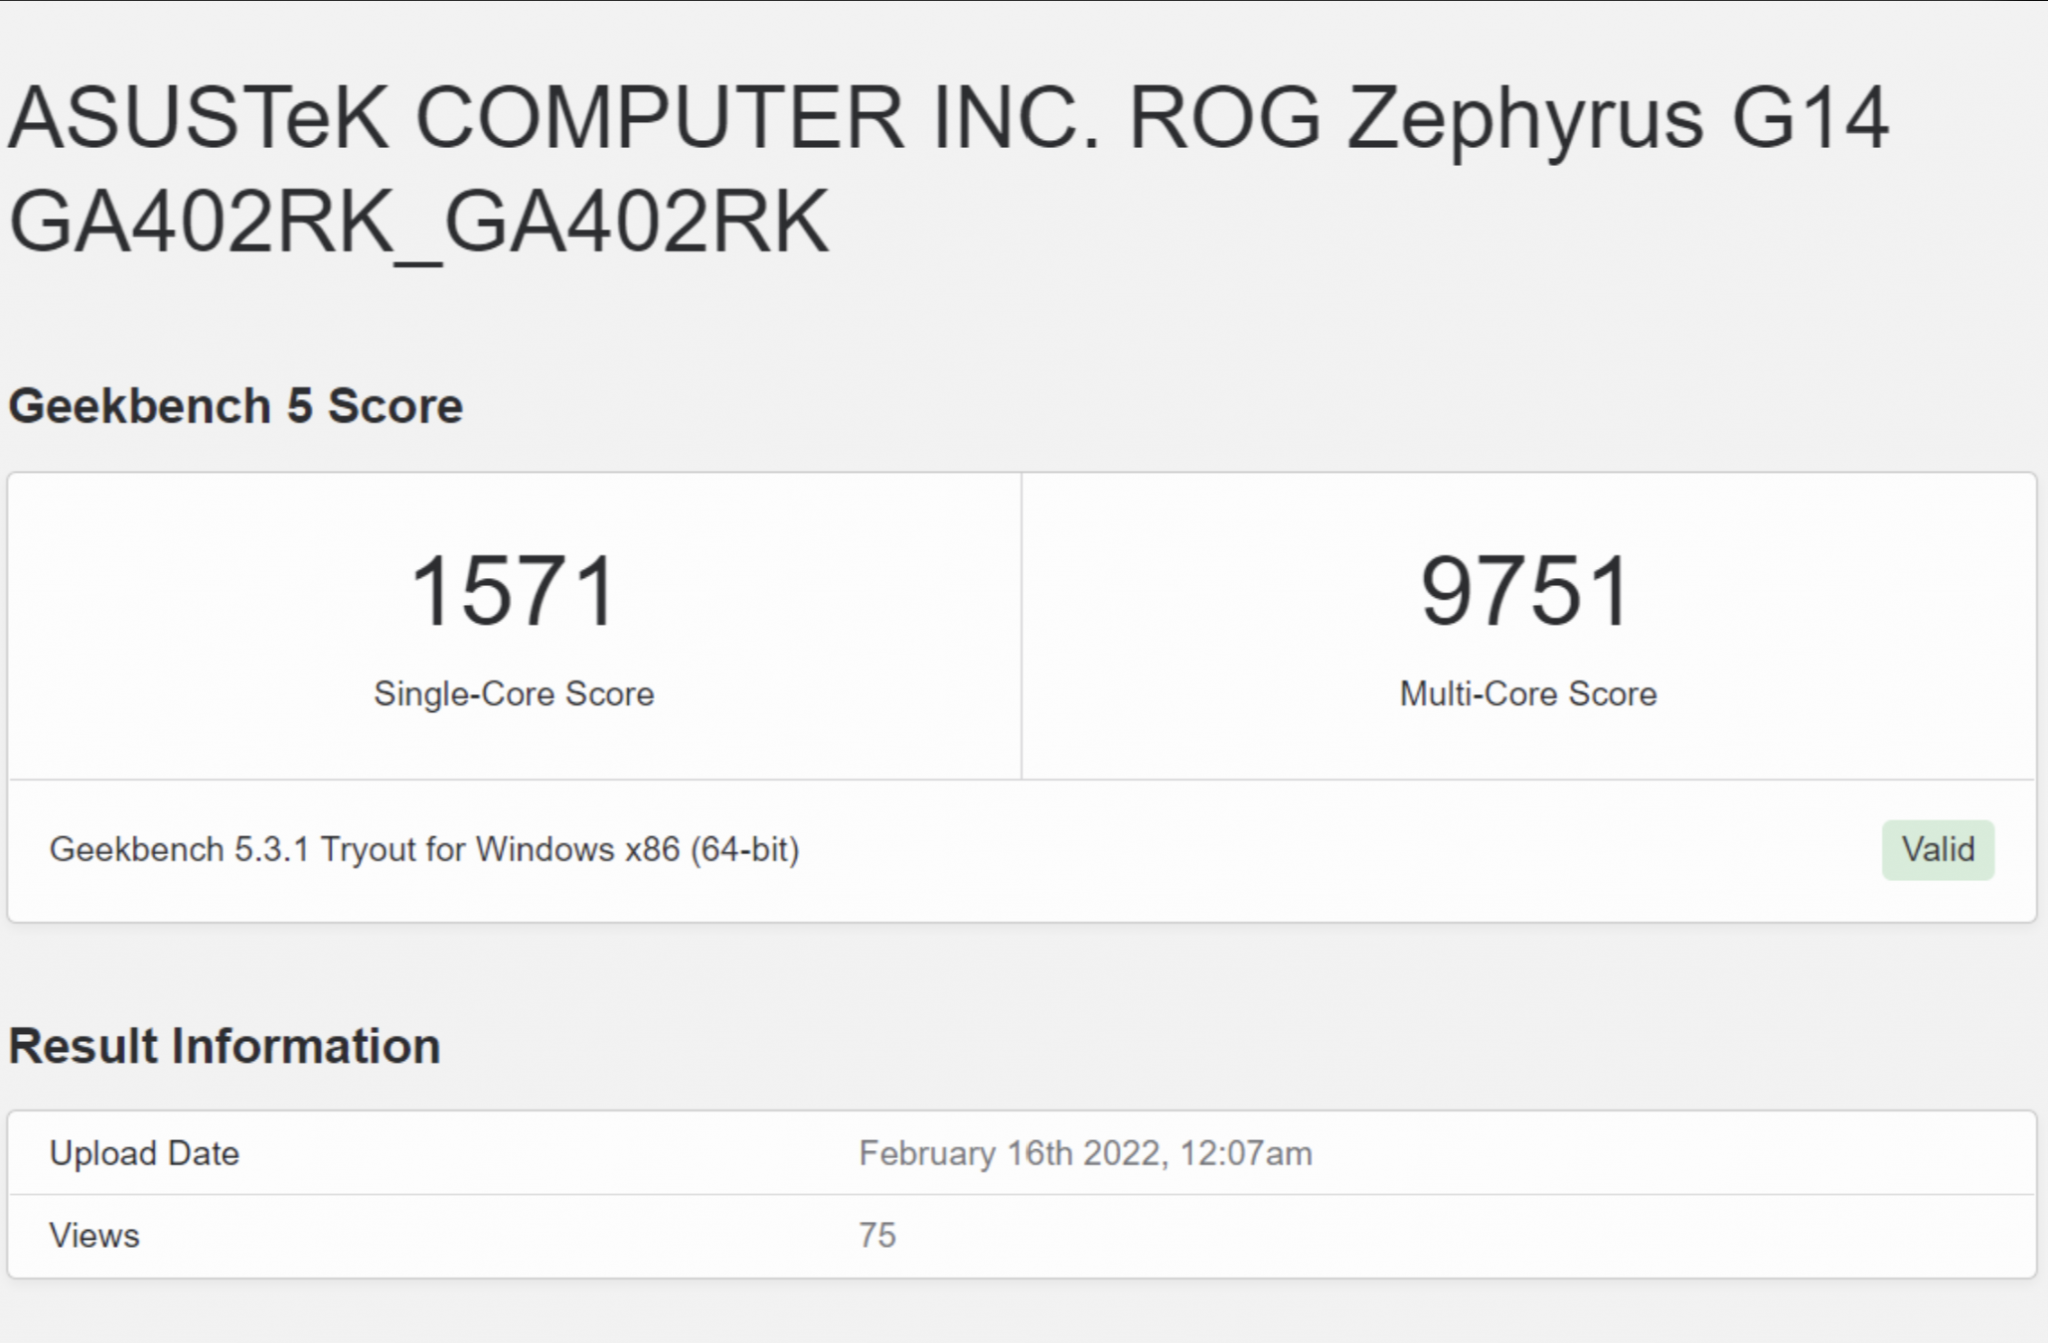 A maximum of 64 threads is supported in this version.
Benchmark coverage: 17%
Ryzen 9 5900HS
25
Cinebench 15 64-bit multi-core
Cinebench Release 15 Multi Core is a variant of Cinebench R15 which uses all the processor threads.
Benchmark coverage: 15%
Ryzen 9 5900HS
2041
Cinebench 15 64-bit single-core
Cinebench R15 (standing for Release 15) is a benchmark made by Maxon, authors of Cinema 4D. It was superseded by later versions of Cinebench, which use more modern variants of Cinema 4D engine. The Single Core version (sometimes called Single-Thread) only uses a single processor thread to render a room full of reflective spheres and light sources.
Benchmark coverage: 14%
Ryzen 9 5900HS
237
Cinebench 11.5 64-bit single-core
Cinebench R11. 5 is an old benchmark by Maxon, authors of Cinema 4D. It was superseded by later versions of Cinebench, which use more modern variants of Cinema 4D engine. The Single Core version loads a single thread with ray tracing to render a glossy room full of crystal spheres and light sources.
Benchmark coverage: 14%
Ryzen 9 5900HS
2.8
Relative perfomance
Overall Ryzen 9 5900HS performance compared to nearest competitors among notebook CPUs.
Apple M2 Max
101.61
Apple M2 Pro
101.38
AMD Ryzen 7 PRO 6850HS
100.4
AMD Ryzen 9 5900HS
100
Intel Core i5-12500H
98.39
Intel Core i9-11950H
98.28
Intel Core i5-1340P
97. 13
13
Intel equivalent
According to our data, the closest Intel alternative to Ryzen 9 5900HS is Core i5-12500H, which is slower by 2% and lower by 9 positions in our ranking.
Core i512500H
Compare
Here are some closest Intel rivals to Ryzen 9 5900HS:
Intel Core i7-11700B
104.36
Intel Core i7-1370P
103.33
Intel Core i5-1350P
102.7
AMD Ryzen 9 5900HS
100
Intel Core i5-12500H
98.39
Intel Core i9-11950H
98.28
Intel Core i5-1340P
97.13
Similar processors
Here is our recommendation of several processors that are more or less close in performance to the one reviewed.
Ryzen 7
PRO 6850HS
M2Pro
Compare
Core i512500H
Compare
M2Max
Compare
Core i911950H
Compare
Core i5
1350P
Recommended GPUs
People consider these graphics cards to be good for Ryzen 9 5900HS, according to our PC configuration statistics.
GeForce RTX
3060
21.8%
GeForce RTX
3060 Mobile
16.2%
GeForce RTX
3050 Ti Mobile
13.5%
GeForce RTX
3070 Mobile
6.1%
GeForce RTX
3080 Mobile
4. 8%
8%
GeForce RTX
3080
4%
GeForce RTX
3070
3.8%
GeForce RTX
3050 Mobile
2.1%
GeForce GTX
1650
2%
GeForce RTX
3050 Ti Max-Q
1.9%
These are the fastest graphics cards for Ryzen 9 5900HS in our user configuration statistics.
There is a total of 1187 configurations based on Ryzen 9 5900HS in our database.
GeForce RTX
4090
0.5% (6/1187)
GeForce RTX
3090 Ti
0.8% (9/1187)
GeForce RTX
3080 Ti
1. 6% (19/1187)
GeForce RTX
3090
0.7% (8/1187)
GeForce RTX
3080 12 GB
0.3% (3/1187)
GeForce RTX
3080
4% (47/1187)
GeForce RTX
3070 Ti
0.3% (4/1187)
GeForce RTX
3070
3.8% (45/1187)
GeForce RTX
2080 Ti
0.08% (1/1187)
GeForce RTX
3060 Ti
0.9% (11/1187)
User ratings: view and submit
Here is the rating given to the reviewed processor by our users. Let others know your opinion by rating it yourself.
Questions and comments
Here you can ask a question about Ryzen 9 5900HS, agree or disagree with our judgements, or report an error or mismatch.
Please enable JavaScript to view the comments powered by Disqus.
AMD Ryzen 9 5900HS Benchmarks & Specs
- Core: 8
- L3 Cache: 16MB (shared)
- TDP: 900 05 35W
- Transistor size: 7nm
Ryzen 9 5900HS is a laptop processor from AMD for socket FP6 which has 8 cores and 16 threads. Its base frequency is 3000 MHz, but support for Turbo Core technology allows you to automatically overclock to 4600 MHz. This chip has integrated Radeon RX Vega 8 graphics and a 16MB L3 cache.
Benchmark tests
AMD Ryzen 9 5900HS performance test in popular benchmarks
Cinebench R23 (single core)
1483
Cinebench R23 (multi-core)
12751
Passmark CPU (single core)
32 04
Passmark CPU (multi-core)
22175
Geekbench 5 (single-core)
1498
Geekbench 5 (multi-core)
7539
Add your Cinebench R23 results
Specifications
Detailed specifications of the Ryzen 9 5900HS processor
General information
| Manufacturer | AMD |
| Release date | January 12, 2021 |
| Type | For laptop |
| Instruction set architecture | x86-64 |
| Codename | Zen 3 (Cezanne) |
| Integrated graphics | Radeon RX Vega 8 |
Processor
| Cores | 8 |
| threads | 16 |
| Frequency | 3. 0 GHz 0 GHz |
| Max. frequency in Turbo Boost | 4.6 GHz |
| Number of cores | 8 |
| Number of threads | 16 |
| Bus frequency | 100 MHz |
| Multiplier | 30x |
| Level 1 cache | 64KB (per core) |
| Level 2 cache | 512KB (per core) |
| Level 3 cache | 16MB (shared) |
| Unlocked multiplier | No |
| Process | 7 nanometers |
| Power consumption (TDP) | 35 W |
| Socket | FP6 |
| Critical temperature | 105°C |
| Integrated graphics | Radeon RX Vega 8 |
| Boost GPU frequency | 2100 MHz |
| Shader blocks | 512 |
| TMUs | 32 |
| ROPs | 8 |
| TGP | 15W |
Memory support
| Memory type | — DDR4-3200 — LPDDR4-4266 |
Max.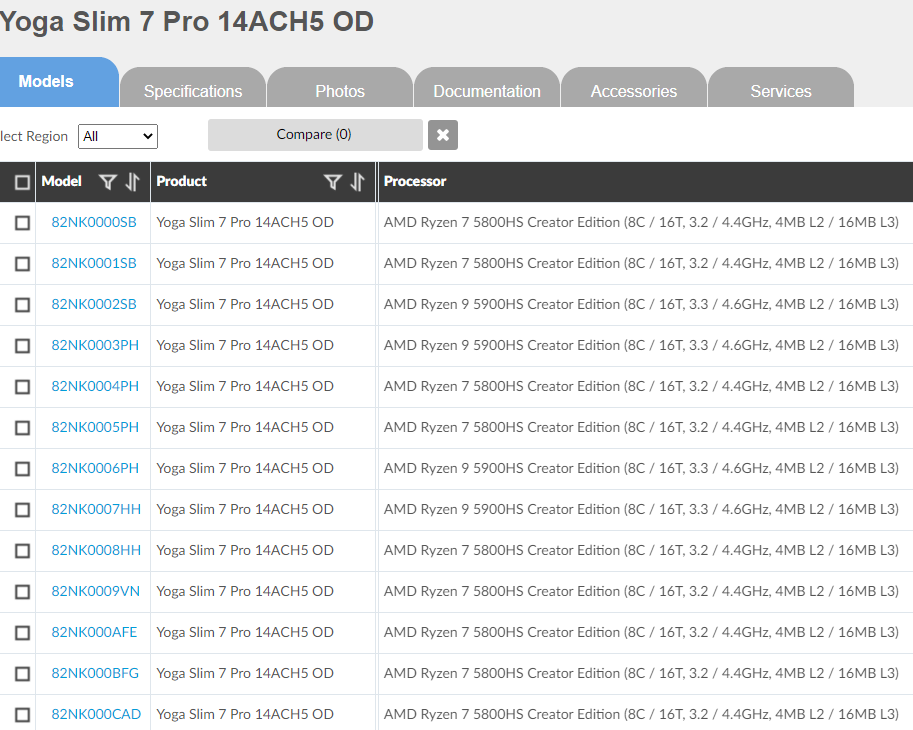 size size |
64 GB |
| Number of channels | 2 |
| ECC support | No |
Other
| Official site | AMD Ryzen 9 5900HS website |
| PCI Express Version | 3.0 |
| Max. PCI Express lanes | 12 |
Competitors
1.
AMD Ryzen 9 6900HS vs AMD Ryzen 95900HS
2.
Intel Core i7 12700H vs AMD Ryzen 9 5900HS
3.
AMD Ryzen 7 6800HS vs AMD Ryzen 9 5900HS
Compare other CPUs (540+)
Still have questions about the Ryzen 9 5900HS? Please write them in the comments below.
Name
Message
Promotion
AMD Ryzen 9 5900HS — 33 secret facts, review, specifications, reviews.
Top specifications and features
- PassMark CPU score
- Heat dissipation (TDP)
- Number of threads
- CPU base clock
- Technological process
PassMark CPU
AMD Ryzen 9 5900HS score:
23526
Best score:
104648
Test results for
AMD Ryzen 9 5900HS:
1576037
Best score:
Performance
AMD Ryzen 9 5900HS:
3807
Best score:
Memory specification
AMD Ryzen 9 5900HS:
1778
Best score:
Interfaces and Communications
AMD Ryzen 9 5900HS:
639
Best score:
Description
AMD Ryzen 9 5900HS processor runs at 3Hz. At the same time, the maximum frequency in Boost mode reaches 4.6 Hz. 8 cores available. The L1 cache is 8 KB, L2 4 MB and L3 16 MB. Power consumption at peak times can reach 35 watts.
The maximum number of threads that AMD Ryzen 9 5900HS can handle is 16.
AMD Ryzen 9 5900HS runs on 7 nm architecture.
Regarding the memory specification. The AMD Ryzen 9 5900HS processor supports DDR4. The frequency of the RAM is 4266.
If we talk about the integrated graphics of the AMD Ryzen 9 5900HS, then the AMD Radeon Graphics core is installed here. The base frequency of the graphics system is 2100 MHz. And the maximum frequency of the graphics system can reach 2.1 MHz.
Now for the AMD Ryzen 9 5900HS benchmarks. According to PassMark, the processor scored 23526 of the possible points. AMD Ryzen 9 5900HS is ranked 239th in the Top 10 in the analysis of over 4,000 processors.
Why AMD Ryzen 9 5900HS is better than others
- PassMark CPU score 23526 .
 This parameter is higher than that of 60% of goods
 - Thermal Dissipation (TDP) 35 W. This parameter is lower than 72% of
- Number of threads 16 . This parameter is higher than that of 67% of goods
- The base clock frequency of the processor is 3 GHz. This parameter is higher than that of 56% of goods
- Technological process 7 nm. This parameter is lower than that of 96% of goods
- Number of cores 8 . This parameter is higher than that of 78% of goods
products
- L1 cache size 8 KB. This parameter is lower than 75% of products
- L2 cache size 4 MB. This parameter is lower than that of 21% of goods
AMD Ryzen 9 5900HS Review
Test results
Performance
Memory specification
Interfaces and communications
Main characteristics
AMD Ryzen 9 5900HS Review Highlights
PassMark CPU score
The PassMark benchmark considers read speed, write speed, and seek time when testing SSD performance.
Show all
23526
max 104648
Average: 6033.5
104648
Benchmark test score Cinebench 10 / 32bit (Multi-Core)
41854
max 84673
Average: 1955
84673
Cinebench 10/32bit (Single-Core) test score
6476
max 24400
Average: 3557.7
24400
Test score Cinebench R11.5 /64bit (Multi-Core)
25
max 70
Mean: 5.3
70
Cinebench R15 test score (Multi-Core)
2072
max 9405
Average: 638.4
9405
Cinebench R15 test score (Single-Core)
241
max 323
Average: 128.5
323
Cinebench 11.5 benchmark score 64-bit single-core
Cinebench is a popular benchmark for evaluating CPU and graphics card performance. It is used to measure performance in 3D scene rendering and visual effects processing tasks. The results are measured in points.
Show all
3
Mean: 1.4
4
Number of threads
The more threads, the higher the performance of the processor, and it will be able to perform several tasks at the same time.
Show all
16
max 256
Average: 10.7
256
L1 cache size
Large amount of L1 memory accelerates results in CPU and system performance settings
Show all
8KB
max 6144
Average: 299.3 KB
6144KB
L2 Cache Size
L2 cache with large scratchpad memory can increase processor speed and overall system performance.
Show all
4MB
max 512
Average: 4.5 MB
512MB
L3 cache size
Large amount of L3 memory accelerates results in CPU and system performance settings
Show all
16MB
max 768
Average: 16. 3 MB
3 MB
768MB
Maximum Turbo Clock Speed
When the processor speed drops below its limit, it can jump to a higher clock speed to improve performance.
Show all
4.6GHz
max 5.7
Average: 3.2 GHz
5.7GHz
Number of cores
The number of cores in processors indicates the number of independent computing units that can execute tasks in parallel. More cores allow the processor to handle more tasks at once, which improves overall performance and the ability to handle multi-threaded applications.
Show all
8
max 72
Mean: 5.8
72
CPU base clock speed
3 GHz
max 4.7
Average: 2.5 GHz
4.7GHz
Graphics
AMD Radeon Graphics
Max. graphics system frequency
2.1GHz
max 2.1
Average: 1. 1 GHz
1 GHz
2.1GHz
DDR Version
Various DDR versions such as DDR2, DDR3, DDR4, and DDR5 offer improved features and performance over previous versions, allowing you to work more efficiently with data and improve overall system performance.
Show all
4
Mean: 3.5
5
Memory frequency
RAM can be faster to improve system performance.
Show all
4266MHz
max 4800
Average: 2106.2 MHz
4800MHz
AES-NI Commands
AES is required to speed up encryption and decryption.
Yes
AVX
AVX allows you to increase the speed of calculations in multimedia, financial and scientific applications, it also improves the performance of Linux RAID.
Show all
Yes
Instructions FMA3
FMA3 is required to speed up tasks such as adjusting photo contrast or adjusting sound.
Show all
Yes
Socket
Socket on the motherboard for installing the processor.
FP6
Process technology
The small size of the semiconductor means it is a new generation chip.
7 nm
Average: 36.8 nm
5nm
Heat Dissipation (TDP)
Heat dissipation requirement (TDP) is the maximum amount of energy that can be dissipated by the cooling system. The lower the TDP, the less power will be consumed.
Show all
35W
Average: 67.6 W
0.025W
PCI Express Edition
High-speed bus for connecting peripherals to the computer. Different versions determine the data transfer rate, and the number (x1, x4, x8, x16) indicates the number of logical lines for data transfer and determines the throughput and capabilities of the devices.
Show all
3
Mean: 2.9
5
Line
AMD Ryzen Processors
GPU base clock
The graphics processing unit (GPU) has a high clock speed.
2100MHz
max 2400
Average: 535.8 MHz
2400 MHz
Supports 64-bit system
A 64-bit system, unlike a 32-bit system, can support more than 4 GB of RAM. This increases productivity. It also allows you to run 64-bit applications.
Show all
Yes
Maximum processor temperature
If the maximum temperature at which the processor operates is exceeded, a reset may occur.
Show all
105°C
max 110
Average value: 96 °C
110°C
Code name
Cezanne H (Zen 3)
Destination
Laptop
Series
AMD Cezanne (Zen 3. Ryzen 5000)
FAQ
How fast is the AMD Ryzen 9 5900HS 5600X?
The processor runs at 3 GHz.
How many cores does the AMD Ryzen 9 5900HS have?
8 cores.
Does the AMD Ryzen 9 5900HS have integrated graphics?
AMD Radeon Graphics
What RAM does AMD Ryzen 9 5900HS support
AMD Ryzen 9 5900HS supports DDR4.