GPU Monitor is Windows 11 and Windows 10 Sidebar Gadget for easily tracking the status of your NVIDIA or/and ATI/AMD graphic card.
GPU Monitor is a handy Windows 11 and Windows 10 sidebar gadget that lets you monitor the most recent stats of your
NVIDIA or/and ATI Desktop Graphic Card. It is made especially for the overclockers and gamers. Though GPU Monitor is just a gadget,
it provides a good deal of information that you need about Graphics Processor Unit (GPU) installed on your system including Vendor
(with icon), Model, GPU, and PCB (Printed Circuit Board) Temperatures, Fan speed (% and RPM), GPU, Video Engine and Memory Controller load,
Video memory usage, GPU core, shader and GPU memory clock, PCI Express and mode (NVIDIA SLI or ATI Crossfire) if you have
more than one GPU. A comprehensive graph is provided to maximize the delivered details such as virtual memory, temperature, and
interface.
No third party software is required to display all of this data. Only the newest graphics driver must be installed.
GPU Monitor supports most NVIDIA and AMD/ATI video cards. You can also write all data provided by gadgets to log file for
easy documentation.
You can easily customize the interface by changing the color, background, and detail of the graphs, if
there are multiple GPUs, you can determine which characteristics you want to control, switching between them is done by scrolling
the mouse wheel. There are a lot of settings, and if you want to customize everything to your liking, you will have to spend some time
on it. GPU Monitor works on both 32-bit and 64-bit systems.
Version 12.9 — Added Romanian translation by Tudor Sprinceana. (Released at 07/10/2023).
Version 12.8 — Overhauled and decreased HTML. Updated Turkish translation by Burak Yavuz. (Released at 03/03/2023).
Version 12.7 — Added Croatian translation by Bruno Horvatic. (Released at 07/27/2022).
Version 12.6 — Updated Italian translation by Roberto Boriotti. (Released at 12/02/2021).
Version 12.5 — Updated French translation by LogoLargo.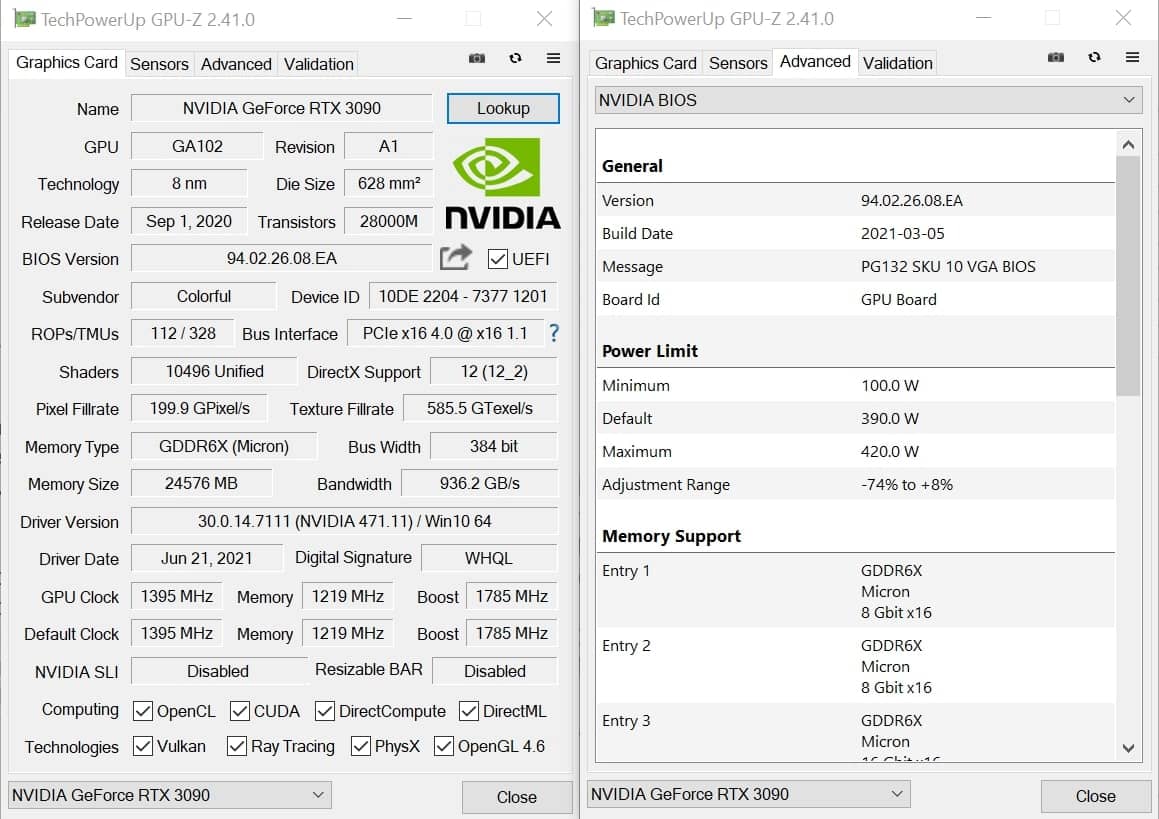 (Released at 08/18/2020).
Version 12.4 — Fixed bad grammar Dave Moebius. (Released at 04/06/2020).
Version 12.3 — Updated Chinese Traditional and Chinese Simplified translations by akjz. (Released at 03/08/2020).
Version 12.2 — Improved code. (Released at 02/24/2020).
Version 12.1 — Fixed bug with autoscale DPI under Windows 10. (Released at 08/12/2019).
Version 12.0 — For security reason ixternal link to NVIDIA Smart Scan now use SSL protocol. (Released at 06/03/2019).
Version 11.9 — Improved work with languages in settings. (Released at 03/31/2019).
Version 11.8 — Cosmetic changes in code. Update Polish translation. Improved settings usability. (Released at 09/15/2018).
Version 11.7 — Some minor optimizations and code cleanup. Update Japanese translation. Cosmetic changes. (Released at 09/06/2018).
Version 11.6 — Improved code. Minor changes. (Released at 07/13/2018).
Version 11.5 — Minor changes. (Released at 05/09/2018).
Version 11.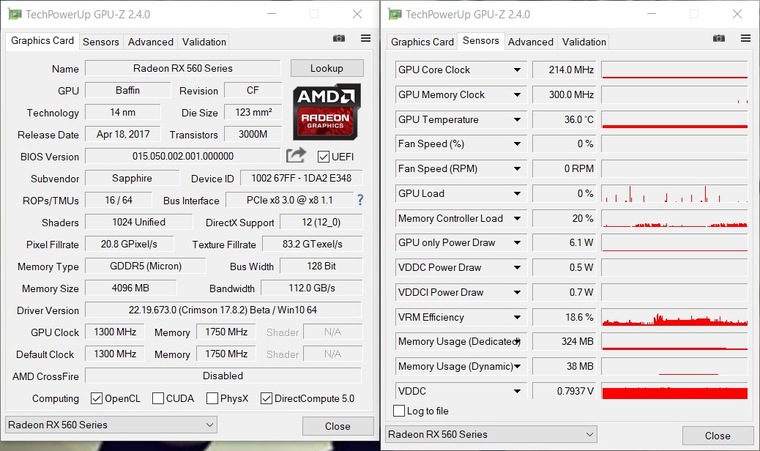 4 — Allow hide graphics adapter identification string. Few cosmetic changes. (Released at 03/28/2018).
Version 11.3 — Fix AMD crash with driver 18.2.3 and higher (special thanks to Hiten Parmar). (Released at 03/18/2018).
Version 11.2 — New wrapper library added (special thanks to Hiten Parmar). (Released at 02/24/2018).
Version 11.0 — Fixed wrong detect multi GPU with AMD 17.12.1 and higher (thanks to Hiten Parmar). Improved usability. Cosmetic
changes. (Released at 01/24/2018).
Version 10.8 — Added some information to log file. Improved code. Improved usability. (Released at 01/05/2018).
Version 10.7 — Improved code. Fixed bugs in settings. (Released at 12/01/2017).
Version 10.5 — Fixed bug with «All-in-one graph type».
Version 10.4 — Overhauled HTML. Fixed bug. Added Dutch translation by Marcel Keiman (The Rambler).
Version 10.3 — Fixed bug.
Version 10.2 — Improved code. Improved settings usability. Fixed bugs.
Version 10.1 — Minor improvements.
Version 10.0 — Added German translation by Jörg Bornwasser.
Version 9.9 — Support Crimson drivers for AMD videocards.
Version 9.8 — Improved HTML-code. Change any default colors.
Version 9.7 — Fixed Belorussian translation by Kanstantsin Melnikau.
Version 9.6 — Added Belorussian translation by Kanstantsin Melnikau.
Version 9.5 — Improved code.
Version 9.4 — Minor improvements.
Version 9.3 — Improved code. Change update notifier algorithm.
Version 9.2 — Allow user select custom sound.
Version 9.1 — Added Japanese translation by Kosuke Kaizuka.
Version 9.0 — Improved code. Hover mouse to fan section to see fan speed in percents.
Version 8.9 — Allow change graphs height from 20 to 99px.
Version 8.8 — Fixed problem with main timer.
Version 8.7 — Press NVIDIA icon for smart scan your system — Automatically Detect NVIDIA Products.
Version 8.6 — «Show GPU1…GPUn instead of the video card name» option added (#2 settings tab).
Version 8.5 — Fixed wrong output long videocard name. Improved main timer algorithm.
Version 8.4 — Improved code.
Version 8.3 — Improved code.
Version 8.2 — Added Czech translation by Jiří Škorpil.
Version 8.1 — Fixed Polish translation by Andrzej Mazurkiewicz.
Version 8.0 — Added Polish translation by Andrzej Mazurkiewicz.
Version 7.9 — Added Hindi translation by Raunak Dutta. Improved work with multi GPU systems.
Version 7.8 — Improved work with multi GPU systems.
Version 7.6 — Added Slovak translation by Ivan Očadlík.
Version 7.5 — Added Italian translation by Carlo Adami.
Version 7.4 — Added Indonesian translation by elda taluta.
Version 7.3 — Improved code.
Version 7.2 — Fixed Brazilian Portuguese translation by Rafael “R4to0” Maciel Alves.
Version 7.1 — Fixed determining CrossFire.
Version 7.0 — Added support newest videocards. Added many settings for multi GPU systems. Added French translation by
Pascal Legendre. Added Autoscale DPI option (#1 settings tab). Added Catalonian translation by Jordi Bartrina.
Version 6.4 — Added Brazilian Portuguese translation by Rafael “R4to0” Maciel Alves.
Version 6.3 — Added Macedonian translation by Vasil F. Bachovski.
Version 6.2 — Added Spanish translation by Diego Manuel Vazquez.
Version 6.1 — Added Turkish translation by Celal Osmanbas.
Version 6.0 — Added Ukrainian and Russian languages. Added Chinese Traditional and Chinese Simplified translations by Ellis Chang.
Version 5.7 — Change “Restore factory default settings” function behavior.
Version 5.6 — Different ini files for different GPU added. Added “Restore factory default settings” button.
Version 5.4 — Added custom refresh rate (1-999 sec).
Version 5.3 — Fixed bug with with NVIDIA Optimus technology.
Version 5.2 — Fixed bug with fill graph type.
Version 5.1 — Added update notifier.
Version 5.0 — Added view MAX GPU & PCB temperatures.
Version 4.9 — Improved code.
Version 4.8 — Fixed bug.
Version 4.7 — Fixed bug.
Version 4.6 — Added “All-in-one graph type” option.
Version 4.5 — Added change graph line width and hide gridlines on a graph.
Version 4.4 — Allow hide “PCB temp” only.
Version 4.3 — Allow hide “Title” and “Copyright”.
Version 4.2 — Added logging.
Version 4.1 — Allow temperatures graphs scaling.
Version 4.0 — Added color changeable for all gadget’s elements.
Version 3.5 — Many settings added.
Version 3.4 — Change size adjustable method.
Version 3.3 — Plays sound when overheat. Save settings to file. (File will be created — Path: %APPDATA%
File: gadgetname_Settings.ini).
Version 3.2 — Fixed bugs.
Version 3.0 — Added size adjustable.
Version 2.0 — Check for update button added.
Version 1.0 — Initial release.
GPU-Z VS Intel® Power Gadget
Software Alternatives & Reviews
Register
|
Login
GPU-Z
-
CPU-Z
-
Speccy
-
HWINFO
-
AIDA64
-
Open Hardware Monitor
-
Hardinfo
-
HWMonitor
GPU-Z is a lightweight system utility designed to provide vital information about your video card. ..
..
Intel® Power Gadget
-
AMD Overdrive Utility
-
HWMonitor
-
iStat Menus
-
Open Hardware Monitor
-
HWINFO
-
App Tamer
-
CheckMyMac
Intel® Power Gadget is a software-based power estimation tool enabled for 2nd Generation Intel® Core™ processors or newer. It provides real-time processor package power information in watts using energy counters.
GPU-Z Landing PageIntel® Power Gadget Landing Page
GPU-Z details
| Categories |
Device Management |
|---|---|
| Website |
techpowerup. com com |
Suggest changes
Intel® Power Gadget details
| Categories |
Device Management |
|---|---|
| Website |
software.intel.com |
Suggest changes
GPU-Z videos
+ Add
GTX 1060 3gb HASRATE / GPU-Z REVIEW and OC SETTINGS!!!!! ETH mining
More videos:
-
Review
—
MSI RTX 2070 GPU-Z Review | All Data Showed in GPU-z rtx 2070 MSI ARMOR
Intel® Power Gadget videos
No Intel® Power Gadget videos yet. You could help us improve this page by suggesting one.
+ Add video
Category Popularity
0-100% (relative to GPU-Z and Intel® Power Gadget)
GPU-Z
Intel® Power Gadget
Monitoring Tools
87
87%
Monitoring Tools
13%
13
Device Management
83
83%
Device Management
17%
17
System Information
88
88%
System Information
12%
12
Log Management
90
90%
Log Management
10%
10
User comments
Share your experience with using GPU-Z and Intel® Power Gadget.
For example, how are they different and which one is better?
Reviews
These are some of the external sources and on-site user reviews we’ve used to compare GPU-Z and Intel® Power Gadget
GPU-Z Reviews
Top 8 BEST NZXT CAM ALTERNATIVES
GPU-Z, like Nzxt CAM, is free to download and use. Apart from GPU statistics, the software will also provide information on transistors, bus interface, and memory size. GPU-Z can also be used to check the sensors and their performance.
Source:
gisuser.com
10 Best Nzxt CAM Alternatives
With this, setting up GPU-Z is much easier than setting up Nzxt CAM. However, there are not as many customization options on GPU-Z as there are on Nzxt CAM.
Source:
conbackpackers.com
Intel® Power Gadget Reviews
We have no reviews of Intel® Power Gadget yet.
Be the first one to post
Social recommendations and mentions
Based on our record, GPU-Z
seems to be more popular.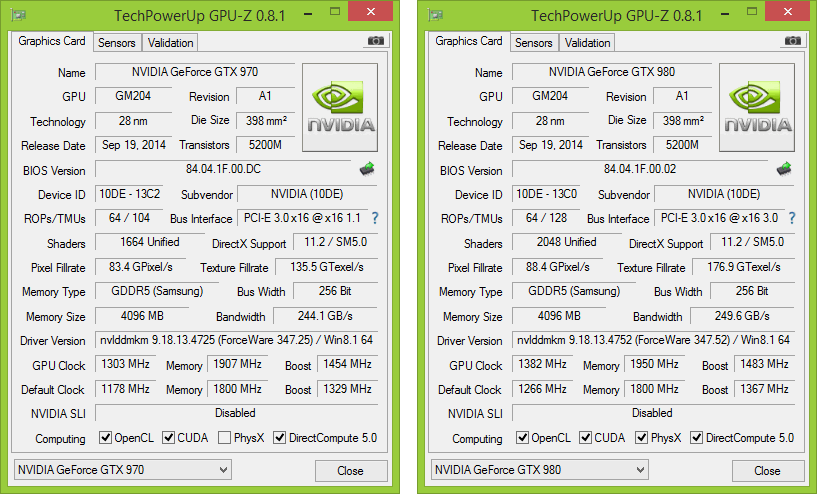 It has been mentiond
1 time
since March 2021.
We are tracking product recommendations and mentions on various public social media platforms and blogs.
They can help you identify which product is more popular and what people think of it.
GPU-Z mentions (1)
-
Complete underperforming in 3DMark TimeSpy and in general
That does seem low for that card. Try running GPU-Z and see what the Bus Interface says? Or post the screenshot of details?
Source:
7 months ago
Intel® Power Gadget mentions (0)
We have not tracked any mentions of Intel® Power Gadget yet.
Tracking of Intel® Power Gadget recommendations started around
Mar 2021.
What are some alternatives?
When comparing GPU-Z and Intel® Power Gadget, you can also consider the following products
CPU-Z
— CPU-Z is a freeware that gathers information on some of the main devices of your system :
Processor name and number, codename, process, package, cache levels.
AMD Overdrive Utility
— Personalize your experience with state-of-the-art real-time overclocking*.
Speccy
— Speccy — find the details of your computer’s specs. Great for spotting issues or finding compatible upgrades. Download the latest version free.
HWMonitor
— HWMonitor is a hardware monitoring program that reads PC systems main health sensors : voltages, temperatures, fans speed.
HWINFO
— Professional System Information and Diagnostics. Comprehensive Hardware Analysis, Monitoring and Reporting for Windows and DOS. FREEWARE. download. Advertisements.
iStat Menus
— «An advanced Mac system monitor for your menubar.»
GPU-Z vs CPU-Z
GPU-Z vs AMD Overdrive Utility
GPU-Z vs Speccy
GPU-Z vs HWMonitor
GPU-Z vs HWINFO
GPU-Z vs iStat Menus
Intel® Power Gadget vs CPU-Z
Intel® Power Gadget vs AMD Overdrive Utility
Intel® Power Gadget vs Speccy
Intel® Power Gadget vs HWMonitor
Intel® Power Gadget vs HWINFO
Intel® Power Gadget vs iStat Menus
Do not miss the top trending startups with our weekly report!
How to check video card temperature in Windows 7/10 — best monitoring software
Contents:
- 1 Best video card temperature viewer
- 1.
 1 Speccy
 - 1.2 GPU Temp
- 1.3 GPU-Z 9 0008
- 1.4 Open Hardware Monitor
- 1.5 AIDA64
- 1.
- 2 Gadgets for displaying the temperature of the video card temperature of the video card without load and in games
Modern video cards not only convert the graphic image contained in the computer’s memory into an image displayed on the display, but also perform additional processing, thereby removing part of the load from the central processor. In this case, the temperature of the video card rises significantly. That is, the heating of the graphics adapter is a completely natural phenomenon, but there is a temperature threshold, overcoming which dramatically increases the risk of device failure. That is why each user must know what the normal temperature of the video chip should be and how to measure it.
The best programs for viewing the temperature of the video card
Almost all PCs are equipped with built-in sensors that allow you to record the temperature of hardware components.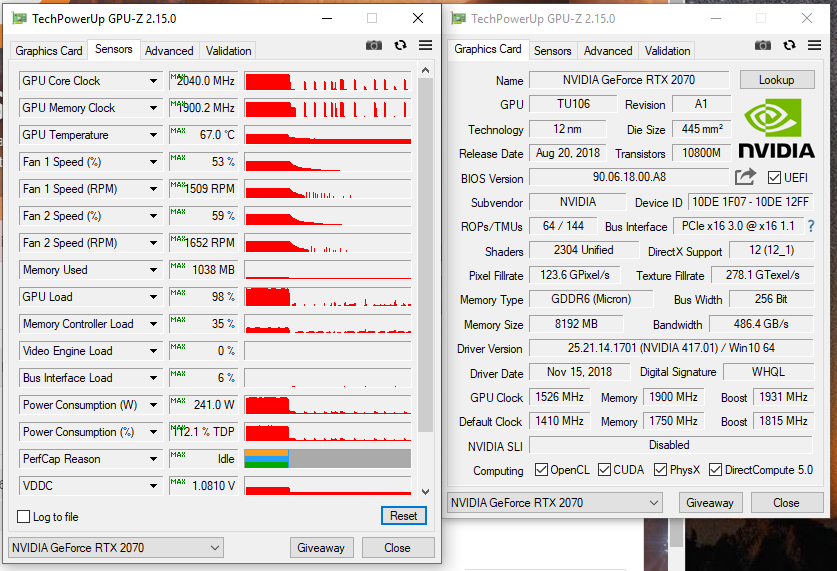 You can access their data using the usual command line and the PowerShell console, but it is much more convenient to use third-party utilities for this purpose that display data in the usual format — degrees Celsius. Let’s see how to measure the temperature of a video card using the five most popular software tools.
Speccy
A small free utility from the developers of the famous CCleaner cleaner. The program displays basic information about the operating system and hardware components, including the video adapter. All you need to do is just launch the application, switch to the «Graphics devices» section, find your video card among them and see its temperature. Also, with the help of this program, you can determine the degree of heating of the central processor, motherboard and hard drive.
GPU Temp
You can find out the temperature of a video card in Windows 7/10 using the GPU Temp utility. All that this little free program can do is show the temperature and load of the graphics adapter core.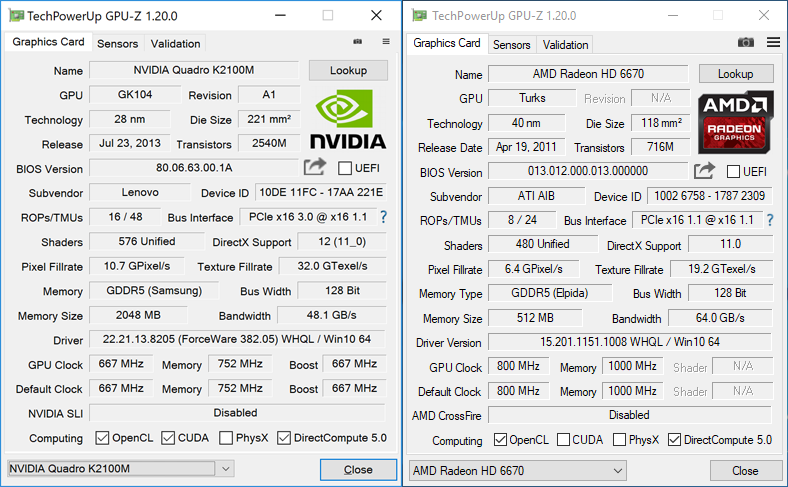 Data can be displayed in the utility window or system tray in real time. Additionally, the program supports choosing the color of temperature values and adding them to Windows startup.
GPU-Z
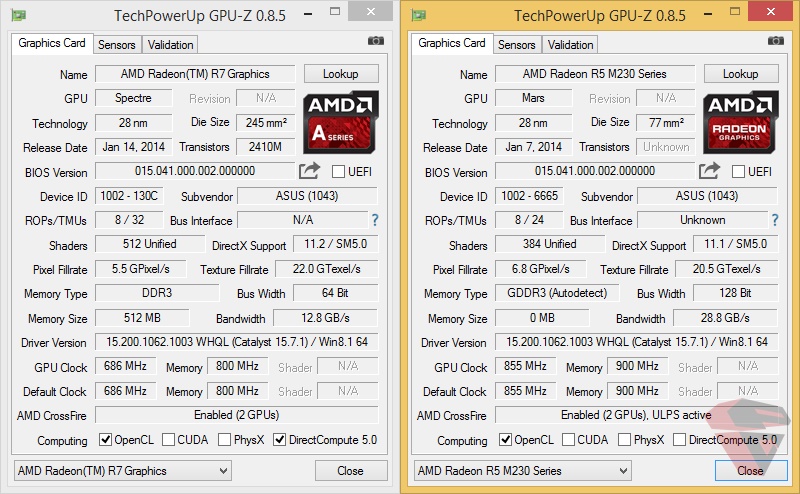
Another free utility designed to get information about the graphics adapter. Supports NVIDIA and ATI cards. With it, you can view the temperature of the video card in Windows 7/10, as well as extract other information — the adapter model, connection interface, video memory characteristics, various identifiers and other useful information. If you are interested in the temperature, you can see it on the «Sensors» tab in the «GPU Temperature» field.
Open Hardware Monitor
Free and open source program that provides basic information about the main hardware components — processor and video card. The tool shows CPU load, clock speed, amount of graphics memory used by the video adapter, fan speed, temperature of CPU cores and video card. The utility displays all data in one window.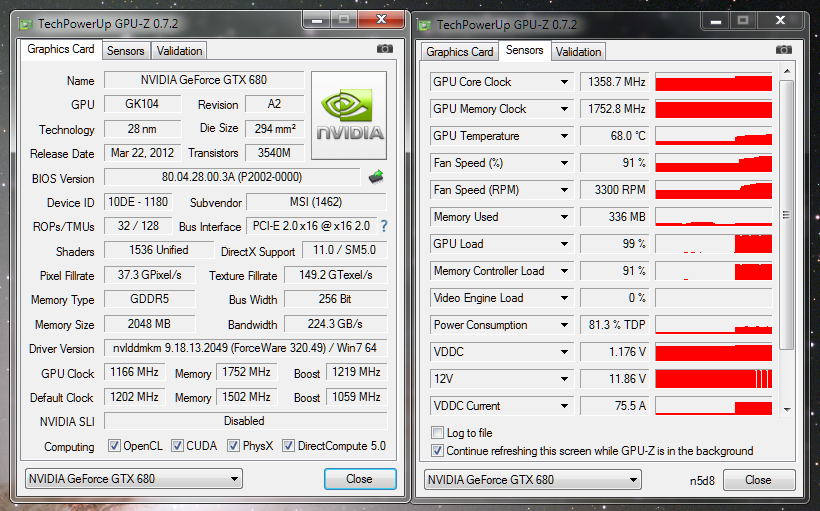
AIDA64
Now we will tell you how to check the temperature of the video card in the most advanced program to get information about the characteristics of the hardware and the AIDA64 operating system. After launching the program, select the «Sensors» option in the left panel, and then find the «Graphics Adapter» or «PCH Diode» item on the right. Most often, it is precisely this unusual name that a graphic card bears in AIDA64.
An important advantage of this powerful application is the ability to control the speed of coolers, and, therefore, the temperature of key devices, but, unlike previous programs, AIDA64 is paid.
Gadgets for displaying the temperature of the video card
An alternative to the tools proposed above can be the so-called desktop gadgets — small software modules that broadcast information directly to the desktop.
GPU Meter
Free widget for displaying video card temperature on the desktop. Allows you to track other metrics such as frequency and memory consumption.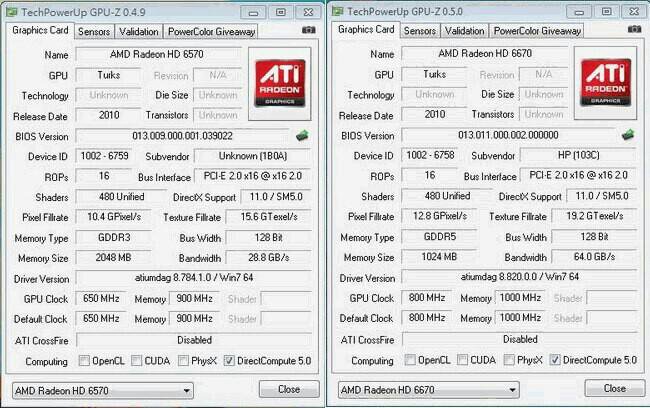 For the widget to work correctly, you need to download and run the PC Meter portable control utility as an administrator.
If you want to know the temperature of the video card on a PC running Windows 8 and 10 using GPU Meter, you will have to additionally install the 8GadgetPack program. However, you do not have to install the GPU Meter separately, since this gadget is included in the 8GadgetPack program by default.
NVIDIA GPU Temp
Owners of computers with NVIDIA graphics cards can use the NVIDIA GPU Temp gadget. Since it was developed under Windows 7, you will need to install 8GadgetPack to make it work in newer versions of the system. In addition to the temperature of the graphics adapter, the NVIDIA GPU Temp widget also shows its model. Also in the settings you can turn on the display of the bus width and change the color scheme. Unfortunately, the gadget does not work correctly with new models of video cards from NVIDIA, for example, Quadro.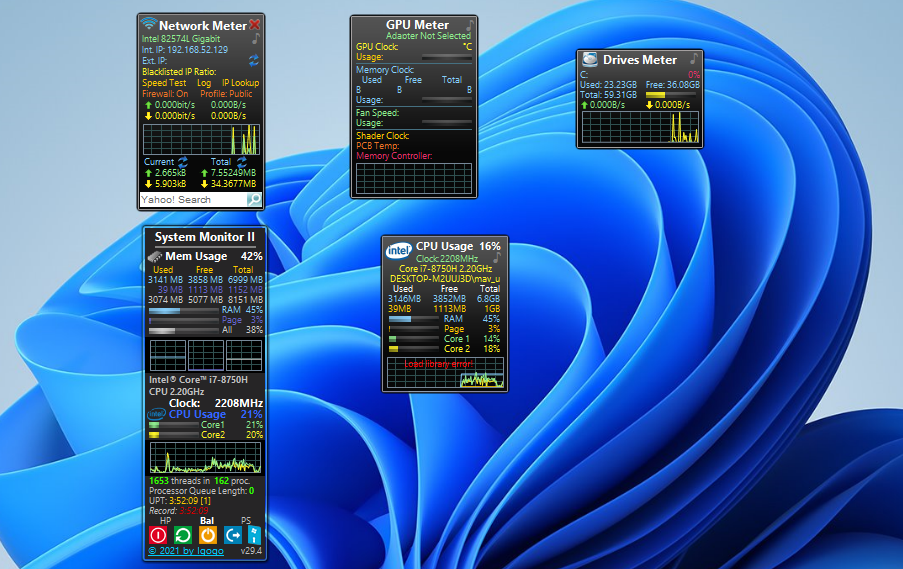 It will run, but no data will be displayed.
What should be the temperature of the video card without load and in games
Ok, now you know how to check the temperature of the video card in Windows 7/10. However, you still need to know what temperature indicators are acceptable. It is important to avoid overheating, because it can lead not only to a decrease in performance and the appearance of artifacts on the display, but also to sudden reboots of the computer and even to the failure of the video card.
Depending on the video chip model, the allowable temperature threshold is slightly different, but there are some average indicators that should be followed. So, what should be the temperature of the video card under load and without it? During normal operation, the normal temperature range for most graphics adapters is between 30 and 50°C. In summer, when the weather is hot, the temperature can rise to 60 degrees, which is also considered acceptable.
Notebooks typically have temperatures in the 40-60°C range. In particularly demanding games, the video card can heat up to 80-100 degrees. This temperature is considered high, so when it is reached, some cards may automatically reduce performance. Exceeding the centigrade threshold for most video adapters is critical, capable of damaging the device. The exception is video cards installed by the manufacturer in premium gaming laptops and can withstand temperatures up to 120 ° C.
How to find out the temperature of the video card — 10 ways
Some users need to know the temperature of the video card, this information is necessary to monitor the state of the hardware components of the computer. On a PC, due to various reasons, overheating of components may begin, and this leads to damage or failure of parts and devices.
Computer components become hot during use, sometimes very hot. On modern computers, the video card (GPU) is one of the hottest devices that require powerful cooling.
Contents:
- Temperature of the video card during operation
- How to check the temperature of the video card in GPU-Z
- HWMonitor — view the temperature of the graphics card
- GPU Temp program to monitor the temperature of the video card
- Open Hardware Monitor — check the temperature of the video card 9 0008
- MSI Afterburner — view video card temperature
- Measuring video card temperature in HWiNFO
- How to view video card temperature in Speccy
- SIW — Getting information about the temperature of the video adapter
- How to check the temperature of the video card in AIDA64
- How to find out the temperature of the video card in Windows 10
- Article conclusions
- How to find the temperature of the video card (video)
As a result graphics card overheating problems may appear in the operation of the PC, and in serious cases, the video adapter may fail. Therefore, it makes sense for users to periodically check the temperature of the video card.
Graphics card temperature during operation
Different types of graphics processors have different operating temperatures, depending on the specific model of the video adapter. Some models of video cards are factory overclocked, because of this they heat up more strongly.
The heating temperature of the graphics adapter is affected by the cooling system used on a particular model, the number of coolers used on the device.
In general, the normal temperature of the graphics card is between 30 and 60 degrees Celsius during normal computer work. In games or programs that use GPU graphics acceleration, the temperature may rise up to 90 degrees.
Temperatures above 100 degrees are considered the maximum allowable. While graphics card manufacturers NVIDIA and AMD (ATI) claim that their graphics cards can operate at this temperature, it’s best not to bring this situation up.
Refer to the documentation for your specific video adapter model for information on acceptable video processor temperatures.
To avoid overheating of the video card, you need to follow some requirements during its operation:
- Ensure proper air circulation in the computer case.
- Dust the graphics card cooler, parts and PC case.
To find out what the current temperature of the video card is, you need a program that monitors the current values in real time.
In this article you will find instructions on how to check the temperature of the video card in Windows using third-party software: specialized programs that display information about the status of the computer’s video adapter. Some applications are devoted only to graphic devices, other programs are more universal: they show data about all or most of the computer’s hardware components.
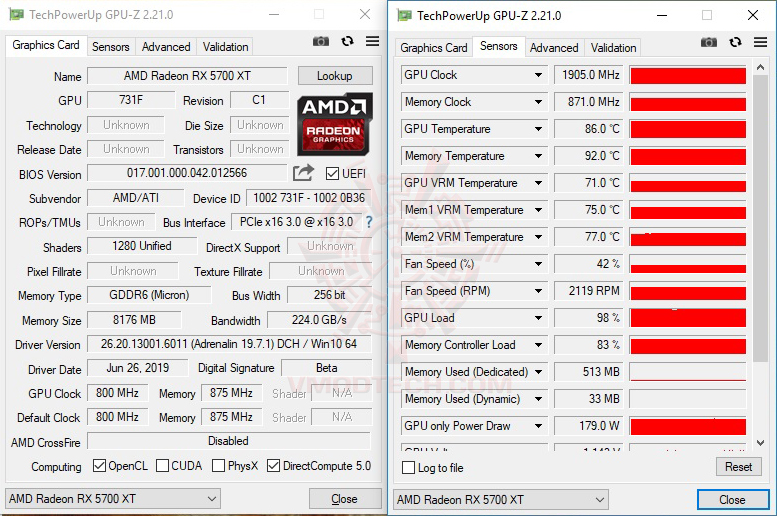
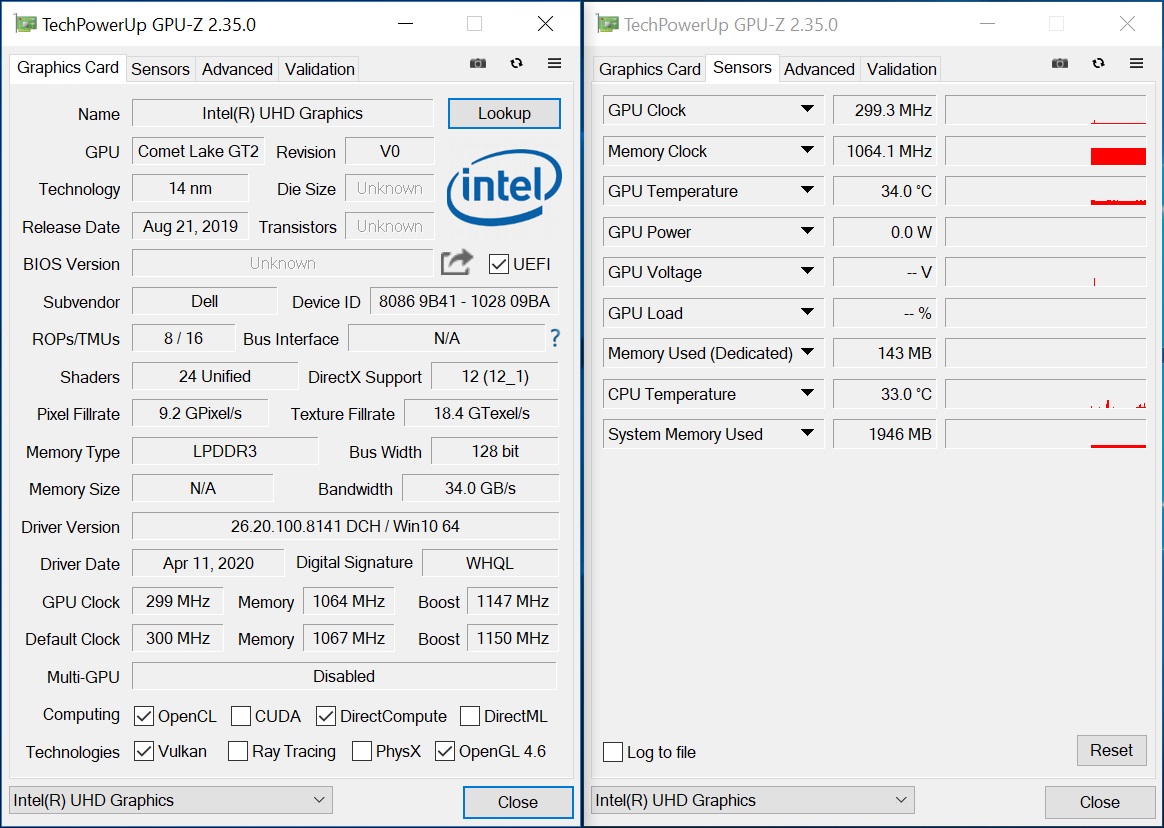
How to find out the temperature of the video card in GPU-Z
GPU-Z is a free program specially designed to get data about the computer’s video subsystem. The application shows the various characteristics of the GPU. Read the article on my website about the GPU-Z program.
You can not install the program, but simply run it on your computer. The interface of the GPU-Z program (GPU Zet) works in English.
Go through the steps:
- In the main GPU-Z window, open the Sensors tab.
- Find «GPU Temperature» among the available readings.
- Shows the temperature of the GPU as read by the video driver. To the right is a graph showing the status of temperature values (red bar).
HWMonitor — View graphics card temperature
The HWMonitor program is designed to obtain information about the status of various computer components. The program was developed by the creator of the CPU-Z program.
The program has paid and free versions. A free app is fine for us.
The video chip temperature can be seen as follows:
- Run NWMonitor on the PC.
- The «Sensor» window will display various parameter data.
 Under the name of the graphics card, the «Temperatures» section shows the GPU values in Celsius and Fahrenheit.
GPU Temp program for monitoring graphics card temperature
GPU Temp is a freeware program that displays the temperature of the graphics accelerator. The application window displays the temperature of the video adapter and a graph of values in the current state.
Open Hardware Monitor — check the temperature of the video card
Open Hardware Monitor — a free program for monitoring temperature sensors, fan speed, voltage, load and clock speed of the processor.
In the Open Hardware Monitor window, scroll the scroll wheel to the name of your computer’s video adapter. The «Temperatures» option shows the current «GPU Core» values.
MSI Afterburner — View graphics card temperature
MSI Afterburner is a free program from a well-known electronics manufacturer designed to overclock video cards.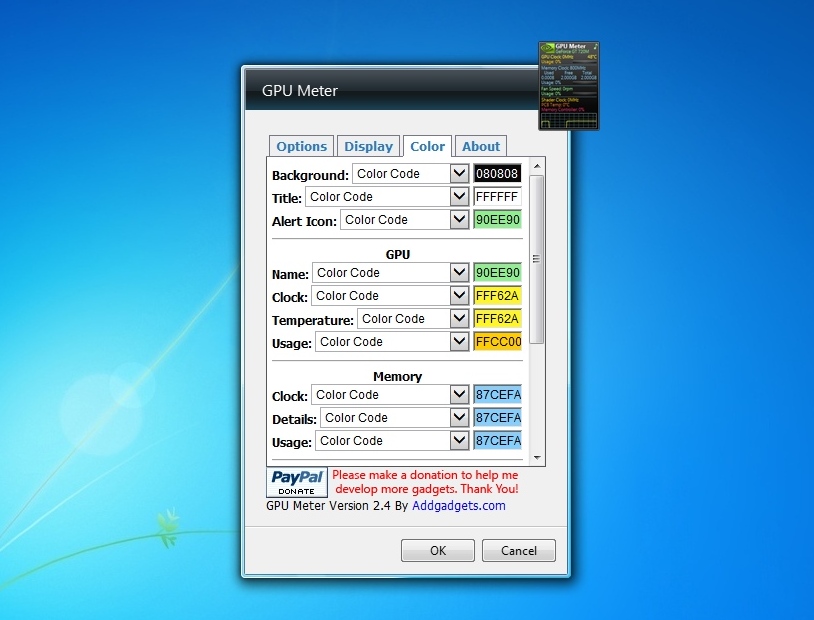 Along with the main purpose, the utility shows the temperature of the graphics device.
MSI Afterburner works with all NVIDIA and AMD graphics cards. The program shows the hardware components of the computer, using the application you can test performance, record, adjust the fan speed.
You will need to do the following:
- Run MSI Afterburner on your computer.
- In the application window, the current temperature of the graphics adapter is displayed on the right side. At the bottom of the program window, a graph of temperature changes is shown.
HWiNFO video card temperature measurement
HWiNFO is a free application for getting information about PC hardware components. With this tool, you can view detailed information about each component of your system.
HWiNFO has a wide range of system monitoring options for temperature, fan speed, voltage and power. The application includes a sidebar gadget that allows you to check the status of your computer’s RAM, CPU, GPU, etc.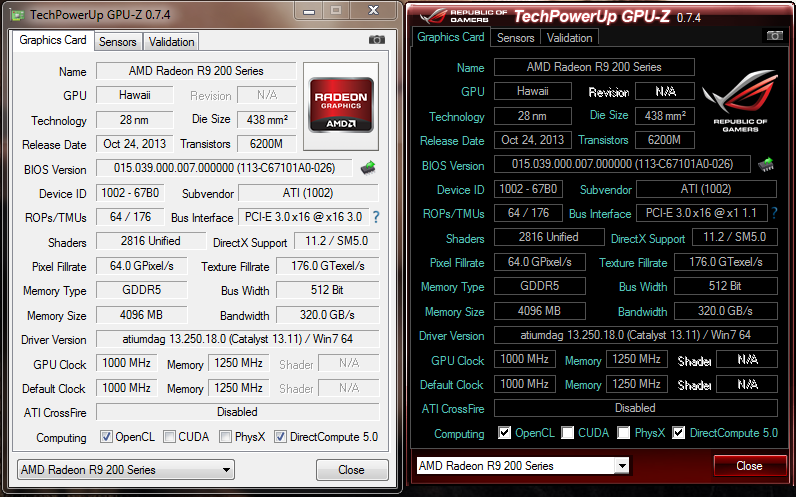
The program is in English. Depending on the bitness of the Windows operating system, the program is called «HWiNFO64» or «HWiNFO32».
Do the following:
- In the HWiNFO64 main window, click on the «Sensors» button.
- An additional window will open with the status of the current state of the computer. Find the GPU device, check the temperature.
How to view graphics card temperature in Speccy
The free Speccy program provides information about computer hardware. The program contains a lot of data related to PC hardware. Read more about Speccy here.
You will need to do the following:
- In the main window of the Speccy program, click on the «Graphics Devices» item in the left vertical menu.
- Under graphics, navigate to your computer’s video adapter.
- Among other information, the temperature of the graphics card is displayed here.
If you click on the icon next to the temperature value, a graph will open showing the GPU temperature fluctuations in real time.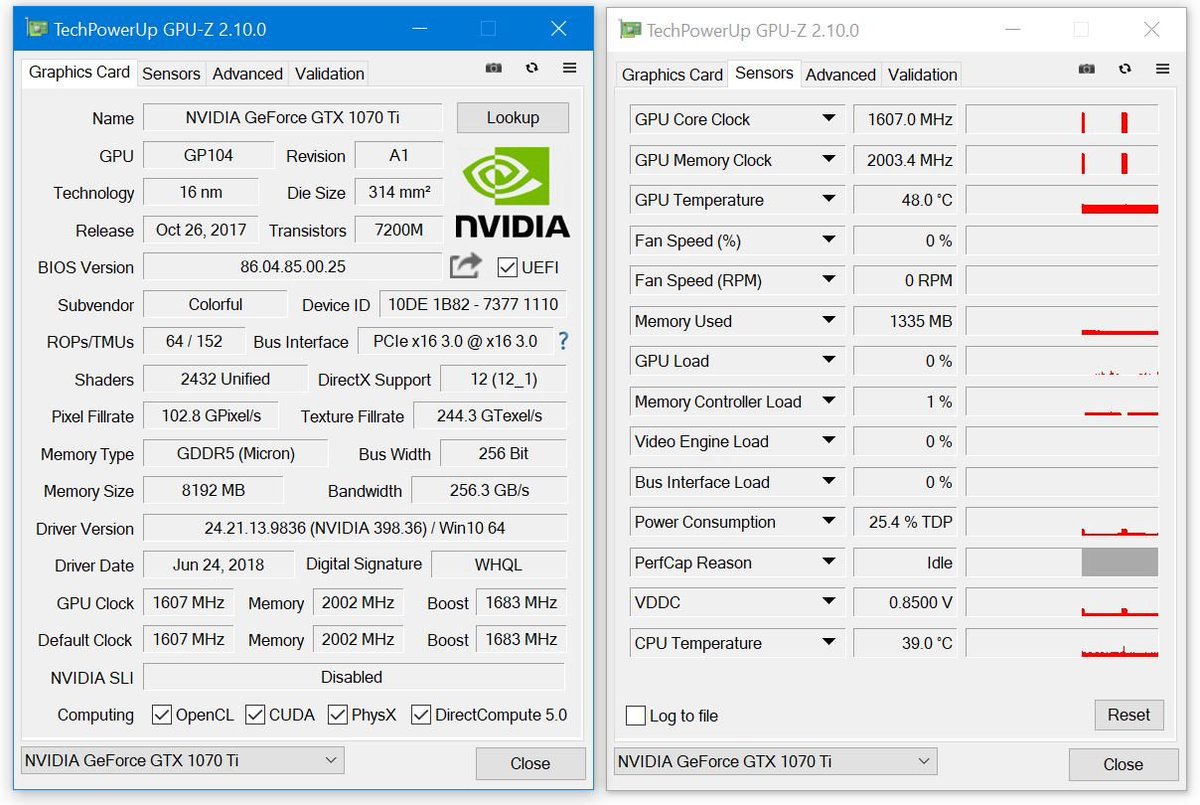
SIW — getting information about the temperature of the video adapter
SIW (System Information for Windows) — a powerful program for obtaining complete information about the system: about the hardware and software of the computer.
Go through the following steps:
- In the main window of the SIW program, in the left column, go to the «Hardware» section.
- Click on Sensors.
- Find your graphics card in the device list. In the «Temperatures» option, in the «GPU» option, the current value is shown in degrees Celsius and Fahrenheit.
How to check graphics card temperature in AIDA64
AIDA64 is the most powerful tool to get computer data. The program contains a huge amount of all kinds of information. The site has a detailed article about using the AIDA64 program.
Do the following:
- In the AIDA64 main window, in the left column, in the Menu tab, click on Computer.
- In the main part of the program window, icons will be displayed to navigate to certain indicators, click on the “Sensors” icon.
- The Temperatures section shows the graphics card temperature under GPU Diode.
In AIDA64, you can perform system stability test, including GPU test.
How to check graphics card temperature in Windows 10
Windows 10 has a built-in PC performance monitoring feature. Thanks to this, the temperature of the video card in Windows 10 is shown in the state that it has at the moment.
The necessary information about the state of the graphics subsystem is in the Task Manager. The user needs to do a few simple steps to get the desired information.
Go through the following steps:
- Right-click on the Taskbar.
- In the context menu, click on the «Task Manager» item.
- In the Task Manager window, click the Performance tab.
- Scroll the mouse wheel in the left column down, click on the item «GPU».
Some computers may have two video adapters: an integrated graphics card and a discrete graphics card.