PowerColor Radeon RX 5700 XT Red Devil Review
Manufacturer: PowerColor
UK price (as reviewed): £449.99 (inc. VAT)
US price (as reviewed): $439.99 (exc. tax)
We’ll make no apologies for the continued interest in custom RX 5700 XT cards on these pages. While AMD’s 7nm GPUs are by no means perfect, they do offer truly compelling high-end performance in everything but ray tracing workloads, and while Nvidia’s Super refresh has seen partners simply rehash existing card designs for the most part, Navi has given AMD’s partners a real chance to show what they can do and is allowing less prominent manufacturers like Sapphire and now PowerColor to shine with compelling designs that put more established brands like MSI to shame.
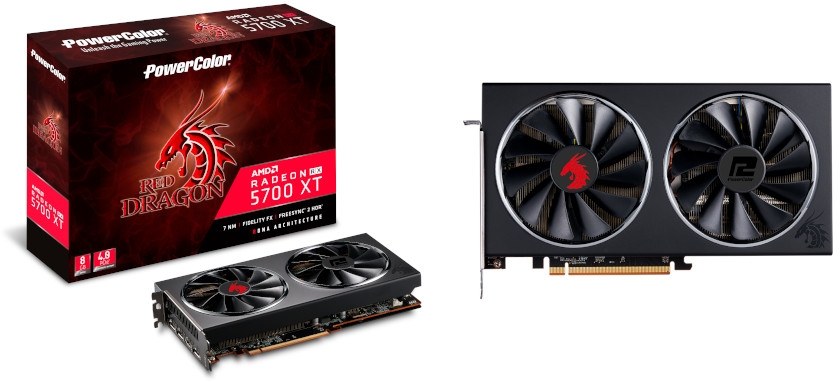
The RX 5700 XT Red Devil is PowerColor’s flagship Navi part that sits above the dual-fan Red Dragon in its stack. As you’ll see, it is similar in many regards to the excellent Nitro+ design from Sapphire – size, clock speeds, price, and features are all largely a match:
| Name | AMD Radeon RX 5700 XT | Sapphire RX 5700 XT Pulse | MSI RX 5700 XT Evoke OC | Sapphire RX 5700 XT Nitro+ | PowerColor RX 5700 XT Red Devil |
|---|---|---|---|---|---|
| Base Clock | 1,605MHz | 1,670MHz (+4%) | 1,690MHz (+5%) | 1,770MHz (+10%) | 1,770MHz (+10%) |
| Game Clock | 1,755MHz | 1,815MHz (+3.5%) | 1,835MHz (+4.5%) | 1,905MHz (+8.5%) | 1,905MHz (+8.5%) |
| Boost Clock | 1,905MHz | 1,920MHz (+1%) | 1,945MHz (+2%) | 2,010MHz (+5.5%) | 2,010MHz (+5.5%) |
| Memory Data Rate | 14Gbps | 14Gbps (+0%) | 14Gbps (+0%) | 14Gbps (+0%) | 14Gbps (+0%) |
| Total Board Power | 225W | ~241W | ~240W | ~265W | ~265W (?) |
| Power Connectors | 1x 8-pin, 1x 6-pin | 1x 8-pin, 1x 6-pin | 1x 8-pin, 1x 6-pin | 2 x 8-pin | 2 x 8-pin |
| Multi-BIOS | No | Yes, 2 | No (only via download) | Yes, 3 | Yes, 2 |
| Display Connectors | 3x DP, 1x HDMI | 3x DP, 1x HDMI | 3x DP, 1x HDMI | 2x DP, 2x HDMI | 3x DP, 1x HDMI |
| Length | 270mm | 258mm | 236mm | 306mm | 300mm |
| Height | 110mm | 135mm | 128mm | 135mm | 132mm |
| Slots | 2 | 3 | 3 | 3 | 3 |
| Power Phases | 7(+1)+2 | 7(+1)+2 | 7(+1)+2 | 8(+1)+2 | 10(+1)+2 |
| LEDs | Yes, red | Yes, red | No | Yes, ARGB | Yes, RGB |
| Zero RPM Mode | No | Yes | Yes | Yes | Yes |
| Warranty (UK) | 2 years min. |
2 years | 3 years | 3 years | 3 years |
The Red Devil joins the Nitro+ in having the highest clock speeds so far, though as usual these are really just indicators of the extended voltage-frequency curve rather than fixed points on it. Still, a Game Clock that’s over eight percent higher than reference is a solid boost. Sadly, the memory is not overclocked, but PowerColor is no different to other partners in that regard.
If you want Navi to boost higher, you need to feed it a fair bit more power, which is why we also see PowerColor join Sapphire in having the highest Total Board Power figure. 265W is actually our estimate based on an official GPU Only Power figure of 220W; overall consumption tends to be around 45W higher than this figure for RX 5700 XT cards.
With 265W approaching the 300W limit on available power when using the reference power plugs (eight-pin plus six-pin), PowerColor has sensibly opted instead for a dual eight-pin setup to increase the theoretical maximum power available to 375W (150W per eight-pin, up to 75W from the PCIe bus), thus ensuring any realistic overclocks won’t be limited by the available power. Annoyingly, these are not indented into the card’s frame, so you’ll have to account for the height of your cables as well as the already-substantial height of the card itself.
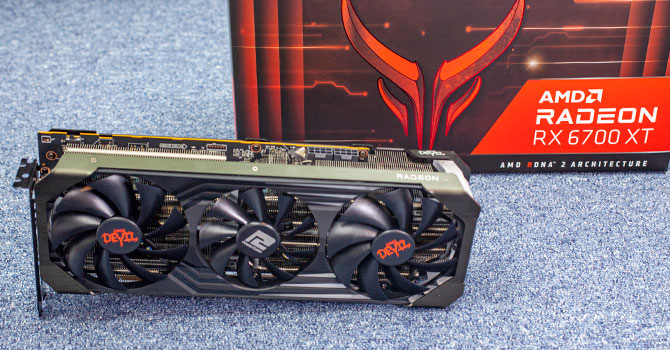
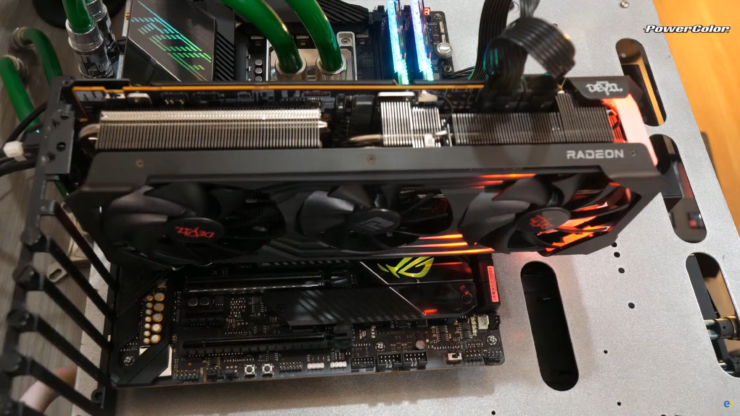
Additional power means additional heat, so it’s also no surprise to see so large a cooler strapped to the Navi 10 GPU. The Red Devil and Nitro+ are almost identical in size, in fact, with both requiring about 300mm of clearance and three expansion slots. Mounting either card vertically is therefore going to see them suffocated in most cases, so plan carefully if you insist on doing this.
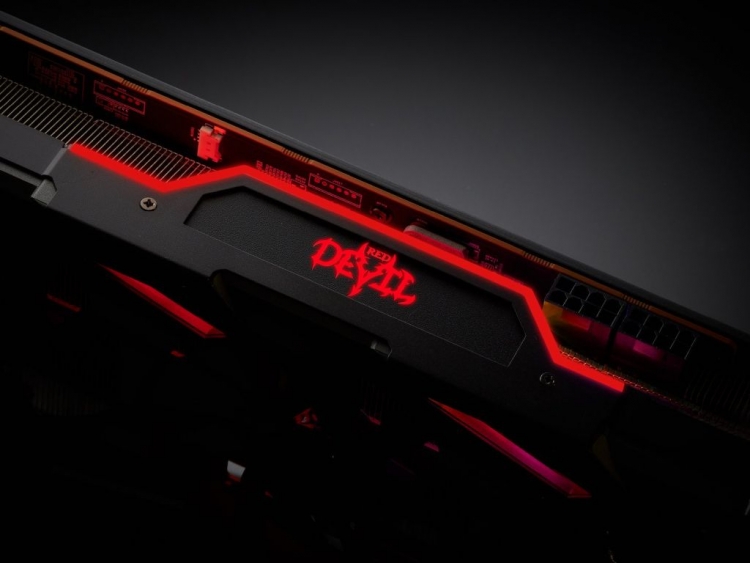
The build quality here is excellent with plenty of metal used in the construction including the 1.5mm-thick backplate. This also means it’s very much on the heavy side at around 1.25kg. Looking to bolster aesthetics, PowerColor goes against the name of the card and offers full RGB lighting along the top edge and on the backplate. You’re forced to use PowerColor’s own software to control this, whereas on the Sapphire Nitro+ card there’s a pinout on the PCB that lets you solder 5V addressable RGB connectors to it in order to enable motherboard control, though we can’t see many taking the time or effort to do that. The Red Devil is almost entirely colour-neutral, so there shouldn’t be any clashing regardless of which colour or effect you choose.
Whereas Sapphire opted for an equal split of HDMI and DisplayPort headers, PowerColor sticks to the reference design that has one of the former and three of the latter. We’ve no real preference ourselves, but Sapphire’s is arguably better if you’re intent on using a VR headset. That said, PowerColor has a nifty feature where the ports illuminate red, so it’ll be easier to see what you’re doing in the dark.
| BIOS Position | OC BIOS (default) | Silent BIOS |
|---|---|---|
| Base Clock | 1,770MHz | 1,605MHz |
| Game Clock | 1,905MHz | 1,755MHz |
| Boost Clock | 2,010MHz | 1,905MHz |
| Memory Data Rate | 14Gbps | 14Gbps |
| GPU Power | 220W | 180W |
Pleasingly, PowerColor has also included a proper dual-BIOS switch, giving you redundancy when overclocking and making available a so-called Silent mode.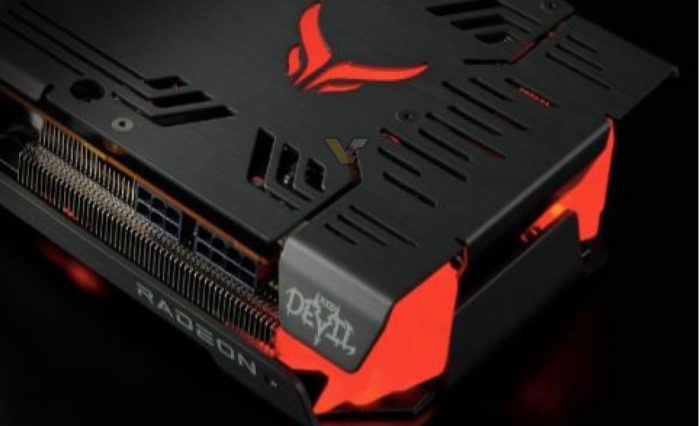 This drops the power consumption and clock speeds to the same as what you get from the reference card, which should have a tangible impact on fan speeds too. We also like that the positions of the switch on this card are labelled.
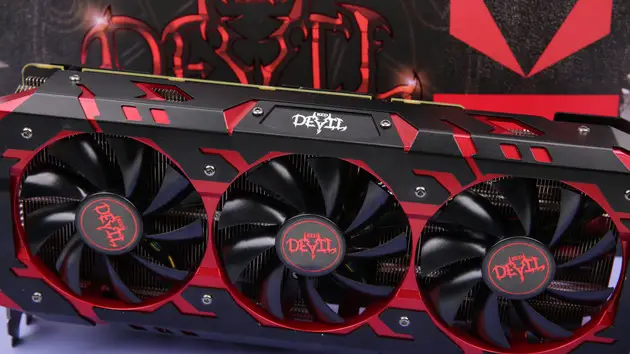
The cooler uses three 90mm fans all of which spin in the same direction and which are supposedly optimised for static pressure. They have a zero-RPM (semi-passive) mode, and the cutoff point is 60°C. Airflow is expelled out of the top and bottom (towards your motherboard), so most hot air will be dumped in your chassis – be sure you have adequate exhaust airflow. While the backplate unfortunately does not get directly involved in the cooling with thermal padding, it does have a cutaway section that aligns with the end of the PCB, allowing air to pass through the heatsink.
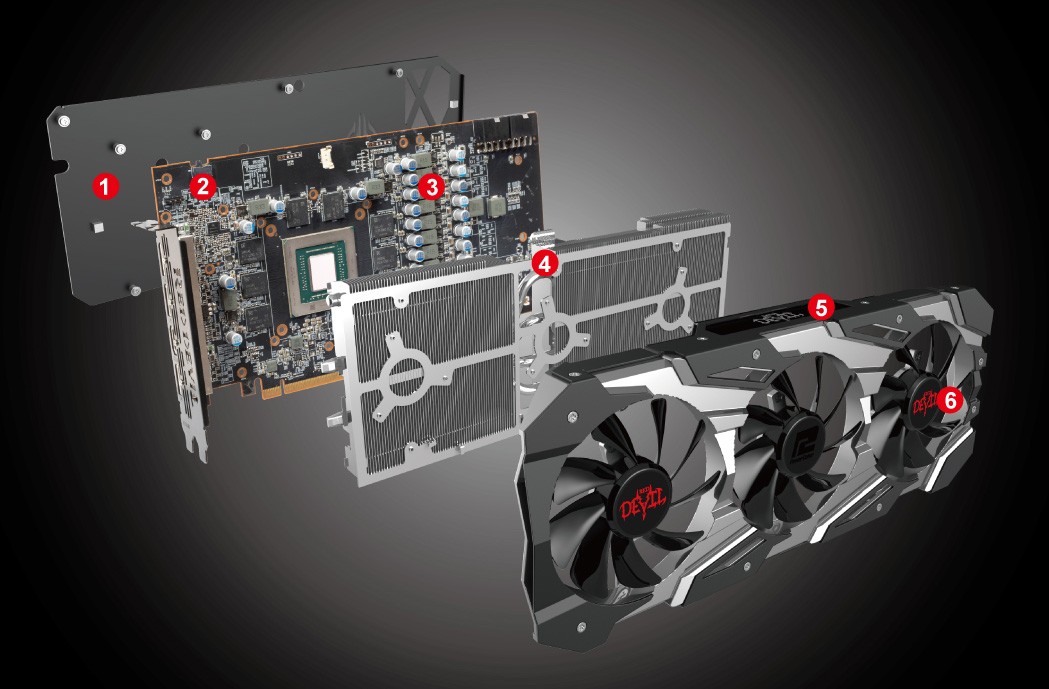
The cooler is easy to remove from the PCB (just six screws), and doing so reveals a 10-phase setup for the GPU, which is the highest we’ve seen so far. This isn’t necessarily a good thing (overclocking tends to be more affected by power limit, thermals, and silicon quality when sticking to air cooling), but it’s certainly not a bad thing, and PowerColor also boasts that it uses Dr. MOS components for its VRMs, the claimed benefits of which we’re unable to test. The power phase count for the other areas of the card remains the same as you get on reference, which means two dedicated to the memory.
Whereas Sapphire used a decoupled heatsink to cool the memory modules, PowerColor instead uses a single large copper contact plate with thermal paste for the GPU and thermal pads (full-size, thankfully) for the GDDR6 packages. This feeds five copper heat pipes, and all copper here is nickel-plated, creating a nice consistent shine. There are two aluminium fin stacks, and the larger one also has a contact plate that directly cools the MOSFETs of the primary GPU VRMs. Sapphire’s Nitro+ cooler also had pads for the secondary MOSFETs around the card and the VRM IC, but this is a pretty minor point of comparison. Overall, the amount of metal used and the level of coverage on the core components looks great here, and we have no major complaints about PowerColor’s cooler design.
PowerColor has confirmed that the RX 5700 XT Red Devil carries a three-year warranty in the UK. This is good news, as it matches Sapphire and is one year more than what you get from some reference and even some other third-party designs.
PowerColor RX 5700 XT Red Devil Review vs. Sapphire Nitro+, Gaming X, & More | GamersNexus
Test Methodology
We have overhauled the host test bench and had updated with new games. Our games selection is a careful one: Time is finite, and having analyzed our previous testing methodologies, we identified shortcomings where we were ultimately wasting time by testing too many games that didn’t provide meaningfully different data from our other tested titles. In order to better optimize our time available and test “smarter” (rather than “more,” which was one of our previous goals), we have selected games based upon the following criteria:
- Game Engine: Most games run on the same group of popular engines.
 By choosing one game from each major engine (e.g. Unreal Engine), we can ensure that we are representing a wide sweep of games that just use the built-in engine-level optimizations
 - API: We have chosen a select group of DirectX 11 and DirectX 12 API integrations, as these are the most prevalent at this time. We will include more Vulkan API testing as more games ship with Vulkan
- Popularity: Is it something people actually play?
- Longevity: Regardless of popularity, how long can we reasonably expect that a game will go without updates? Updating games can hurt comparative data from past tests, which impacts our ability to cross-compare new data and old, as old data may no longer be comparable post-patch
Game graphics settings are defined in their respective charts.
We are also testing most games at all three popular resolutions – at least, we are for the high-end. This includes 4K, 1440p, and 1080p, which allows us to determine GPU scalability across multiple monitor types.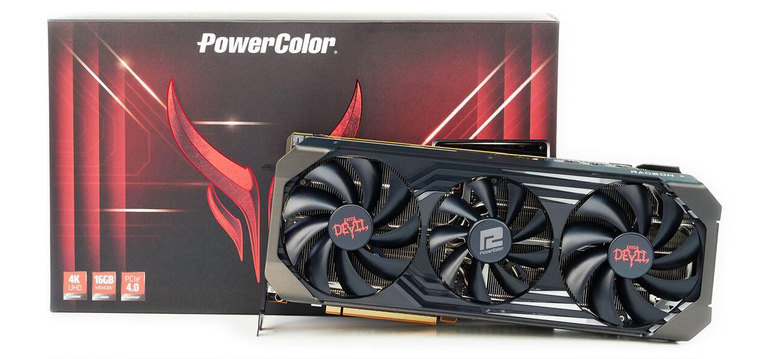 More importantly, this allows us to start pinpointing the reason for performance uplift, rather than just saying there is performance uplift. If we know that performance boosts harder at 4K than 1080p, we might be able to call this indicative of a ROPs advantage, for instance. Understanding why performance behaves the way it does is critical for future expansion of our own knowledge, and thus prepares our content for smarter analysis in the future.
For the test bench proper, we are now using the following components:
GPU Test Bench (Sponsored by Corsair)
|
Component
|
Courtesy of
|
|
|
CPU
|
Intel i7-8086K 5.0GHz
|
GamersNexus
|
|
GPU
|
This is what we’re testing!
|
Often the company that makes the card, but sometimes us (see article)
|
|
Motherboard
|
ASUS ROG Maximus X Hero
|
ASUS
|
|
RAM
|
Corsair Vengeance LPX 32GB 3200MHz
|
Corsair
|
|
PSU
|
Corsair AX1600i
|
Corsair
|
|
Cooler
|
NZXT Kraken X62
|
NZXT
|
|
SSD
|
Plextor 256-M7VC
|
GamersNexus
|
All memory timings are completely controlled for our new GPU testing, which has significantly tightened our error margins. Windows is version 1903. Note that some games, like GTA V and Hitman 2, have been manually tuned outside of a simple preset to ensure we have a proper benchmark. GTA V uses 2x MSAA in our testing, as it runs into engine frame limits at 187.5FPS and triggers engine-level bugs. Hitman 2 has crowd simulation and sound simulation settings that we tune back to the 4-core setting, as running higher than that creates a CPU bottleneck (and more of a CPU benchmark, as a result).
40dBA Noise-Normalized Thermals – GPU
We’ll start with noise-normalized thermals, as this gives us the best look at cooler efficiency when all matched to the same noise level. Allowing coolers to run how they want is a different test, coming up later, but also means that anyone who brute forces high fan RPMs and noise can “win” the charts. That’s why we segment them. Results will mostly scale hierarchically, so if you have a 40dBA noise level, the hierarchy will mostly retain rank at, say, 44dBA. 40dBA is equal to or higher than what most coolers run stock, with most within 1-3dBA.
The Red Devil 180W Silent configuration runs the coolest. This isn’t a huge feat seeing as the power budget is also reduced, and so comes our next point: power must also be monitored, if not normalized. At 180W, this cooler is most comparable to reference at 40dBA — a massive improvement – or perhaps the Sapphire Pulse at 194W and Taichi X at 190W. Even against the Taichi X, the closest at 79 degrees Junction, the Red Devil maintains enough of a lead that even a 10W reduction to the Taichi won’t equalize the two.
With the OC VBIOS, the Red Devil maintains 220W under this benchmark, allowing it to run better than the Nitro+ by about 2-3 degrees Celsius Junction. The Edge temperatures are also close. The Taichi X at 230W still runs the hottest of the partner cards, at 92 degrees Junction against the high power consumption VBIOS, and the THICC at 210W runs 90 degrees Junction. The Red Devil and Nitro+ remain the most efficient cooler designs, with the Gigabyte Gaming OC and Sapphire Pulse following-up in the more reasonably priced category.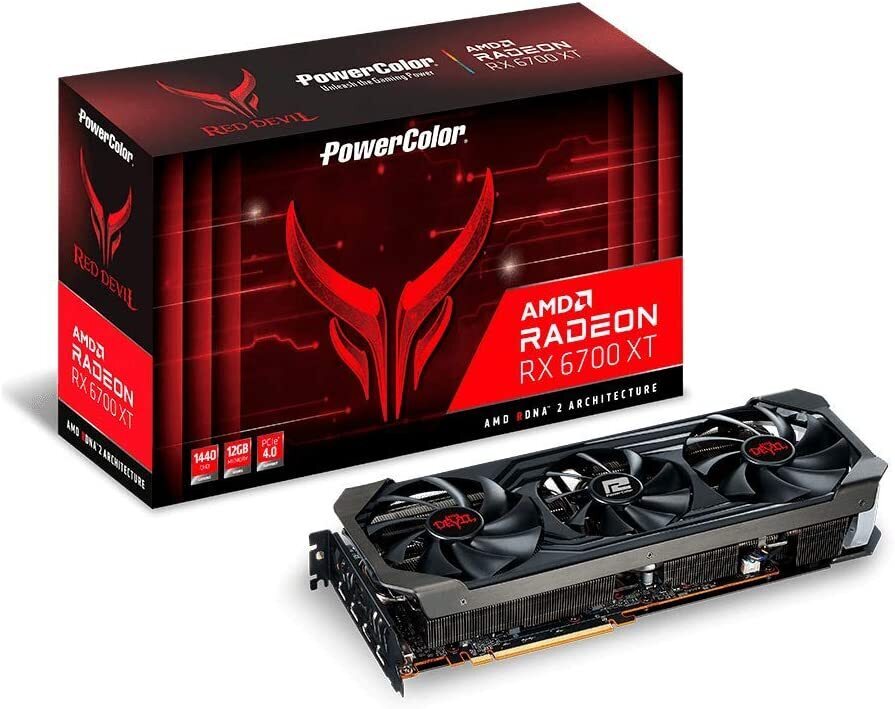
40dBA Noise-Normalized Thermals – VRAM
GDDR6 and VRM MOS thermals are next. As we said in the last one, VRM MOS thermals aren’t all that relevant here aside from ensuring nothing is horribly wrong. It doesn’t matter if one MOSFET is cooler than the other in terms of performance – at least, not until you’re at or above 125 degrees – but it does matter from a purely technical standpoint of cooler design. Memory is far more important, as the cards toward the bottom of this chart, like Reference, the Evoke, and the THICC, can all hit maximum memory temperatures of 105C+ when installed in a case with a higher ambient.
The PowerColor Red Devil’s 180W Silent VBIOS ends up second-place, behind the 20W-higher Sapphire Nitro+, when it comes to GDDR6 cooling. Both are so cool that it’s irrelevant who’s in the lead, as memory doesn’t boost based on GDDR6 thermals. That said, from a purely technical standpoint, the Nitro+ is the superior design for GDDR6 cooling, even with 20W more power budget. The Red Devil at 220W ends up again behind the Nitro+, retaining the scaling as the other test. With the two power budgets now equalized, we can see that the Nitro+ keeps about a 2-degree gap in GDDR6 thermals on the hottest module. In reality, both cards are performing well, and it doesn’t particularly matter which of the two you buy when it comes to memory or MOS thermals.
Disassembly
Check the video above for disassembly footage.
The cooler is fairly straight-forward, with most of its performance derived the old way: A lot of fans and a lot of metal. The finned heatsink has standard fin pitch and density and no fancy design elements, but if it works, that’s all that matters. Removing the heatsink reveals a separate aluminum coldplate for contacting memory, including some plus-shaped Phillips indents on the memory thermal pads. These screws help distribute the force of the aluminum plate, but aren’t the only thing connecting the memory plate to the heatsink. One of our concerns with some coolers is that it’s just a few screws contacting plates together, but the Red Devil takes the more traditional approach of welding the plate to the heatsink fins, then adding screws for additional support. We’re fine with this assembly.
There’s no direct conduction from the inductors to the heatsink, unlike the last card we tore apart, but this also isn’t important. The inductors are just copper coils inside of a shell, and they are capable of running at the highest temperatures out of every device on the card.
Thermal paste is well-spread on this card, and the heatsink has basically a perfect mount. We have completely even spread of compound across the die and outer edges, indicating even mounting pressure. As this was purchased retail, we also have some assurance in knowing it resembles what consumers buy.
There’s full contact of about 3 heatpipes to the GPU, with another 0.5 contact at the outer edges. Powercolor is using 6mm heatpipes, fairly standard for this generation, and has wide gaps between the heatpipes and the plate if looking under the hood.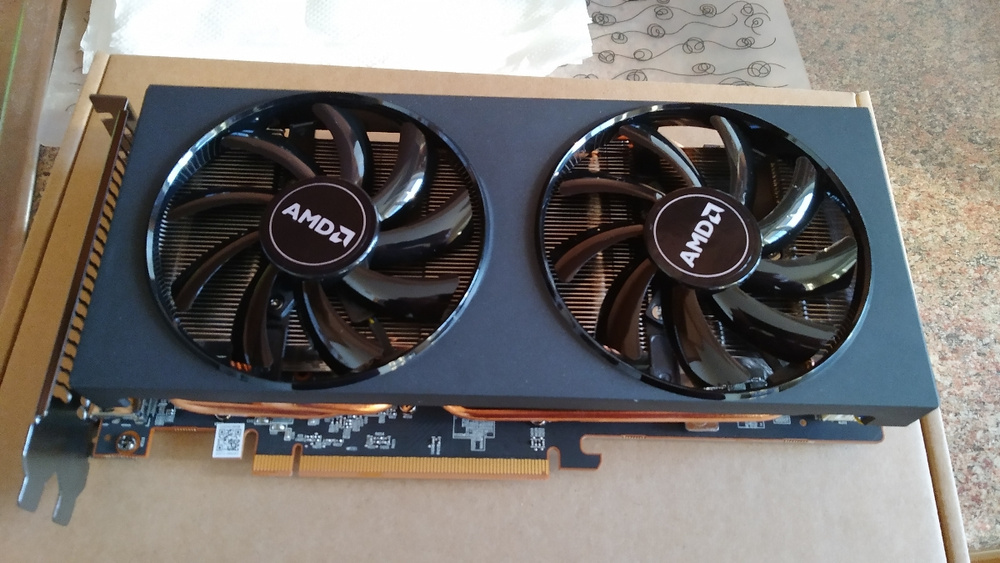 This is an area for potential in-fill and improvement, but not one which is all that relevant to performance.
Finally, the backplate on this card has no functional purpose. There aren’t any thermal pads connecting the backplate to the memory or rear of the GPU or VRM, and so it’s purely for looks. This is another area where Powercolor could undoubtedly improve if it felt the need.
Auto Thermals – GPU
Auto thermals are tricky to benchmark with this card. The PowerColor Red Devil behaves differently in FurMark than it does in 3DMark and games, which was true for another game that we tested previously. This means that unscrupulous testing in just one application wouldn’t give us a proper look at how the card performs; testing only in FurMark would mean a more aggressive fan curve, which doesn’t translate to real-world gaming scenarios, and so would paint the Red Devil as more capable than it truly is when auto. For this reason, we ran a second set of auto tests with the fan configured to follow the curve that’s used in games, then one that was configured to follow the curve in FurMark. The gaming curve will better represent scaling performance versus the other cards, in terms of establishing a hierarchy.
Starting with auto GPU temperatures. This allows us to see how the device performs when left to use its automatically configured VBIOS tables for both FurMark and gaming. The Red Devil at 220W with its FM profile is now among the chart-toppers, ranking alongside the Taichi X at 190W and XFX THICC Ultra at 190W. The THICC managed this performance by blasting fan speeds faster than most others, whereas the Taichi X was simply running lower power budget than some of the others.
The Red Devil ends up at its 80-degree Junction temperature with a 1750RPM fan speed, which is very close to our 40dBA measurement. That said, this isn’t actually how the fan behaves in gaming, despite how it behaves in FurMark. For gaming, it’ll spin at 1340RPM with the OC VBIOS and 1000RPM for the Silent VBIOS. This chart tells us that PowerColor has configured a fan curve that’s in the middle when in FurMark: When the THICC is running closer to 44-46dBA, depending on scenario, the Red Devil sits around 40dBA, and a lot of these other cards fall within 37, 38, or 39dBA marks. The difference is that the others, shown here, would also stack-up the same in 3DMark or a game, whereas the Red Devil would drop dramatically. If we highlight the 180W Actual Auto ranking, the Red Devil now ends up last, at 94 degrees Junction and 76 Edge, next to the Thicc with its terrible Ultra-High VBIOS. That doesn’t mean the cooler is bad, it just means the fan isn’t aggressive enough with silent mode. With the 220W Actual Auto rank, we’re near the Gigabyte Gaming OC and Nitro+, down around 90 degrees. That’s a big drop from the FurMark auto setting, and is more of where you should expect the card for regular use.
Again, all this really means is that the auto results could be improved upon by manually setting a fan curve. PowerColor’s cooler is fine when normalized, but doesn’t run aggressively enough, we think, under gaming conditions.
Auto Thermals – VRAM
GDDR6 thermals are up now, this time with auto settings. The Red Devil with its FurMark Auto settings ends up topping the chart, running its fans at 40dBA and outperforming the louder THICC without any issues at all, despite a higher power consumption. The Nitro+ is also outperformed here, but runs a quieter fan speed – hence the need to noise-normalize, as we did earlier. The FM Auto 180W test had us down near the Gaming X and Evoke with auto settings, pre-mod. As for applying the fan speeds used in games, the Red Devil ends up near the MSI Gaming X at 210W, although slightly advantaged. It’s middle of the pack, otherwise, and not particularly strong in its auto configuration.
Fan/Frequency of Red Devil RX 5700 XT
We’ll get the RPM plots for 3DMark on the screen now, representing performance for gaming workloads. Plotting fan RPM and GPU Edge temperature first, the OC VBIOS tries to sustain a GPU Edge temperature of about 72 degrees Celsius, which pushes an RPM of about 1300-1350. There’s a hard falloff at the beginning of the test from about 1700RPM down to this resting speed.
Looking next at frequency response, we can see that the OC VBIOS averages about 1950MHz during the course of the 3DMark workload. The Silent VBIOS is able to carry its lower fan RPM in part thanks to the 1830MHz average frequency, a significant reduction versus the OC VBIOS.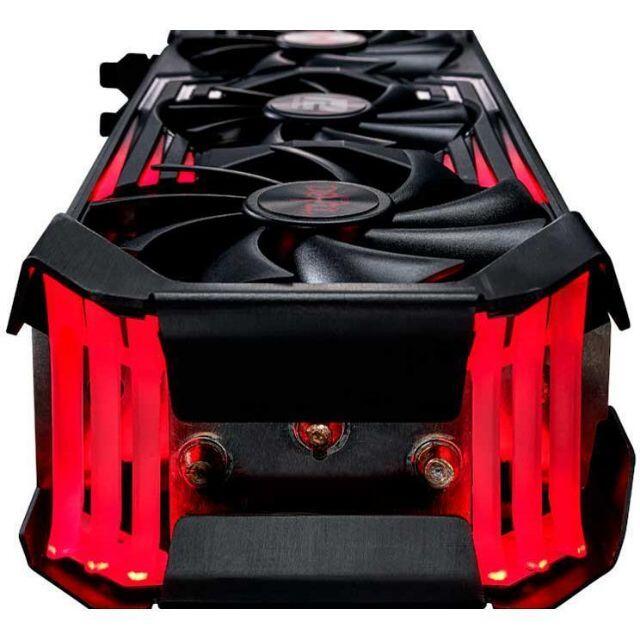
Frequency vs. Others
Here’s a super zoomed-in look at some other cards. We can’t fit all of them, obviously, but it’ll give you a good idea of the upper and lower limits. The Taichi X and its 230W VBIOS still holds claim of the highest out-of-box frequency, in the 2020MHz range and above everything else. The MSI Gaming X is next, then the Red Devil, then the THICC and Reference card. The AVG FPS delta between Reference and something like the Red Devil would be about 2-2.2% on average, for reference, so there’s not a big performance range here. Highest frequency isn’t a metric by which we judge value when the deltas are so low, especially when considering it can all be equalized in software. Also, this scale is 1850MHz to 2040MHz, so everything is blown-out to get a better view. It’d all be on top of each other if left with a normal scale.
Noise Levels
Here’s a plot of noise levels at a given RPM. The curve isn’t as linear as some others we’ve seen and tops-out higher, giving some additional headroom at the high-end for cooling if desired. That said, at over 60dBA, not many people will want to venture this high in RPM. It’s also just genuinely not necessary, as the card remains well within operating bounds when pegged around 40dBA. The only use would be on-air heavy overclocks and powerplay table mods for competitive overclocking, but you’d be better off with a water-cooled card for that.
Conclusion
The Powercolor RX 5700 XT Red Devil is similar in performance to the Sapphire Nitro+, with the two trading places depending upon which benchmark is used. We’d assign a slight advantage to the Nitro+ (although the Red Devil has the second-best PCB we’ve looked at), but at the level of performance that both these cards achieve, it doesn’t matter too much which of the two is purchased. For a more affordable 5700 XT, the Gigabyte Gaming OC still makes the most sense. For one of the higher-end ones, we like either the Nitro+ or the Red Devil, and would pick according to looks, fitment, price, and availability in your region. Whichever is cheaper or readily available would be fine.
The Red Devil has some clear avenues for improvement, like utilization of the backplate as a heatsink via thermal pads for the memory, but is overall above average for coolers on the RX 5700 XT series. The Red Devil was heavily hyped over the past few months, but we have the advantage of looking at it last. Without the context of some of these other cards, like the strong Gaming OC and Nitro+ performance, the Red Devil would have a clear victory. With, however, the context of most the other relevant cards, the Red Devil fits in relatively equally with some of these others.
Editorial, Testing: Steve Burke
Video: Josh Svoboda, Andrew Coleman
Powercolor RX 5700 XT Red Devil in Review — Power is the acceleration of massive time The
Powercolor sets up a decent brand flavor with the RX 5700 XT Red Devil — both in terms of performance and massive cooler, as well as in terms of price. There is also a Silent BIOS that truly lives up to its name. But I don’t want to spoil, I want to check. So it’s better to read for yourself.
How are you most likely to annoy your competitors? Impressively showing who has the longest and biggest. And if you then stay a little more subdued in terms of price and can score with features, then the product is selling well. Too much praise beforehand? Honor, to whom honor owes, but you are right. This will be included in the summary later. Now, as always, the focus is on product testing. nine0003
In order to make it all a little clearer and also to get a little more to the point, I largely kept the structure of the articles, but now I rely more on tables with a clear representation of the result value and specifications, which later also provide a better map comparison together.
Specifications and picture gallery
The design is based on old versions and is new. These include LED applications on the card and top with illuminated lettering and an illuminated logo in the back.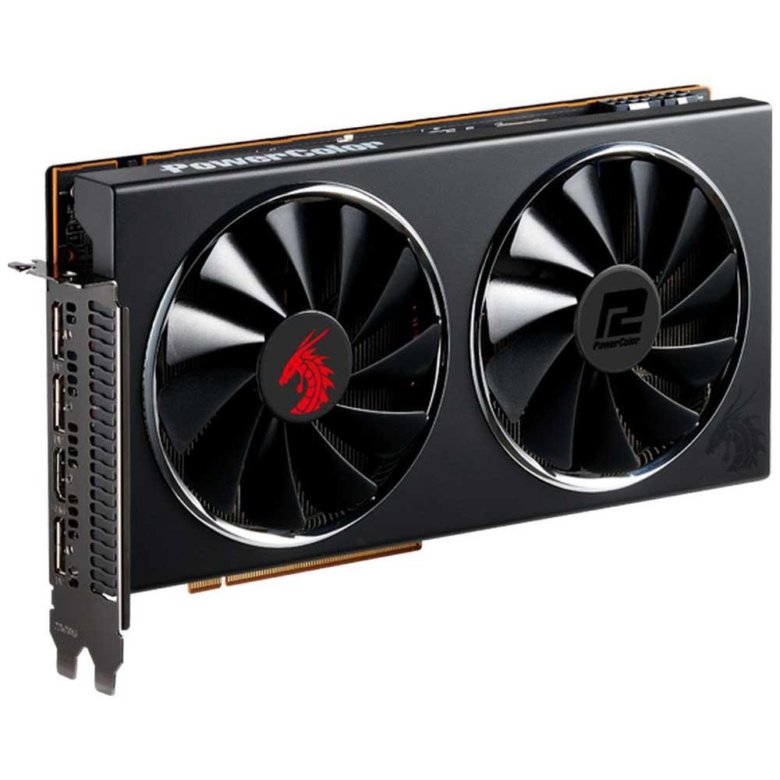 The rest is made of heatsink and plastic, as well as a 3-fan design. nine0003
Compliance with the promised overview of the most important features
| Length (outer edge slot panel to card end) | 30.0 cm |
| Installation height (top edge of PCIe slot to top of card) | 12.5 cm |
| Installation depth in front (cooler structure towards the bottom of the board) | 4.57cm |
| Mounting depth at the back (board outside the back panel) | 0.5 cm |
| Weight | 1248 g |
| Cold cap | Anthracite ABS injection molding LED (logo, strips of light) |
| Outlets | 3x DisplayPort 1.4 1x HDMI 2.0 |
| Specifications | Dual BIOS with Silet mode |
GPU-i gives us the first overview of other technical data:
The table gives a good overview of the remaining technical data of current and old comparison models:
| Map | AMD Radeon RX 5700 XT |
Powercolor RX 5700 XT Red DEvil |
AMD Radeon Vega 64 |
AMD Radeon RX 5700 |
AMD Radeon Vega 56 |
| Architecture (GPU) | Navi 10 | Navi 10 | Vega 10 | Navi 10 | Vega 10 |
| CUDA Cores / SP | 2560 | 2560 | 4096 | 2304 | 3584 |
| (40 CU) | (40CU) | (64CU) | (36CU) | (56 CUBE) | |
| Texture blocks | 160 | 256 | 144 | 224 | |
| Texture fill factor (Gtexels/s) | 304. 8 8 |
326.2 | 395.8 | 248.4 | 330 |
| Master clock (MHz) | 1605 | 1419 | 1274 | 1465 | 1156 |
| Clock acceleration (MHz) | 1755 (typical) 1905 (max.) |
2039 (maximum) | 1546 | 1625 (typical) 1725 (maximum) |
1471 |
| Memory | 8 GB GDDR6 14 Gbps |
8 GB GDDR6 14 Gbps |
8 GB HBM | 8 GB GDDR6 14 Gbps |
8 GB HBM |
| Bus width (bit) | 256 | 256 | 2048 | 256 | 2048 |
| Memory bandwidth (GB/s) | 448 | 448 | 483.8 | 448 | 410 |
| Rop | 64 | 64 | 64 | 64 | 64 |
| L2 cache | 4MB | 4MB | 4MB | 4MB | 4MB |
| TGP/TBP | 225 W | 250 W | 295 W | 185 W | 210 W |
Billion.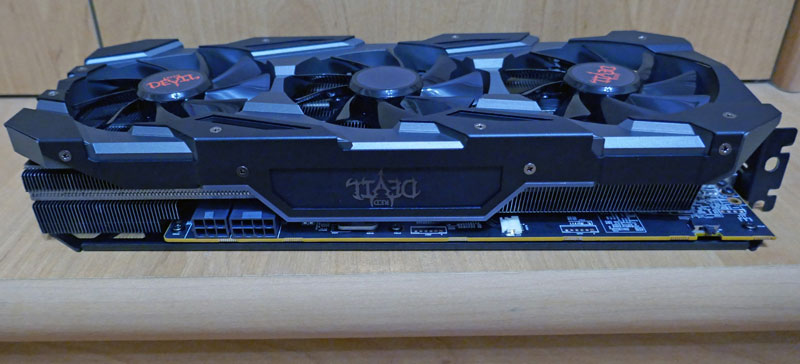 Transistors Transistors |
10.3 | 10.3 | 12.5 | 10.3 | 12.5 |
| Area (mm2) | 251 | 251 | 495 | 251 | 486 |
| Knot | 7 nm | 7 nm | 14 nm | 7 nm | 14 nm |
| Multi GPU | DX12/Vulkan | DX12/Vulkan | Cf | DX12/Vulkan | Cf |
Test system and measurement methods
The test system and methodology is well known, but since I am now testing myself here in Germany, the test system has also been upgraded once again without taking into account former American colleagues. nine0003
Summary in spreadsheet form provides a quick overview for interested parties:
| Test systems and measurement rooms | |
|---|---|
| Equipment: |
Intel Core i9-9900 KF MSI MEG Q390 ACE 2x 8GB KFA2 HoF DDR4 4000 1x 1TByte Patriot Viper (NVMe SSD system) 1x Seagate FastSSD Portable USB-C Seasonal Prime 1200W Titanium Power |
| Coolers: |
Alphacool Ice Block XPX 5x Be quiet! Silent Wings 3 PWM (Closed Body Modeling) Thermal Grizzly Cryono (for colder changes) |
| Housing: |
Lian Li PC-T70 with kit and modifications Modes: Open bench, closed case |
| Monitor: | Eizo EV3237-BK |
| Power consumption: |
non-contact DC current measurement on PCIe slot (Riser Card) non-contact DC current measurement on external PCIe power supply direct voltage measurement on appropriate feeders and power supply 2x Rohde and Black HMO 3054, 500 MHz multichannel oscilloscope with memory function 4x Rohde and Schwartz H’50, current adapter pliers (1 mA to 30 A, 100 kHz, DC) 4x Rohde and Schwartz H’355, probe splitter (10:1, 500 MHz) 1x Rohde and Schwartz HMC 8012, digital multimeter with memory function |
| Thermographs: |
1x Optris PI640, 2x Xi400 infrared cameras Pix Connect evaluation software with profiles |
| Speakers: |
NTI Audio M2211 (with calibration file) Steinberg UR12 (with phantom power for microphones) Creative X7, Smaart v.  7 ) 7 ) Axial measurements, perpendicular to the center of the sound source(s), measuring a distance of 50 cm Noise in dBA (slow) as RTA measurement Frequency spectrum as graphic |
| Operating system | Windows 10 Pro (1903, all updates), drivers up to date |

 As far as we know, this design is very Efectivo and is much better than what XFX has offered in the past.


 That’s also more than the RTX 500 Super’s MSRP of $2,070, but it’s cheaper than the RTX 2080 Super, which starts at $700.
 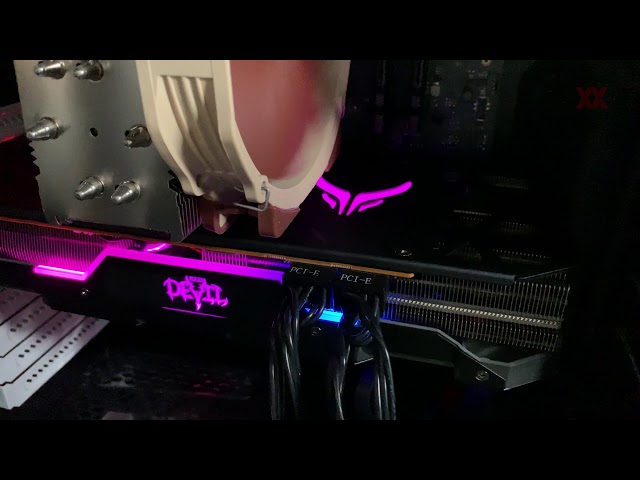 If you want to make sure that the card you receive fits in its case, there are two main parameters to consider: long y el
 nine0549
 case fans. These coolers can use anywhere from one to three fans, but RX 5700 XT models usually come with two or three. nine0003
 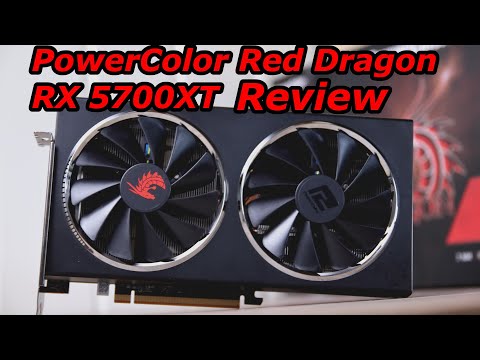 nine0003
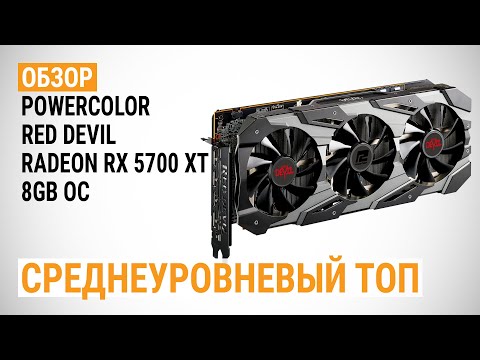
 However, in practice they protect the PCB by preventing it from bending. They also make it easy to remove dust from the back of the card, which is always handy.