Core 2 Duo T7200 [in 4 benchmarks]
Intel
Core 2 Duo T7200
Buy
- Interface
- Core clock speed
- Max video memory
- Memory type
- Memory clock speed
- Maximum resolution
Summary
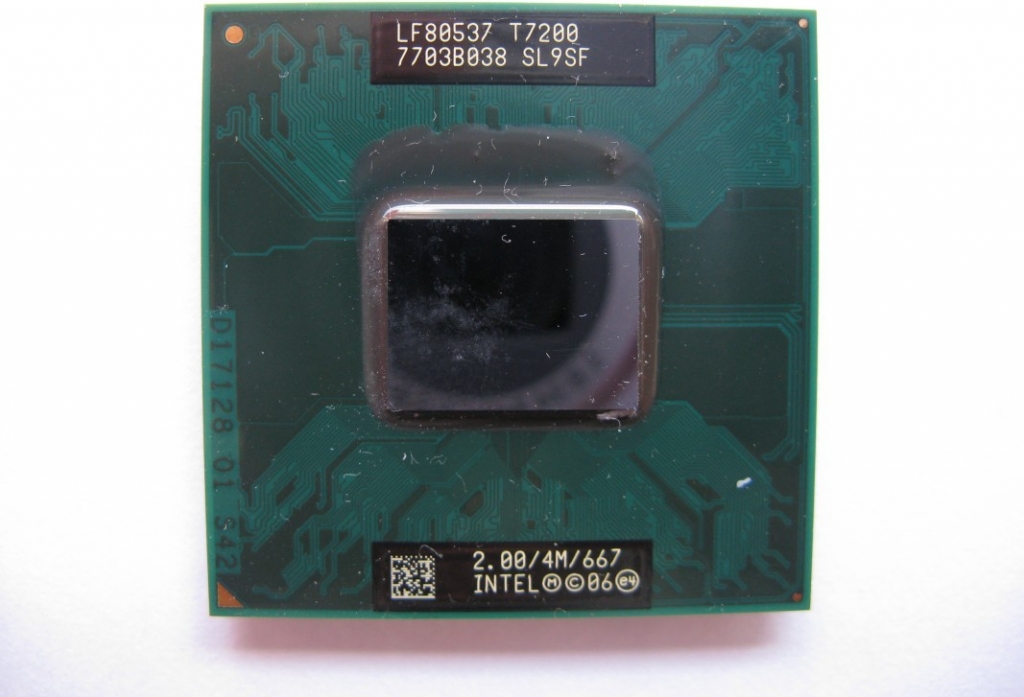
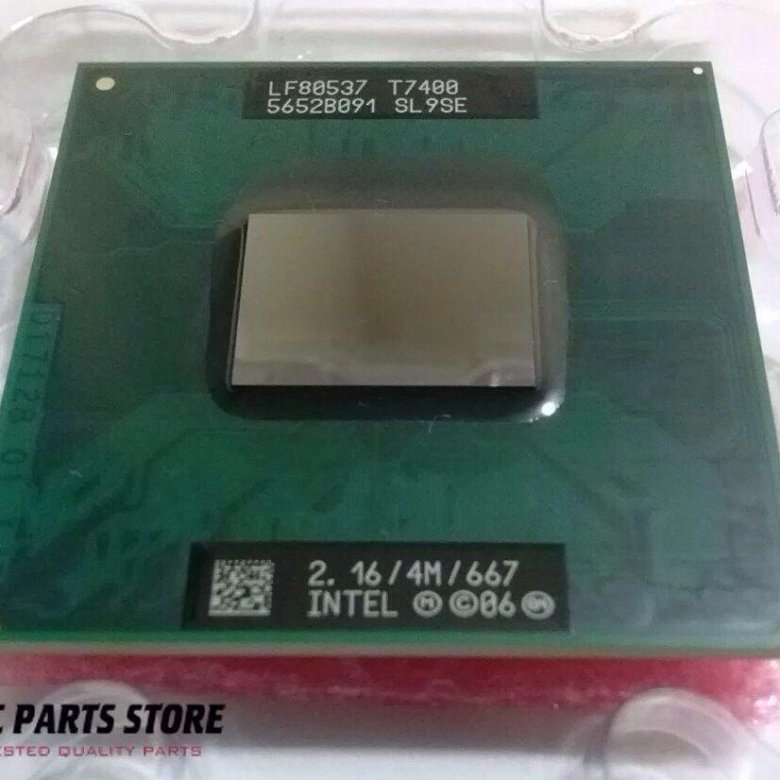
Intel started Intel Core 2 Duo T7200 sales 28 July 2006 at a recommended price of $286. This is a Merom architecture notebook processor primarily aimed at office systems. It has 2 cores and 2 threads, and is based on 65 nm manufacturing technology, with a maximum frequency of 2000 MHz and a locked multiplier.
Compatibility-wise, this is PPGA478, PBGA479 processor with a TDP of 34 Watt.
It provides poor benchmark performance at
0.59%
of a leader’s which is AMD EPYC 9654.
EPYC
9654
Compare
General info
Core 2 Duo T7200 processor market type (desktop or notebook), architecture, sales start time and pricing.
| Place in performance rating | 2531 | |
| Market segment | Laptop | |
| Series | Intel Core 2 Duo | |
| Architecture codename | Merom (2006−2008) | |
| Release date | 28 July 2006 (16 years old) | |
| Launch price (MSRP) | $286 | of 305 (Core i7-870) |
| Current price | $38 (0.1x MSRP) | of 25332 (Xeon Platinum 8276L) |
Technical specs
Basic microprocessor parameters such as number of cores, number of threads, base frequency and turbo boost clock, lithography, cache size and multiplier lock state. These parameters can generally indicate CPU performance, but to be more precise you have to review its test results.
| Physical cores | 2 (Dual-core) | |
| Threads | 2 | |
| Base clock speed | 2 GHz | of 4.7 (FX-9590) |
| Boost clock speed | 2 GHz | of 6 (Core i9-13900KS) |
| Bus support | 667 MHz | |
| L1 cache | 64 KB | of 7475.2 (Apple M2 Pro 10-Core) |
| L2 cache | 4 MB | of 36 (Apple M2 Max) |
| L3 cache | 0 KB | of 786432 (EPYC 7373X) |
| Chip lithography | 65 nm | of 4 (Ryzen 9 7940HS) |
| Die size | 143 mm2 | |
| Maximum core temperature | 100 °C | of 110 (Atom x7-E3950) |
| Number of transistors | 291 Million | of 9900000 (Ryzen 5 7645HX) |
| 64 bit support | + | |
| Windows 11 compatibility | — | |
| Unlocked multiplier | — | |
| VID voltage range | 1. 0375V-1.3V 0375V-1.3V |
Compatibility
Information on Core 2 Duo T7200 compatibility with other computer components and devices: motherboard (look for socket type), power supply unit (look for power consumption) etc. Useful when planning a future computer configuration or upgrading an existing one.
Note that power consumption of some processors can well exceed their nominal TDP, even without overclocking. Some can even double their declared thermals given that the motherboard allows to tune the CPU power parameters.
| Number of CPUs in a configuration | 1 | of 8 (Opteron 842) |
| Socket | PPGA478, PBGA479 | |
| Thermal design power (TDP) | 34 Watt | of 400 (Xeon Platinum 9282) |
Technologies and extensions
Technological capabilities and additional instructions supported by Core 2 Duo T7200. You’ll probably need this information if you require some particular technology.
| Enhanced SpeedStep (EIST) | + | |
| Enhanced SpeedStep (EIST) | + | |
| Turbo Boost Technology | — | |
| Hyper-Threading Technology | — | |
| Idle States | — | |
| Demand Based Switching | — | |
| FSB parity | — |
Security technologies
Processor technologies aimed at improving security, for example, by protecting against hacks.
| TXT | — | |
| EDB | + |
Virtualization technologies
Supported virtual machine optimization technologies. Some are specific to Intel only, some to AMD.
Benchmark performance
Single-core and multi-core benchmark results of Core 2 Duo T7200. Overall benchmark performance is measured in points in 0-100 range, higher is better.
Overall score
This is our combined benchmark performance rating. We are regularly improving our combining algorithms, but if you find some perceived inconsistencies, feel free to speak up in comments section, we usually fix problems quickly.
Core 2 Duo T7200
0.59
- Passmark
- GeekBench 5 Single-Core
- GeekBench 5 Multi-Core
- 3DMark06 CPU
Passmark
Passmark CPU Mark is a widespread benchmark, consisting of 8 different types of workload, including integer and floating point math, extended instructions, compression, encryption and physics calculation. There is also one separate single-threaded scenario measuring single-core performance.
Benchmark coverage: 67%
Core 2 Duo T7200
727
GeekBench 5 Single-Core
GeekBench 5 Single-Core is a cross-platform application developed in the form of CPU tests that independently recreate certain real-world tasks with which to accurately measure performance. This version uses only a single CPU core.
Benchmark coverage: 37%
Core 2 Duo T7200
249
GeekBench 5 Multi-Core
GeekBench 5 Multi-Core is a cross-platform application developed in the form of CPU tests that independently recreate certain real-world tasks with which to accurately measure performance. This version uses all available CPU cores.
Benchmark coverage: 37%
Core 2 Duo T7200
429
3DMark06 CPU
3DMark06 is a discontinued DirectX 9 benchmark suite from Futuremark. Its CPU part contains two scenarios, one dedicated to artificial intelligence pathfinding, another to game physics using PhysX package.
Benchmark coverage: 19%
Core 2 Duo T7200
1717
Relative perfomance
Overall Core 2 Duo T7200 performance compared to nearest competitors among notebook CPUs.
AMD Turion X2 Ultra ZM-84
100
Intel Celeron 2961Y
100
AMD Turion X2 Ultra ZM-80
100
Intel Core 2 Duo T7200
100
Intel Core 2 Duo T6500
100
Intel Core i3-380UM
100
VIA Nano QuadCore L4700
100
AMD equivalent
We believe that the nearest equivalent to Core 2 Duo T7200 by AMD is Turion X2 Ultra ZM-84, which is nearly equal in speed and higher by 5 positions in our rating.
Turion X2
Ultra ZM-84
Compare
Here are some closest AMD rivals to Core 2 Duo T7200:
AMD A4-3330MX
103.39
AMD Turion X2 Ultra ZM-84
100
AMD Turion X2 Ultra ZM-80
100
Intel Core 2 Duo T7200
100
AMD Turion X2 Ultra ZM-82
98.31
AMD Athlon II M320
98.31
AMD Turion 64 X2 TL-60
98.31
Similar processors
Here is our recommendation of several processors that are more or less close in performance to the one reviewed.
Turion X2
Ultra ZM-84
Compare
Core 2
Duo T6500
Compare
Core 2
Duo T8100
Compare
Turion 64
X2 TL-60
Compare
Pentium
T4200
Compare
Core 2
Duo T6570
Compare
Recommended GPUs
People consider these graphics cards to be good for Core 2 Duo T7200, according to our PC configuration statistics.
GeForce Go
7400
8.4%
Mobility
Radeon X1400
8.4%
Radeon
Xpress 200M
5.9%
GMA
950
4.2%
GeForce Go
7600
4.2%
GeForce Go
7300
3.4%
Mobility
Radeon X1600
2.5%
Radeon
X1600
2. 5%
5%
GeForce GTX
660
2.5%
Mobility
Radeon X1700
2.5%
These are the fastest graphics cards for Core 2 Duo T7200 in our user configuration statistics.
There is a total of 119 configurations based on Core 2 Duo T7200 in our database.
GeForce RTX
4090
0.8% (1/119)
GeForce GTX
1660 Ti Mobile
0.8% (1/119)
Radeon RX
480
0.8% (1/119)
GeForce GTX
1050 Ti
1. 7% (2/119)
GeForce GTX
770
0.8% (1/119)
GeForce GTX
950
1.7% (2/119)
GeForce GTX
660
2.5% (3/119)
GeForce GTX
460
0.8% (1/119)
GeForce
945M
0.8% (1/119)
GeForce GTX
650
0.8% (1/119)
User rating
Here is the rating given to the reviewed processor by our users. Let others know your opinion by rating it yourself.
Questions and comments
Here you can ask a question about Core 2 Duo T7200, agree or disagree with our judgements, or report an error or mismatch.
Please enable JavaScript to view the comments powered by Disqus.
Intel Core 2 Duo T7200 Processor Benchmarks and Specs
|
|
|
|
|
Intel Core 2 Duo T7200 Processor Benchmarks and Specs
Specifications of the Intel Core 2 Duo T7200 processor dedicated to the mid-range laptop sector, it has 2 cores, 2 threads, a maximum frequency of 2,0GHz. The table below makes it possible to observe well the lithography, the number of transistors (if present), the offered cache memory, the maximum capacity of RAM memory that we can get, the type of compatible memory, the release date, the maximum number of PCIe lanes, the values obtained in the Passmark platform, Cinebench R23 and Geekbench 5.
Note: Commissions may be earned from the link above.
This page contains references to products from one or more of our advertisers. We may receive compensation when you click on links to those products. For an explanation of our advertising policy, please visit this page.
Specifications:
| Processor | Intel Core 2 Duo T7200 | |||
| Market (main) | Mid-range laptop | |||
| ISA | x86-64 (64 bit) | |||
| Microarchitecture | Core | |||
| Core name | Merom | |||
| Family | Core 2 Duo 7000 | |||
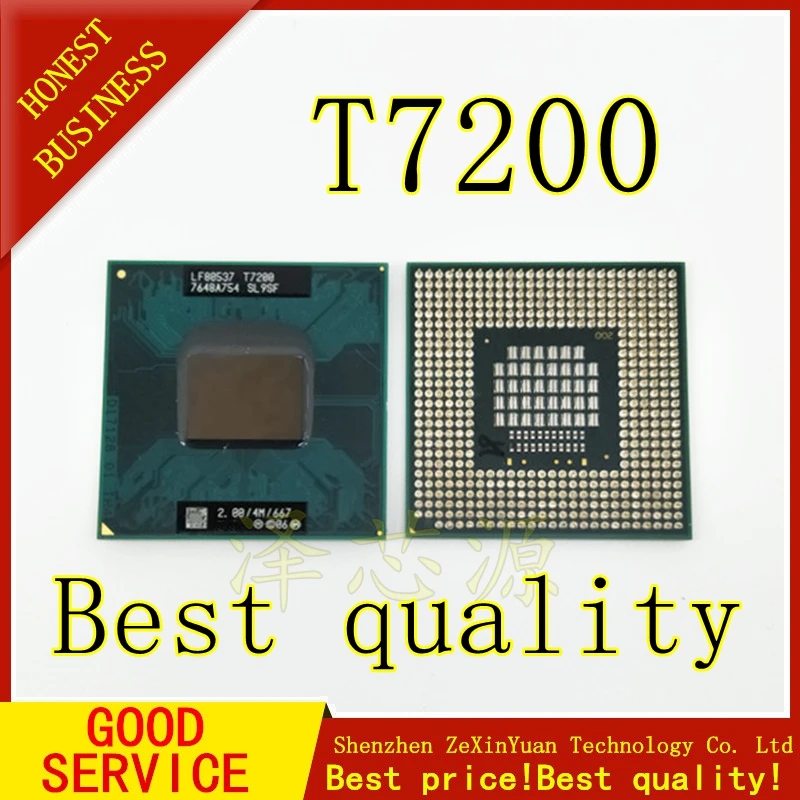
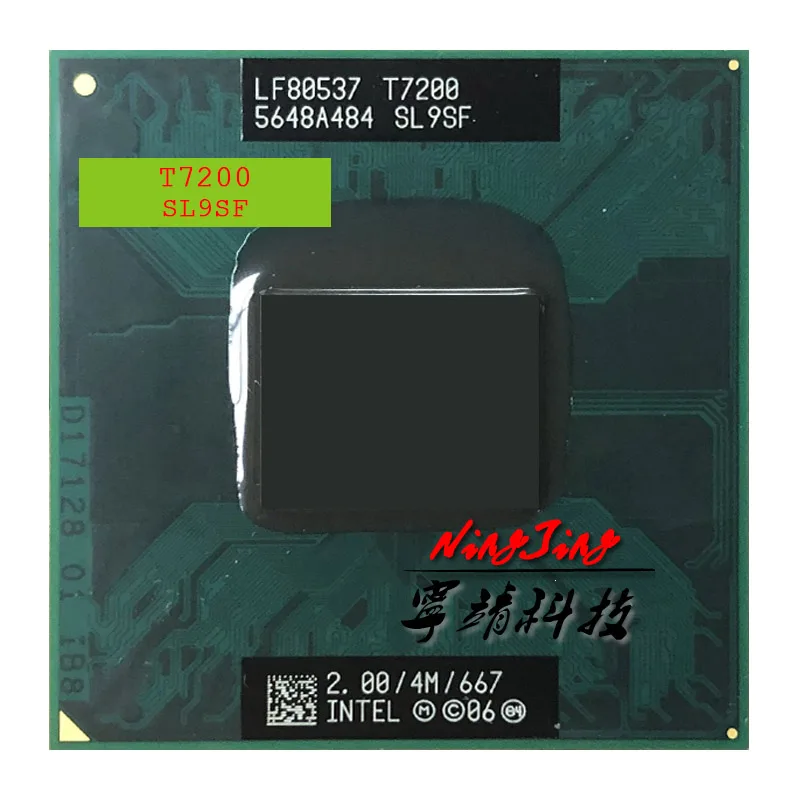
| Part number(s), S-Spec |
BX80537T7200, |
|||
| Release date | Q3 2006 | |||
| Lithography | 65 nm | |||
| Transistors | 291. 000.000 000.000 |
|||
| Cores | 2 | |||
| Threads | 2 | |||
| Frequency | 2,0 GHz | |||
| Bus speed | 0,667 GT/s | |||
| Cache memory | 4 MB | |||
| Max memory capacity | 4 GB | |||
| Memory types |
DDR2-666 |
|||
| TDP | 34 W | |||
| GPU integrated graphics | None | |||
| Socket | PGA478, BGA479 | |||
| Maximum temperature | 100°C | |||
| Security |
Execute Disable Bit |
|||
| CPU-Z single thread | 160 | |||
| CPU-Z multi thread | 332 | |||
| Cinebench R15 single thread | 46 | |||
| Cinebench R15 multi-thread | 95 | |||
| Cinebench R20 single thread | 103 | |||
| Cinebench R20 multi-thread | 214 | |||
| PassMark single thread | 744 | |||
| PassMark CPU Mark | 742 | |||
| (Windows 64-bit) Geekbench 4 single core |
1. 218 218 |
|||
| (Windows 64-bit) Geekbench 4 multi-core |
2.038 | |||
| (Windows) Geekbench 5 single core |
280 | |||
| (Windows) Geekbench 5 multi-core |
494 | |||
| (SGEMM) GFLOPS performance |
15,5 GFLOPS | |||
| (Multi-core / watt performance) Performance / watt ratio |
60 pts / W | |||
| Amazon | ||||
| eBay |
Note: Commissions may be earned from the links above.
Performance with the benchmarks:
Performance comparison between this processor and those of equivalent power, for this we consider the results generated on benchmark softwares such as Geekbench 4.
Price: For technical reasons, we cannot currently display a price less than 24 hours, or a real-time price. This is why we prefer for the moment not to show a price. You should refer to the respective online stores for the latest price, as well as availability.
Performance comparison on the CPU-Z benchmark software for IT processors:
| CPU-Z — Multi-thread & single thread score | |
|---|---|
|
Intel Celeron N4020 |
206 418 |
|
AMD Ryzen 3 3200U |
134 402 |
|
Intel Celeron 3867U |
194 389 |
|
Intel Celeron 4205U |
191 384 |
|
Intel Celeron 4305U |
206 383 |
|
Intel Core 2 Duo T7200 |
160 332 |
|
AMD PRO A6-7350B |
179 316 |
|
AMD A6-9225 |
185 307 |
|
AMD A4-9125 |
142 265 |
|
AMD A6-9220e |
139 233 |
Note: Commissions may be earned from the links above. These scores are only an
average of the performances got with these processors, you may get different results.
CPU-Z is a system information software that provides the name of the processor, its model number, the codename, the cache levels, the package, the process. It can also gives data about the mainboard, the memory. It makes real time measurement, with finally a benchmark for the single thread, as well as for the multi thread.
Performance comparison on the Cinebench R15 benchmark platform for IT devices:
| Cinebench R15 — Multi-thread & single thread score | |
|---|---|
|
Intel Celeron 4205U |
73 138 |
|
Intel Celeron 3867U |
68 127 |
|
AMD A6-9225 |
70 110 |
|
AMD A4-9125 |
60 100 |
|
Intel Core 2 Duo T7200 |
46 95 |
|
AMD A9-9420e |
51 95 |
|
AMD A6-9220e |
37 73 |
|
AMD A4-9120e |
24 46 |
Note: Commissions may be earned from the links above. These scores are only an
average of the performances got with these processors, you may get different results.
Cinebench R15 evaluates the performance of CPU calculations by restoring a photorealistic 3D scene. The scene has 2,000 objects, 300,000 polygons, uses sharp and fuzzy reflections, bright areas, shadows, procedural shaders, antialiasing, and so on. The faster the rendering of the scene is created, the more powerful the PC is, with a high number of points.
Performance comparison on the Cinebench R20 benchmark platform for computers:
| Cinebench R20 — Multi-thread & single thread score | |
|---|---|
|
Intel Celeron 4205U |
158 279 |
|
AMD A6-9225 |
180 270 |
|
AMD A4-9125 |
160 240 |
|
AMD A9-9420e |
136 229 |
|
Intel Pentium Gold 6405U |
200 220 |
|
Intel Core 2 Duo T7200 |
103 214 |
|
AMD A4-9120e |
66 110 |
|
AMD A6-9220e |
74 105 |
Note: Commissions may be earned from the links above.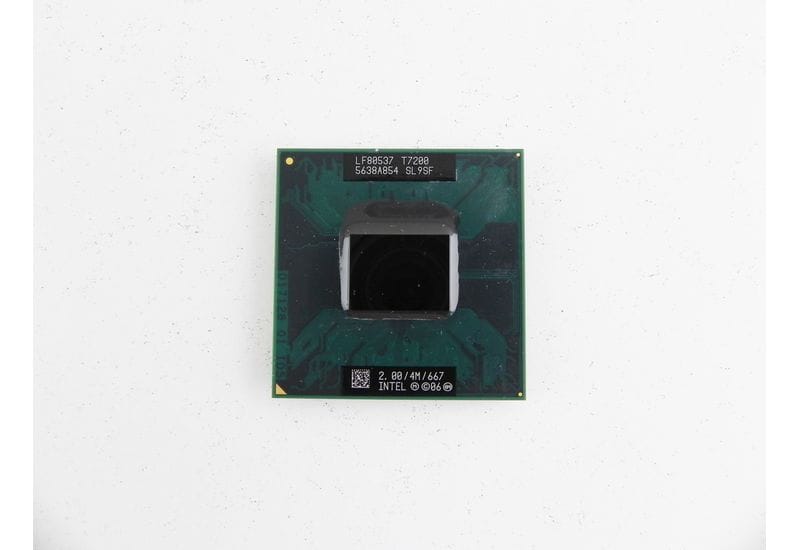 These scores are only an
average of the performances got with these processors, you may get different results.
Cinebench R20 is a multi-platform test software which allows to evaluate the hardware capacities of a device such as a computer, a tablet, a server. This version of Cinebench takes into account recent developments in processors with multiple cores and the latest improvements in rendering techniques. The evaluation is ultimately even more relevant.
Performance comparison on the Passmark benchmark platform for computing machines:
| PassMark — CPU Mark | |
|---|---|
|
AMD A4-9125 |
1.028 1.202 |
|
AMD A9-9420e |
990 1.128 |
|
AMD A6-9220e |
879 1.  098 098 |
|
AMD A4-9120e |
736 856 |
|
AMD A4-9120C |
821 755 |
|
Intel Core 2 Duo T7200 |
744 742 |
Note: Commissions may be earned from the links above. These scores are only an
average of the performances got with these processors, you may get different results.
PassMark is a benchmarking software that performs several performance tests including prime numbers, integers, floating point, compression, physics, extended instructions, encoding, sorting. The higher the score is, the higher is the device capacity.
On Windows: performance comparison in Geekbench 4 with Windows operating system.
| Geekbench 4 — Multi-core & single core score — Windows 64-bit | |
|---|---|
|
Intel Celeron N4020 |
1.  991 9913.426 |
|
AMD PRO A6-7350B |
2.228 3.219 |
|
AMD A6-9225 |
1.756 2.650 |
|
AMD A4-9125 |
1.560 2.393 |
|
AMD A9-9420e |
1.606 2.306 |
|
Intel Core 2 Duo T7200 |
1.218 2.038 |
|
AMD A4-9120C |
1.328 2.013 |
|
AMD A6-9220e |
1.351 1.951 |
|
AMD A4-9120e |
1.309 1.913 |
Note: Commissions may be earned from the links above. These scores are only an
average of the performances got with these processors, you may get different results.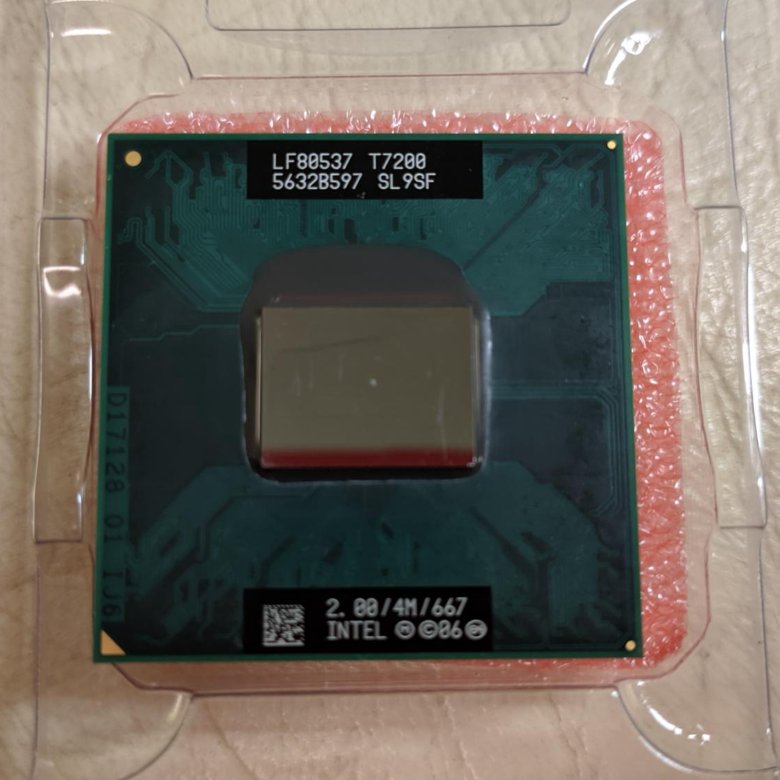
On Linux: performance comparison in Geekbench 4 with Linux operating system.
| Geekbench 4 — Multi-core & single core score — Linux 64-bit | |
|---|---|
|
Intel Core i3-7020U |
2.837 4.361 |
|
Intel Celeron N4120 |
1.918 3.913 |
|
AMD PRO A6-7350B |
2.306 3.517 |
|
AMD A6-9225 |
2.024 2.943 |
|
AMD A4-9120C |
1.695 2.437 |
|
Intel Core 2 Duo T7200 |
1.331 2.269 |
|
AMD A9-9420e |
1.656 2.262 |
|
AMD A6-9220e |
1.  538 5382.134 |
|
AMD A4-9125 |
1.430 1.513 |
Note: Commissions may be earned from the links above. These scores are only an
average of the performances got with these processors, you may get different results.
On MAC OS X: performance comparison in Geekbench 4 with MAC OS X operating system.
| Geekbench 4 — Multi-core & single core score — Mac OS X 64-bit | |
|---|---|
|
Intel Core i5-8210Y |
3.943 7.207 |
|
Intel Core i3-8130U |
3.423 6.517 |
|
Intel Core m3-8100Y |
3.731 6.148 |
|
Intel Core i7-8500Y |
4.  093 0936.058 |
|
Intel Core i3-7020U |
2.902 5.395 |
|
Intel Core 2 Duo T7200 |
1.312 2.229 |
Note: Commissions may be earned from the links above. These scores are only an
average of the performances got with these processors, you may get different results.
Geekbench 4 is a complete benchmark platform with several types of tests, including data compression, images, AES encryption, SQL encoding, HTML, PDF file rendering, matrix computation, Fast Fourier Transform, 3D object simulation, photo editing, memory testing. This allows us to better visualize the respective power of these devices. For each result, we took an average of 250 values on the famous benchmark software.
On Windows: performance comparison in Geekbench 5 with Windows operating system.
| Geekbench 5 — Multi-core & single core score — Windows | |
|---|---|
|
Intel Celeron 4205U |
423 814 |
|
Qualcomm Snapdragon 7c Gen 2 |
360 708 |
|
AMD PRO A6-7350B |
419 668 |
|
AMD A4-9125 |
308 518 |
|
AMD A6-9225 |
319 506 |
|
Intel Core 2 Duo T7200 |
280 494 |
|
AMD A9-9420e |
303 480 |
|
AMD A6-9220e |
268 427 |
|
AMD A4-9120e |
254 369 |
Note: Commissions may be earned from the links above.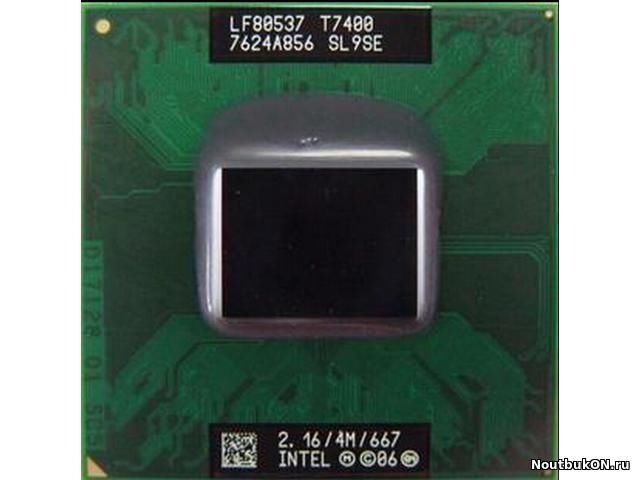 These scores are only an
average of the performances got with these processors, you may get different results.
On Linux: performance comparison in Geekbench 5 with Linux operating system.
| Geekbench 5 — Multi-core & single core score — Linux | |
|---|---|
|
Intel Celeron 3867U |
443 686 |
|
Intel Pentium Gold 4425Y |
430 637 |
|
AMD PRO A6-7350B |
121 630 |
|
AMD A9-9420e |
398 598 |
|
AMD A4-9120e |
356 566 |
|
Intel Core 2 Duo T7200 |
295 505 |
|
Intel Celeron 4205U |
369 498 |
|
AMD A6-9225 |
388 481 |
|
AMD A4-9125 |
361 473 |
|
AMD A6-9220e |
315 427 |
Note: Commissions may be earned from the links above. These scores are only an
average of the performances got with these processors, you may get different results.
On Android: performance comparison in Geekbench 5 with Android operating system.
| Geekbench 5 — Multi-core & single core score — Android | |
|---|---|
|
Intel Celeron N4020 |
469 867 |
|
Intel Celeron 5205U |
451 826 |
|
Intel Celeron 3867U |
424 809 |
|
AMD A4-9125 |
408 667 |
|
AMD A9-9420e |
381 483 |
|
Intel Core 2 Duo T7200 |
255 472 |
|
AMD A4-9120C |
269 412 |
|
AMD A6-9220e |
343 398 |
Note: Commissions may be earned from the links above. These scores are only an
average of the performances got with these processors, you may get different results.
Geekbench 5 is a software for measuring the performance of a computer system, for fixed devices, mobile devices, servers. This platform makes it possible to better compare the power of the CPU, the computing power and to compare it with similar or totally different systems. Geekbench 5 includes new workloads that represent work tasks and applications that we can find in reality.
List of comparisons:
AllwinnerAMDAMD A10AMD A12AMD A4AMD A6AMD A8AMD A9AMD AthlonAMD Athlon 64AMD Athlon 64 X2AMD Athlon GoldAMD Athlon IIAMD Athlon SilverAMD EPYCAMD FXAMD JaguarAMD OpteronAMD PhenomAMD RyzenAMD Ryzen 1000AMD Ryzen 2000AMD Ryzen 3AMD Ryzen 3 1000AMD Ryzen 3 2000AMD Ryzen 3 3000AMD Ryzen 3 4000AMD Ryzen 3 5000AMD Ryzen 3 MobileAMD Ryzen 3000AMD Ryzen 4000AMD Ryzen 5AMD Ryzen 5 1000AMD Ryzen 5 2000AMD Ryzen 5 3000AMD Ryzen 5 4000AMD Ryzen 5 5000AMD Ryzen 5 6000 MobileAMD Ryzen 5 7000AMD Ryzen 5 MobileAMD Ryzen 5000AMD Ryzen 6000 MobileAMD Ryzen 7AMD Ryzen 7 1000AMD Ryzen 7 2000AMD Ryzen 7 3000AMD Ryzen 7 4000AMD Ryzen 7 5000AMD Ryzen 7 6000 MobileAMD Ryzen 7 7000AMD Ryzen 7 MobileAMD Ryzen 7000AMD Ryzen 9AMD Ryzen 9 3000AMD Ryzen 9 4000AMD Ryzen 9 5000AMD Ryzen 9 6000 MobileAMD Ryzen 9 7000AMD Ryzen 9 MobileAMD Ryzen MobileAMD Ryzen ThreadripperAMD Ryzen Threadripper 1000AMD Ryzen Threadripper 2000AMD Ryzen Threadripper 3000AMD Ryzen Threadripper 5000AMD Ryzen Threadripper ProAMD ZenAMD Zen 2AMD Zen 3AMD Zen+AmlogicAppleARMARM CortexARM Cortex-A15ARM Cortex-A17ARM Cortex-A35ARM Cortex-A5ARM Cortex-A53ARM Cortex-A55ARM Cortex-A57ARM Cortex-A7ARM Cortex-A72ARM Cortex-A73ARM Cortex-A75ARM Cortex-A76ARM Cortex-A77ARM Cortex-A78ARM Cortex-A8ARM Cortex-A9ARM Cortex-X1ARM920TAutoChipsBroadcomDeca coreDodeca coreDual AMDDual AMD EPYCDual AMD OpteronDual coreDual Intel XeonDual Intel Xeon E5Dual Intel Xeon PlatinumHexa coreHexadeca coreHiSiliconHiSilicon KirinIBMIBM POWERIBM POWER10IBM POWER9Icosi coreIngenicIntelIntel Alder LakeIntel Amber LakeIntel Apollo LakeIntel AtomIntel Bay TrailIntel BraswellIntel BroadwellIntel Cascade LakeIntel Cascade Lake-XIntel CeleronIntel Celeron NIntel Coffee LakeIntel Comet LakeIntel CoreIntel Core 1000Intel Core 10000Intel Core 1100Intel Core 11000Intel Core 1200Intel Core 12000Intel Core 12000 MobileIntel Core 13000Intel Core 2Intel Core 2 DuoIntel Core 2 QuadIntel Core 2000Intel Core 3000Intel Core 4000Intel Core 5000Intel Core 6000Intel Core 7000Intel Core 8000Intel Core 9000Intel Core DuoIntel Core iIntel Core i3Intel Core i3-1000Intel Core i3-10000Intel Core i3-1100Intel Core i3-11000Intel Core i3-1200Intel Core i3-12000Intel Core i3-13000Intel Core i3-2000Intel Core i3-3000Intel Core i3-4000Intel Core i3-5000Intel Core i3-6000Intel Core i3-7000Intel Core i3-8000Intel Core i3-9000Intel Core i5Intel Core i5-1000Intel Core i5-10000Intel Core i5-1100Intel Core i5-11000Intel Core i5-1200Intel Core i5-12000Intel Core i5-12000 MobileIntel Core i5-13000Intel Core i5-2000Intel Core i5-3000Intel Core i5-4000Intel Core i5-5000Intel Core i5-6000Intel Core i5-7000Intel Core i5-8000Intel Core i5-9000Intel Core i7Intel Core i7 mobile quad coreIntel Core i7 quad coreIntel Core i7-1000Intel Core i7-10000Intel Core i7-1100Intel Core i7-11000Intel Core i7-1200Intel Core i7-12000Intel Core i7-12000 MobileIntel Core i7-13000Intel Core i7-2000Intel Core i7-3000Intel Core i7-4000Intel Core i7-5000Intel Core i7-6000Intel Core i7-6000KIntel Core i7-7000Intel Core i7-7000KIntel Core i7-8000Intel Core i7-9000Intel Core i9Intel Core i9-10000Intel Core i9-11000Intel Core i9-12000Intel Core i9-12000 MobileIntel Core i9-12000KIntel Core i9-13000Intel Core i9-13000KIntel Core i9-7000Intel Core i9-8000Intel Core i9-9000Intel Core mIntel Core m3Intel Core m5Intel Core XIntel deca coreIntel dual coreIntel Gemini LakeIntel HaswellIntel hexa coreIntel Ice LakeIntel Ivy BridgeIntel Kaby LakeIntel LGA1150Intel LGA1151Intel LGA1200Intel LGA1700Intel LGA775Intel octa coreIntel PentiumIntel Pentium 4Intel Pentium dual coreIntel Pentium GoldIntel Pentium IIIntel Pentium IIIIntel Pentium quad coreIntel Pentium SilverIntel quad coreIntel Raptor LakeIntel Rocket LakeIntel Sandy BridgeIntel SkylakeIntel Skylake-XIntel Tiger LakeIntel XeonIntel Xeon BronzeIntel Xeon E3Intel Xeon E5Intel Xeon GoldIntel Xeon PlatinumIntel Xeon WJLQMarvellMediaTekMediaTek DimensityMediaTek Helio GMediaTek Helio PMicrosoftMono coreNvidiaNvidia TegraNXPNXP i. MXNXP i.MX 8NXP i.MX 8MNXP i.MX 8XOcta coreOcta Intel XeonOctodeca coreQuad coreQuad Intel XeonQualcommQualcomm Kryo 260Qualcomm Kryo 468Qualcomm Kryo 585Qualcomm Kryo 670Qualcomm SnapdragonQualcomm Snapdragon 700Qualcomm Snapdragon 8Qualcomm Snapdragon 800 seriesRealtekRockchipSamsungSamsung ExynosSamsung Exynos 7Samsung Exynos 7 OctaSamsung Exynos 9Samsung Exynos 9 OctaSonyTessaradeca coreTexas InstrumentsUnisocUnisoc TigerXiaomiProcessors groups
List of benchmarks:
CPU-ZCinebench R15Cinebench R20Geekbench 4 on LinuxGeekbench 4 on Mac OS XGeekbench 4 on WindowsGeekbench 5 on AndroidGeekbench 5 on LinuxGeekbench 5 on WindowsPassMarkGFLOPS performance
Equivalence:
Intel Core 2 Duo T7200 AMD equivalent
Core 2 Duo T7200 [in 4 benchmarks]
Intel
Core 2 Duo T7200
- Interface
- Core frequency
- Video memory size
- Memory type
- Memory frequency
- Maximum resolution
Description
Intel launched the Intel Core 2 Duo T7200 on July 28, 2006 at a suggested retail price of $286.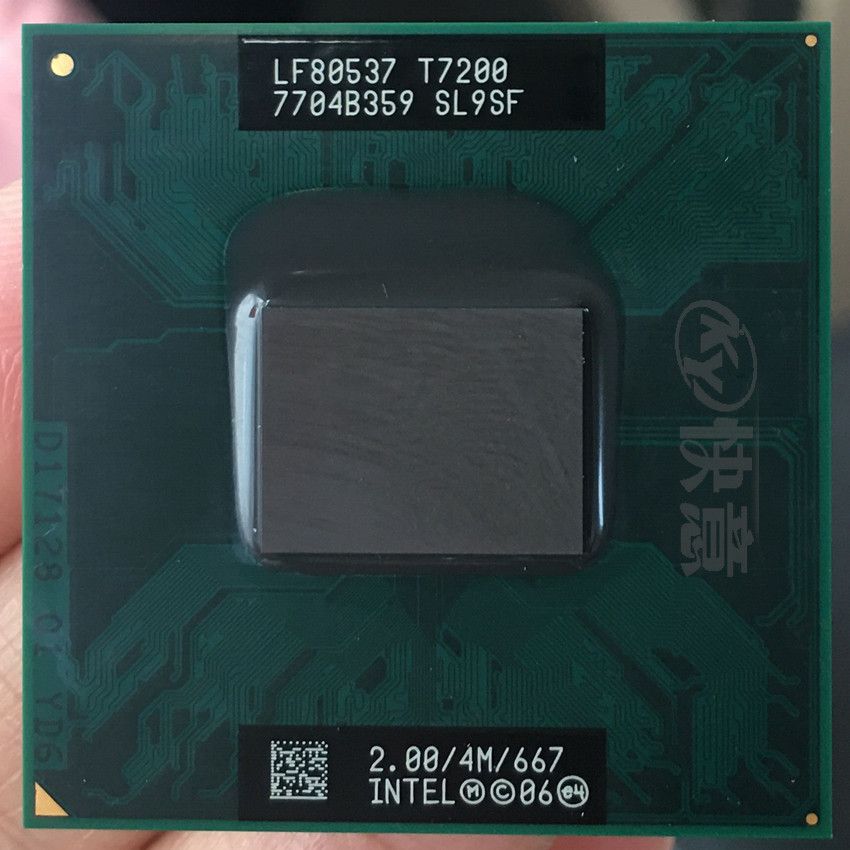 This is a notebook processor based on the Merom architecture, primarily designed for office systems. It has 2 cores and 2 threads and is manufactured using 65 nm process technology, the maximum frequency is 2000 MHz, the multiplier is locked.
In terms of compatibility, this is a processor for socket PPGA478, PBGA479 with a TDP of 34W.
It provides poor benchmark performance at
0.59%
from the leader which is AMD EPYC 9654.
EPYC
9654
Compare
General information
Information about the type (desktop or laptop) and architecture of the Core 2 Duo T7200, as well as when sales started and cost at the time.
9005 900 94
38 $ (0. 1 (Xeon Platinum 8276L)
Features
Core 2 Duo T7200 quantitative parameters such as number of cores and threads, clock speeds, manufacturing process, cache size and multiplier lock state. They indirectly speak about the performance of the processor, but for an accurate assessment, you need to consider the results of the tests.
9004 9004 9005 36 (Apple M2 MAX)
9004
Ryzen
| Enhanced SpeedStep (EIST) | + | |
| Enhanced SpeedStep (EIST) | + | |
| Turbo Boost Technology | — | |
| Hyper-Threading Technology | — | |
| 0055 | ||
| Demand Based Switching | — | |
| Plains FSB | —
| 9005 | |
| TXT | — | |
| EDB | + |
Virtualization technologies
Technologies supported by Core 2 Duo T7200 that speed up virtual machines are listed.
Benchmark tests
These are the results of Core 2 Duo T7200 performance tests in non-gaming benchmarks. The overall score is set from 0 to 100, where 100 corresponds to the fastest processor at the moment.
Overall test performance
This is our overall performance rating. We regularly improve our algorithms, but if you find any inconsistencies, feel free to speak up in the comments section, we usually fix problems quickly.
Core 2 Duo T7200
0.59
- Passmark
- GeekBench 5 Single-Core
- GeekBench 5 Multi-Core
- 3DMark06 CPU
Passmark
Passmark CPU Mark is a widely used benchmark that consists of 8 different tests, including integer and floating point calculations, extended instruction tests, compression, encryption, and game physics calculations.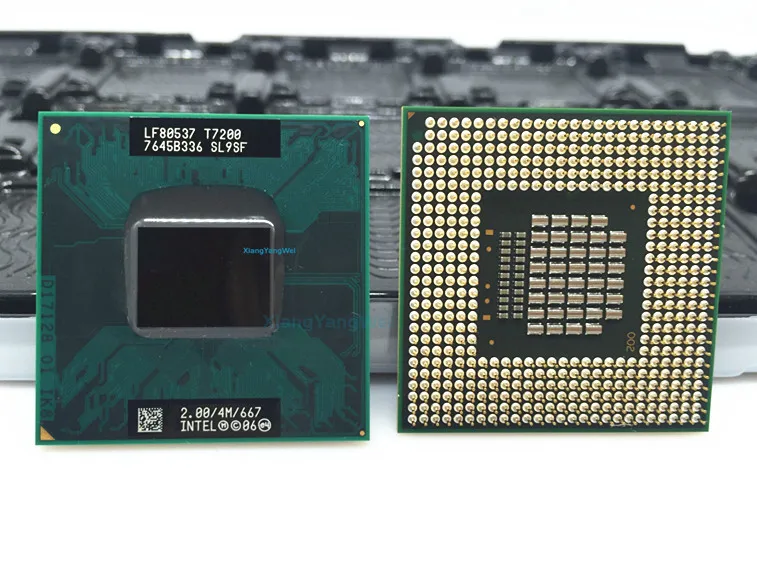 Also includes a separate single-threaded test.
Benchmark coverage: 67%
Core 2 Duo T7200
727
GeekBench 5 Single Core
GeekBench 5 Single-Core is a cross-platform application designed as CPU benchmarks that independently recreate certain real-world tasks that can be used to accurately measure performance. This version uses only one processor core.
Benchmark coverage: 37%
Core 2 Duo T7200
249
GeekBench 5 Multi-Core
GeekBench 5 Multi-Core is a cross-platform application designed as CPU benchmarks that independently recreate certain real world tasks that can accurately measure performance. This version uses all available processor cores.
Benchmark coverage: 37%
Core 2 Duo T7200
429
3DMark06 CPU
3DMark06 is an outdated set of benchmarks based on DirectX 9 by Futuremark. Its processor part contains two tests, one of which calculates the pathfinding of game AI, the other emulates game physics using the PhysX package.
Benchmark coverage: 19%
Core 2 Duo T7200
1717
Relative capacity
Overall performance of the Core 2 Duo T7200 compared to its nearest competitor in notebook processors.
AMD Turion X2 Ultra ZM-84
100
Intel Celeron 2961Y
100
AMD Turion X2 Ultra ZM-80
100
Intel Core 2 Duo T7200
100
Intel Core 2 Duo T6500
100
Intel Core i3-380UM
100
VIA Nano QuadCore L4700
100
Competitor from AMD
We believe that the nearest equivalent to Core 2 Duo T7200 from AMD is Turion X2 Ultra ZM-84, which is approximately equal in speed and is 5 positions higher in our rating.
Turion X2
Ultra ZM-84
Compare
Here are some of AMD’s closest competitors to the Core 2 Duo T7200:
AMD A4-3330MX
103. 39
39
AMD Turion X2 Ultra ZM-84
100
AMD Turion X2 Ultra ZM-80
100
Intel Core 2 Duo T7200
100
AMD Turion X2 Ultra ZM-82
98.31
AMD Athlon II M320
98.31
AMD Turion 64 X2 TL-60
98.31
Other processors
Here we recommend several processors that are more or less similar in performance to the reviewed one.
Core 2
Duo T6500
Compare
Turion X2
Ultra ZM-84
Compare
Turion X2
RM-74
Compare
Core 2
Duo T6570
Compare
Core 2
Duo T8100
Compare
Turion 64
X2 TL-60
Compare
Best graphics cards for Core 2 Duo T7200
We have 119 configurations based on Core 2 Duo T7200 in our database.
According to statistics, these cards are most often used with Core 2 Duo T7200:
GeForce Go
7400
8.4%
Mobility
Radeon X1400
8.4%
Radeon
Xpress 200M
5.9%
GMA
950
4.2%
GeForce Go
7600
4.2%
GeForce Go
7300
3.4%
Mobility
Radeon X1600
2.5%
Radeon
X1600
2.5%
GeForce GTX
660
2. 5%
5%
Mobility
Radeon X1700
2.5%
Here are the most powerful video cards used with Core 2 Duo T7200 according to user statistics:
GeForce RTX
4090
0.8% (1/119)
GeForce GTX
1660 Ti (mobile)
0.8% (1/119)
Radeon RX
480
0.8% (1/119)
GeForce GTX
1050 Ti
1.7% (2/119)
GeForce GTX
770
0.8% (1/119)
GeForce GTX
950
1.7% (2/119)
GeForce GTX
660
2.