Intel’s i7-3770K vs. the i7-3820
- Multi-channel RAM
- PCIe Lanes
- Performance
- Price
- Conclusion
- Comments
Bigger numbers are always better, right?
The 7970 is bigger than the 7870, and it is better. 8GB of RAM is bigger than 1GB, and it is better. Naturally, one would expect the i7-3820 to perform better than the i7-3770K, since it is also has a bigger number. Let us take a closer look.
Image: The contenders. Image courtesy of newegg
Why would the i7-3820 be considered better?
The i7-3820 supports quad-channel RAM, and has 40 PCIe lanes, meaning it can support 3 or even 4 graphics cards, and most importantly, it is expected to perform better while maintaining the same total platform price as the i7-3770K. The i7-3820 also has slightly more L3 cache and a higher clock speed, and can handle 64GB of RAM to the i7-3770’s 32GB. The i7-3820 can later be upgraded to an i7-3930K or i7-3960X, whereas the i7-3770K is the end of the line for its socket.
Is it really better?
Let us address the issues one by one.
Multi-channel RAM
First, quad-channel RAM. We have seen this before during the X58 days, but some people really think that having RAM in triple-channel (or quad-channel with X79) is going to make a significant difference in power/speed. It will not do so. Multi-channel RAM is intended to remove any RAM bottlenecks, and with modern DDR3 RAM, there is little to no bottleneck. Multi-channel RAM does not boost your CPU/GPU or anything else, it simply provides more bandwidth. If your RAM data transfer rates were not a bottleneck before, then using a multi-channel RAM configuration is not going to do anything.
You can see this in LegitReviews DDR3 X79 Performance Review, TweakTown’s X79 Memory Analysis, and Tom’s Hardware article on parallel processing. In real programs, dual-channel or quad-channel makes no difference. Even in most synthetic benchmarks you will see no meaningful difference, with the exception of SiSoft Sandra.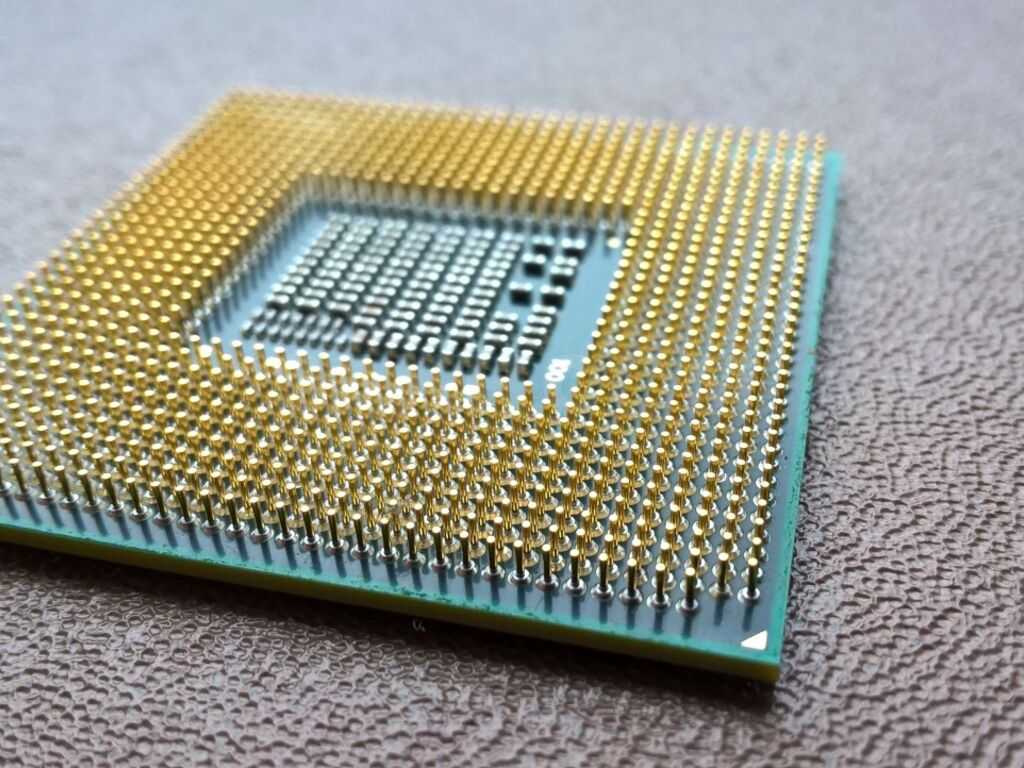 Unless you have a specific need for extreme memory bandwidth, you will see no difference from going to triple or quad channel.
Image: Little difference between dual and quad-channel RAM. Image courtesy ofLegitReviews
PCIe lanes
What about having more PCIe lanes? With your typical Z77 motherboards, you will be running one card on x16, or two cards at x8/x8. The exception is the very high-end motherboards with an extra chip that allows up to four cards. With the i7-3820, you can have 2 cards at x16/x16, or up to 4 cards at x8/x8/x8/x8. If you really need to have 3 or more graphics cards, then we agree that X79 is probably the way to go. However, as you can see Techpowerup’s GTX 680 SLI Review, Guru3D’s GTX 680 SLI review,TechPowerUp’s HD 7970 CrossFire review, and Guru3D’s HD 7970 CrossFire review, two high-end cards are enough to run even the most demanding games at 1080p, which means that X79 is not needed for anyone gaming below 2560×1600. According to Steam’s hardware survey, roughly 0.8% of gamers have a screen with a resolution above 1920×1200, and according to PCGamer, roughly 0.2% use more than one screen. For the other 99%, two high-end cards are definitely more than enough.
“But even with two cards, don’t we need them both on x16/x16, rather than x8/x8?”
Image: PCIe scaling. Less than 1FPS difference between PCIe 2.0 x8/x8, PCIe 2.0 x16/x16, PCIe 3.0 x8/x8, and PCIe 3.0 x16.x16, even with flagship cards. Image courtesy of behardware
The answer, as shown in Anandtech’s exploration of HD 7970 PCI-E bandwidth andTechpowerup’s Ivy Bridge PCI-E scaling article, is that the difference between x8 and x16 is about 1-2 FPS at most, and more often than not, there is no difference.
Image: PCIe scaling. Less than 1FPS difference between x8 and x16, even with flagship cards at high resolutions. Image courtesy of TechPowerup
Even with multiple cards at high resolutions, there is still no difference between x8/x8 and x16/x16, as seen in HardOCP’s analysis of x16/x16 vs. x8/x8 and Tomshardware article on CrossFire And SLI
Image: Less than 1FPS difference between x8 and x16. Image courtesy of Anandtech
For users on standard resolutions, x8/x8 vs x16/x16 is not going to make a difference in performance. Even with a 680 or a 7970, or two 7970’s or even with three or four 7970’s, PCIe bandwidth is not a bottleneck. Anand’s conclusion on this matter is very solid:
“…in fact this may be the greatest benefit of PCIe 3 right now, as it should provide enough bandwidth to make an x8/x8 configuration every bit as fast as an x16/x16 configuration, allowing for maximum GPU performance with Intel’s mainstream CPUs.” [source, emphasis added]
Performance
So now we are down to the most important issue: Performance. The i7-3820 is using a higher chipset, a higher-end socket, it has more cache, and is derived from higher-end silicon (the same that gave us the $1000 i7-3960X). Even if it is a quad-core, just like the i7-3770K, it ought to perform better… right?
Sandy Bridge was released in January 2011, and Ivy Bridge was released in April 2012. Ivy Bridge brought about a small improvement in IPC (Instructions per clock), giving it somewhere between 5%-10% better performance over Sandy Bridge. This improvement is small, but it is consistent. Ivy Bridge is also built on a new, more advanced manufacturing process node. Intel uses a 22nm process and 3D-transistors, both of which contribute to increasing speed for the same amount of power use.
If you want a great overview of how the two perform, Anandtech’s Bench tool is always extremely useful: Bench i7-3820 (Blue) vs i7-3770K (Dark Gray)
Out of the 52 office benchmarks, productivity benchmarks, content creation benchmarks, multi-threaded benchmarks, single-threaded benchmarks, power consumption benchmarks and gaming benchmarks that Anandtech compares, the i7-3770K wins . . . all 52 benchmarks.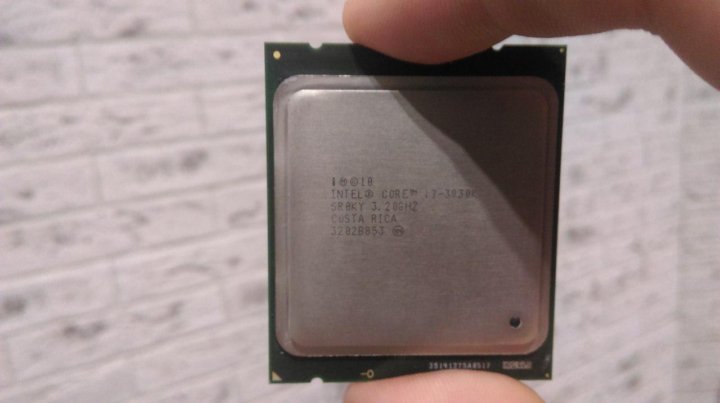
Image: i7-3770K beating i7-3820 by a small margin in Sysmark. Image courtesy ofAnandtech
And the others agree: Anandtech’s full review, as well as Hot Hardware’s review, Guru3d’s review, and Legion Hardware’s review, the i7-3770K outperforms the i7-3820 in almost everything!
Image: i7-3770K beating i7-3820 by a small margin in video transcoding. Image courtesy of Guru3d
Performance in normal software, performance in games, performance in synthetic benchmarks, the i7-3770K will do better than the i7 3820 in all of them. In fact, even if you swap the $300 i7-3830 for a $550 i7-3930K, the i7-3770K will still win nearly twice as many benches, as shown Anandtech’s direct comparison. The next step up from the i7-3770K is not an i7-3820 or an i7-3930K, it is the i7-3960X, which is undeniably the better CPU.
Image: DAWBench results from ADK Pro Audio
While the i7-3770K wins most benches, it is still not 100%. One place where the i7-3820 does make sense is for a few specific non-gaming applications. For example, it performs better in some digital audio processing software, as seen above. If it is critical for your system to support VT-d (you should know if you need it), then the i7-3820 makes more sense.
Image: This is what most performance graphs will show, the i7-3820 trailing the i7-3770K. Image courtesy of hothardware
Price
We advise people to go for performance/price, whenever possible. After seeing performance, let us look at platform price. The total platform price is typically said to be the same, since the X79 motherboards are typically more expensive, while the i7 3770K is more expensive by $30. Please note that the cheapest X79 motherboards (at the time of writing) start at ~$200, which is the price of premium Z77 boards, and there are many quality Z77 motherboards that are significantly cheaper than the cheapest X79 boards. The 3830 has a 130W TDP, and comes without a stock cooler, so you are forced to buy an aftermarket HSF, and it needs to be a beefier one than what you would use for a 3770K, which cancels out the difference in CPU price.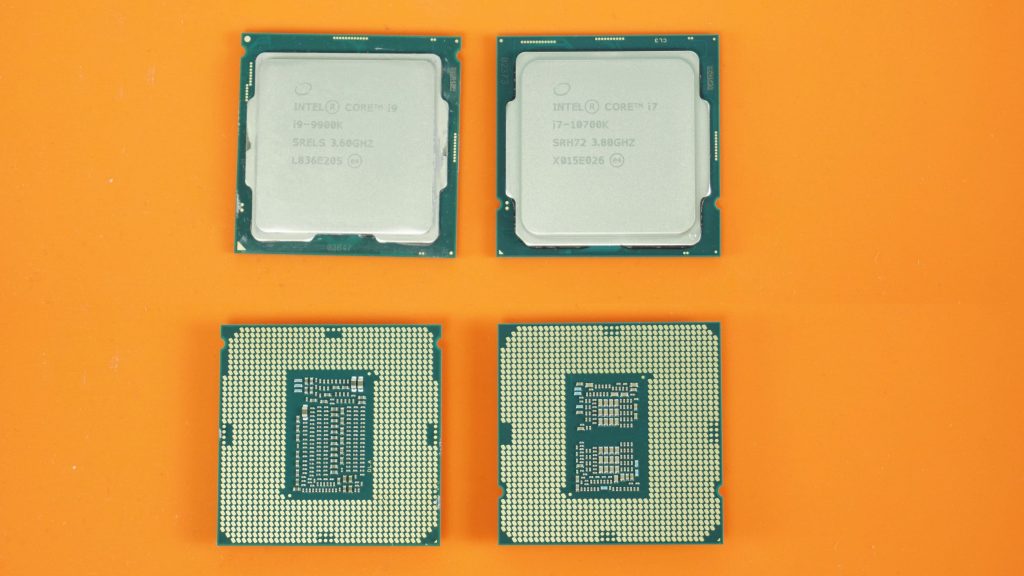 Thus if price is an issue, then it is in the 3770K’s favour, as you can get the platform for cheaper, or get premium products for the same platform price as the 3820. Unless you can get the i7-3820 with a steep discount, then the i7-3770K has better performance/price, since it has better performance, and similar or lower price.
Future proofing
One reason to get the i7-3820 is to be able to upgrade to an i7-3930K or i7-3960X later. Thus you are buying the i7-3820 as a temporary solution. This is wasteful, as you are spending $300 on a CPU you do not intend to use for long. It is also a gamble. By the time you can afford the $600/$1000 for an upgrade, something better might be on the market (Haswell?). Future-proofing attempts are usually a waste of money. It is always best to buy the best item in your budget, instead of trying to future-proof your PC.
Heat and power consumption?
Even though both points are in the i7-3770K’s favour, these are minor issues. The i7-3820 will consume more power and run hotter, but not by much.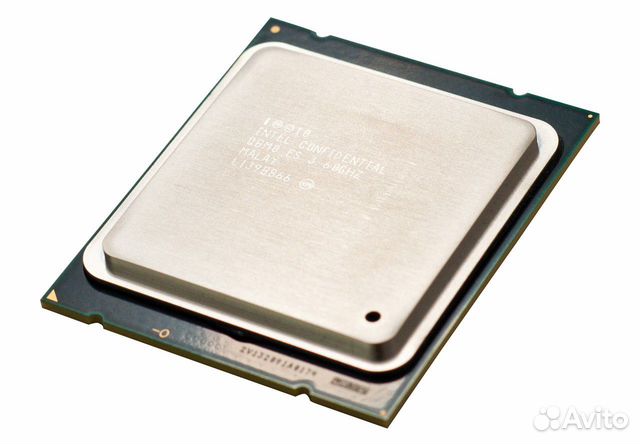
Is the i7-3820 illogical?
Before we conclude, let us address a minor issue: It is tempting to say: “Are you telling us that Intel made a product for which there are no customers? You think you know better than Intel?” No. Intel knows that there is a very small number of customers who need more than 2 graphics cards but cannot afford $1000 for the CPU, and Intel also knows that there is a very large number of people who will buy whatever has the biggest number and fits the budget. Anand put it perfectly before Ivy Bridge was even out:
“The 3820 admittedly targets a niche, but it does so without any real trade offs. If you land outside of the 3820’s niche however, you’re better served by the 2500/2600K at a lower total platform cost or a 3930K/3960X if you’re running a heavily threaded workload and can use the extra cores.” [source, emphasis added]
With the i7-3770K now available, that niche which the i7-3820 serves is reduced. Most people buying the i7-3820 are not buying it for handling 3 or 4 graphics cards; they mistakenly think it is a better CPU than the i7-3770K.
Is the i7-3820 bad?
No. The i7-3820 is a good CPU. In fact, it is an excellent CPU! However, now that Ivy Bridge is out, the i7-3770K is the better CPU. While it may not perform significantly higher than the i7-3820, it does consistently perform better, usually performing 5%-10 better. Normally, the difference in price between the two is roughly $20-$30, so it makes sense to get the better performing i7-3770K. In the rare situation that the i7-3820 has a major price cut or combo, but there is no price cut or combo for the i7-3770K, then it makes perfect sense to go for the i7-3820. Our conclusion below applies to normal situations, where the i7-3820 is an excellent CPU for its price, but the i7-3770K is 5%-10% better while still the same (or even cheaper) platform price.
Conclusion
99% of gamers are fine with one or two high-end graphics cards. The only reason to go with the i7-3820 is if you meet these criteria:
- You can spend the $1500-$2000 needed for 3 or 4 high-end graphics cards
- You can only afford the $300 i7-3820
In all other situations, the i7-3770K is the better choice.
The i7-3820 has a bigger number in its name, a bigger number for its socket and a bigger number for the chipset it uses. If that is what you want, go for it. The i7-3770K has better performance. Which matters more to you?
For ~$300, the best CPU is the i7-3770K. The next step up is the i7-3960X. For gaming, there is no logical CPU in between.
We recommend builds for all budgets at Logical Increments. You’ll find the i7-3770K at the high end of our recommended builds at Logical Increments, but not the i7-3820.
Information sources:
CPU performance
Anandtech i7-3820 Review
Hot Hardware FX-8350 Review
Guru3D FX-8350 Review
Legion Hardware FX-8350 Review
Anandtech Bench comparison of i7-3770K to i7-3820
PCIe 3.
 0
0
TechPowerUp Ivy Bridge PCI-E Scaling
Anandtech HD 7970 Revisit
Multi-channel RAM
TweakTown X79 Memory Analysis
LegitReviews DDR3 X79 Performance Review
Tom’s Hardware Parallel Processing article
Multi-GPU performance
-SLI:
TechPowerUp GTX 680 SLI Performance
Guru3D GTX 680 SLI Review
-Crossfire:
TechPowerUp HD 7970 CrossFire Performance
Guru3D HD 7970 Crossfire Review
Performance — Intel Core i7 3820 review
Skip to main content
TechRadar is supported by its audience. When you purchase through links on our site, we may earn an affiliate commission. Here’s why you can trust us.
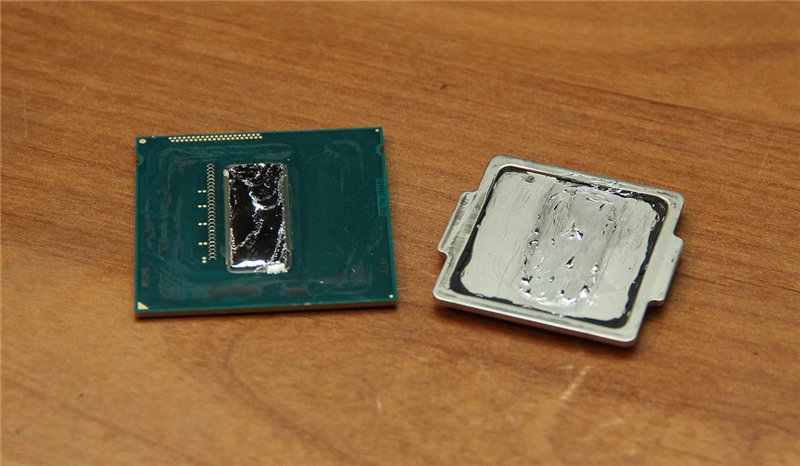
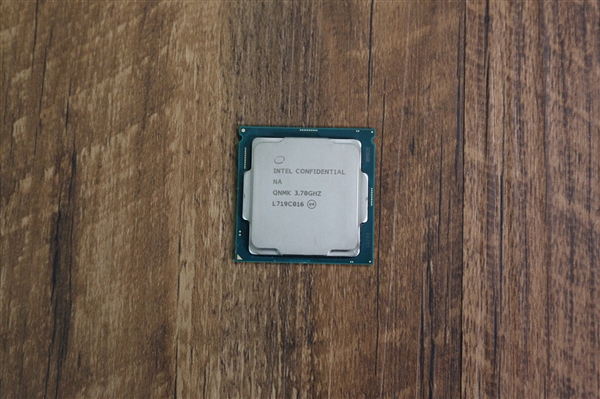
The quad-core Sandy Bridge E in its silicon glory
Why you can trust TechRadar
Our expert reviewers spend hours testing and comparing products and services so you can choose the best for you. Find out more about how we test.
The Intel Core i7 3820 actually posts some decent scores in our benchmark tests, but it’s the Intel Core i7 2700K that makes the best impression, thanks to some stellar comparative benchmarks.
In single-threaded applications, the straight Sandy Bridge architecture has the edge in our test, showing why the gaming performance is higher as well.
So the key battle for the Intel Core i7 3820 is the head-to-head with the Core i7 2700K, the top Sandy Bridge CPU. At £260, they’re both priced in the same ballpark (or stadium, if you prefer), and at 3.6GHz vs the 2700K’s 3.5GHz they’re both around the same sort of clockspeed.
Predictably things are pretty close in terms of raw performance. Importantly, though, not identical.
The Intel Core i7 2700K still maintains a lead at stock clocks over the Sandy Bridge E Intel Core i7 3820. In single-threaded performance, the 2700K is actually quicker than even the i7 3830K, although despite having a higher clockspeed, the i7 3820 offers the same figures as the 3830K in single-threaded performance.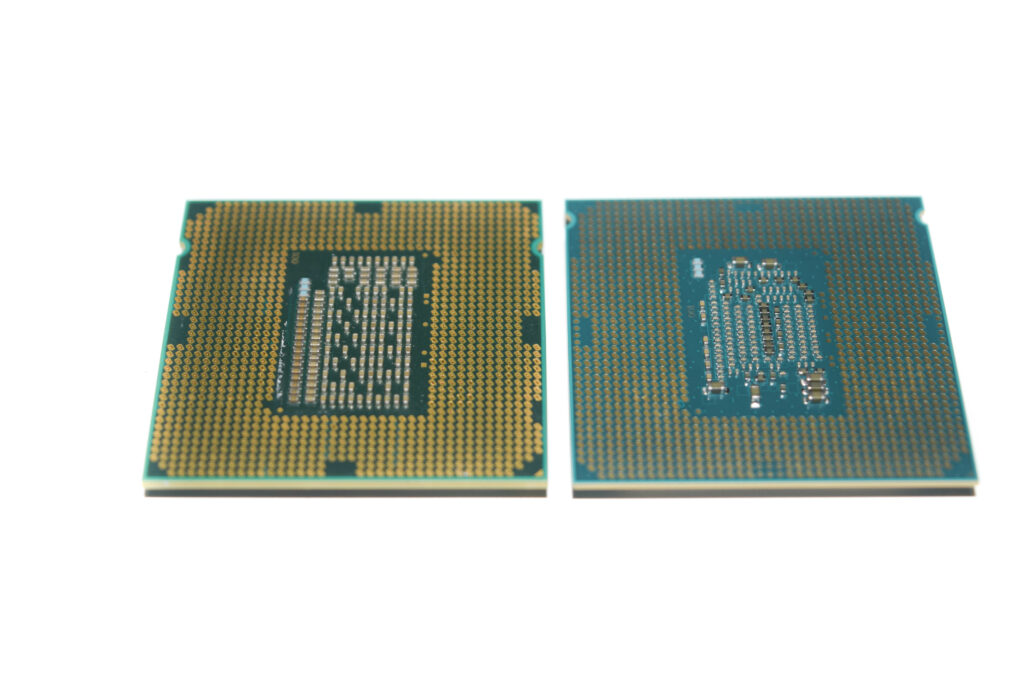
Thanks to the extra couple of cores in the mid-range Sandy Bridge E chip, it takes a lead in the multi-threaded Cinebench rendering and X264 encoding tests. The resolutely quad-core Intel Core i7 3820 lags behind the hex-core chip and, interestingly, the lower-clocked Core i7 2700K, though.
The straight Sandy Bridge’s gaming pedigree comes to the fore, though, when we start throwing the World in Conflict and Shogun 2 benchmarks at the different chips.
When the graphics card is taken out of the equation, in the WiC and Shogun 2 CPU DX9 CPU tests, the straight-line performance of the 2700K puts it ahead of both the Sandy Bridge E chips. And that’s even true when we beat the i7 3820 with the overclocking stick, too.
But the overclocking performance of the i7 3820 is quite interesting. Despite being only partially unlocked, meaning you hit the 4.3GHz limit straight away, you can push it further given the right motherboard.
Thanks to the BCLK strap, the Sandy Bridge E chips are able to withstand a good tweaking of the base clock. That’s still limited to being 100MHz, 125MHz, 166MHz and 250MHz, but it does give you some leeway.
With a decent motherboard, you should be able to get up to the same sort of overclocking performance — around 4.7GHz — as the i7 2700K.
That means that the partially locked multiplier really doesn’t impact too much on the overclocking prowess of this new Sandy Bridge E chip.
But the reliance on a decent motherboard is one thing that goes against the i7 3820, especially in a straight fight between it and the 2700K. And that’s all down to platform costs.
- Intel Core i7 3820 (Intel Core i7) at Newegg for $49.99
Intel Core i7 3820: Price Comparison
$49.99
View
$198.83
View
$199. 88
88
View
$263
View
$314.62
View
powered by
Current page:
Performance
Prev Page Benchmarks
Next Page Verdict
TechRadar is part of Future US Inc, an international media group and leading digital publisher. Visit our corporate site .
©
Future US, Inc. Full 7th Floor, 130 West 42nd Street,
New York,
NY 10036.
Intel Core i7-4770K vs Intel Core i7-4930K: What is the difference?
49 BALLLA
Intel Core i7-4770K
42 Ballla
Intel Core i7-4930K
Winter when comparing
VS
63 Facts compared to
3303
Why is Intel Core i7-4770K better than Intel Core i7-4930K?
- 46W below TDP?
84W vs 130W - Does it have integrated graphics?
- 64KB more L1 cache?
256KB vs 192KB - 0.
 05MB/core more L2 cache per core?
0.25MB/core vs 0.2MB/core - 7.56% higher PassMark score (single)?
2148 vs 1997 - Has FMA3?
Why is Intel Core i7-4930K better than Intel Core i7-4770K?
- 45.71% higher CPU speed?
6 x 3.4GHz vs 4 x 3.5GHz - 266MHz higher RAM speed?
1866MHz vs 1600MHz - 4 more CPU threads?
12 vs 8 - 0.5MB more L2 cache?
1.5MB vs 1MB - 1.86x higher PassMark score?
13065 vs 7042 - 4MB more L3 cache? more memory bandwidth?
12MB vs 8MB - 59.7GB/s vs 25.6GB/s
- 32GB more max memory?
64GB vs 32GB
Which comparisons are the most popular?
Intel Core i7-4770k
VS
Intel Core i7-4790K
Intel Core i7-4930K
VS
Intel Core I7-47903
AMITE I7-4770K 9000 VS 9000 VS VS
Intel Core i7-4930K
vs
Intel Core i5-10400
Intel Core i7-4770k
VS
Intel Core i7-4770
Intel Core i7-4930K
VS
Intel Core i7-39303
Intel Core I7-4770K 9000 VS 9000 VS 9000 VS 9000 VS 9000 VS 9000 VS 9000 VS 9000 VS 9000 VS 9000 VS 9000
Intel Core i7-4930K
VS
Intel Core i7-4820k
Intel Core i7-4770K
VS
Intel Core i5-11400h
Intel Core Core Core Core
9000 VS 9000 VS 9000 VS 9000 VS 9000 VS 9000 8700
Intel Core i7-4770K
vs
AMD Ryzen 5 3600
Intel Core i7-4930K
vs
Intel Core i7-3970X
Intel Core i7-4770K
vs
Intel Core i7-4770S
Intel Core i7-4930K
VS
Intel Core i7-4960x
Intel Core i7-4770K
VS
AMD Ryzen 3 2200G
Intel Core I7-4930K
VS
AMD Ryzen 3 3200g
vs
Intel Core i5-4690k
Intel Core i7-4930k
VS
AMD Ryzen 5 1600x
Intel Core i7-4770k
ANTEL Core I7-INTEL Core I7-INTEL Core I7-INTEL Core I7-INTEL Core I7-INTEL Core I7-INTEL CORE
AMD RYZEN 7 2700X
Comparison of prices
users reviews
performance
1. Skur -old processor
4 x 3.5Ghz
6 x 3.4GHZ
The central processor speed shows how many processing cycles per second can perform the processor, the processor can perform, considering all its cores (processors). It is calculated by adding the clock speeds of each core or, in the case of multi-core processors, each group of cores.
2nd processor thread
More threads result in better performance and better multitasking.
3.speed turbo clock
3.9GHz
3.9GHz
When the processor is running below its limits, it can jump to a higher clock speed to increase performance.
4. Has unlocked multiplier
✔Intel Core i7-4770K
✔Intel Core i7-4930K
Some processors come with an unlocked multiplier and are easier to overclock, allowing you to enjoy better quality in games and other applications.
5. L2 Cache
More L2 scratchpad memory results in faster results in CPU and system performance tuning.
6.L3 cache
More L3 scratchpad memory results in faster results in CPU and system performance tuning.
7.L1 cache
More L1 cache results in faster results in CPU and system performance tuning.
8.core L2
0.25MB/core
0.2MB/core
More data can be stored in L2 scratchpad for access by each processor core.
9.core L3
2MB/core
2MB/core
More data can be stored in L3 scratchpad for access by each processor core.
Geotagging
1. PassMark result
This benchmark measures CPU performance using multi-threading.
2. PassMark result (single)
This test measures processor performance using a thread of execution.
3.Geekbench 5 result (multi-core)
Unknown. Help us offer a price. (Intel Core i7-4930K)
Geekbench 5 is a cross-platform test that measures the performance of a multi-core processor. (Source: Primate Labs, 2022)
4.Cinebench R20 result (multi-core)
Unknown. Help us offer a price. (Intel Core i7-4930K)
Cinebench R20 is a test that measures the performance of a multi-core processor by rendering a 3D scene.
5.Cinebench R20 result (single core)
Unknown. Help us offer a price. (Intel Core i7-4930K)
Cinebench R20 is a test to evaluate the performance of a single core processor when rendering a 3D scene.
6.Geekbench 5 result (single core)
Unknown. Help us offer a price. (Intel Core i7-4930K)
Geekbench 5 is a cross-platform test that measures the single-core performance of a processor. (Source: Primate Labs, 2022)
7. Blender test result (bmw27)
440.7seconds
Unknown. Help us offer a price. (Intel Core i7-4930K)
The Blender benchmark (bmw27) measures CPU performance by rendering a 3D scene. More powerful processors can render a scene in a shorter time.
8.Blender result (classroom)
1376.9seconds
Unknown. Help us offer a price. (Intel Core i7-4930K)
The Blender (classroom) test measures CPU performance by rendering a 3D scene. More powerful processors can render a scene in a shorter time.
9.performance per watt
This means that the processor is more efficient, giving more performance per watt of power used.
Integrated graphics
1.GPU clock speed
350MHz
∅
N/A
Graphics processing unit (GPU) has a higher clock speed.
2.turbo GPU
1250MHz
∅
N/A
When the GPU is running below its limits, it may jump to a higher clock speed to increase performance.
3.GPU actuators
∅
N/A
A graphics processing unit (GPU) with more execution units can provide better graphics.
4.Monitor support
∅
N/A
By using multiple displays, you can expand your workspace, making it easier to work in multiple applications.
5.DirectX version
∅
N/A
DirectX is used in games with a newer version that supports better graphics.
6.OpenGL version
∅
N/A
The newer version of OpenGL, the better graphics quality in games.
OpenCL version 7
Unknown. Help us offer a price. (Intel Core i7-4930K)
Some applications use OpenCL to use the power of the graphics processing unit (GPU) for non-graphical computing. Newer versions are more functional and better quality.
8.textured units (TMUs)
Unknown. Help us offer a price. (Intel Core i7-4770K)
∅
N/A
TMUs take textured units and map them to the geometric location of the 3D scene. More TMUs generally means texture information is processed faster.
9 ROPs imaging units
Unknown. Help us offer a price. (Intel Core i7-4770K)
∅
N/A
ROPs are responsible for some of the final steps of the rendering process, such as writing the final pixel data to memory and for performing other tasks such as anti-aliasing to improve the appearance of graphics.
Memory
1.RAM speed
1600MHz
1866MHz
Can support faster memory which speeds up system performance.
2.max memory bandwidth
25.6GB/s
59.7GB/s
This is the maximum rate at which data can be read from or stored in memory.
3. DDR version
DDR (Dynamic Dynamic Random Access Memory Double Data Rate) is the most common type of RAM. New versions of DDR memory support higher maximum speeds and are more energy efficient.
4 memory channels
More memory channels increase the speed of data transfer between memory and processor.
5.Maximum memory
Maximum memory (RAM).
6.bus baud rate
The bus is responsible for transferring data between different components of a computer or device.
7. Supports Memory Error Code
✖Intel Core i7-4770K
✖Intel Core i7-4930K
Memory Error Code can detect and repair data corruption. It is used when necessary to avoid distortion, such as in scientific computing or when starting a server.
8.eMMC version
Unknown. Help us offer a price. (Intel Core i7-4770K)
Unknown. Help us offer a price. (Intel Core i7-4930K)
The newer version of eMMC — built-in flash memory card — speeds up the memory interface, has a positive effect on device performance, for example, when transferring files from a computer to internal memory via USB.
9.bus frequency
Unknown. Help us offer a price. (Intel Core i7-4770K)
Unknown. Help us offer a price. (Intel Core i7-4930K)
The bus is responsible for transferring data between various components of a computer or device
Functions
such as Intel’s Hyperthreading or AMD’s Simultaneous Multithreading) provides higher performance by dividing each physical processor core into logical cores, also known as threads. Thus, each core can run two instruction streams at the same time.
2. Has AES
✔Intel Core i7-4770K
✔Intel Core i7-4930K
AES is used to speed up encryption and decryption.
3. Has AVX
✔Intel Core i7-4770K
✔Intel Core i7-4930K
AVX is used to help speed up calculations in multimedia, scientific and financial applications, and to improve the performance of the Linux RAID program.
4.Version SSE
SSE is used to speed up multimedia tasks such as editing images or adjusting audio volume. Each new version contains new instructions and improvements.
5.Has F16C
✔Intel Core i7-4770K
✔Intel Core i7-4930K
F16C is used to speed up tasks such as image contrast adjustment or volume control.
6.bits transmitted at the same time
Unknown. Help us offer a price. (Intel Core i7-4770K)
Unknown. Help us offer a price. (Intel Core i7-4930K)
NEON provides faster media processing such as MP3 listening.
7. Has MMX
✔Intel Core i7-4770K
✔Intel Core i7-4930K
MMX is used to speed up tasks such as adjusting image contrast or adjusting volume.
8. Has TrustZone
✖Intel Core i7-4770K
✖Intel Core i7-4930K
The technology is integrated into the processor to ensure device security when using features such as mobile payments and streaming video using digital rights management technology ( DRM).
9.interface width
Unknown. Help us offer a price. (Intel Core i7-4770K)
Unknown. Help us offer a price. (Intel Core i7-4930K)
The processor can decode more instructions per clock (IPC), which means the processor performs better
Price comparison
Cancel
Which CPUs are better?
Comparison of AMD A6-6420K and Intel Core i7-4790K
Comparative analysis of AMD A6-6420K and Intel Core i7-479 processors0K for all known characteristics in the categories: General Information, Performance, Memory, Graphics, Graphical Interfaces, Graphics API Support, Compatibility, Technology, Virtualization, Graphics Quality, Peripherals, Security and Reliability.
Analysis of processor performance by benchmarks: PassMark — Single thread mark, PassMark — CPU mark, Geekbench 4 — Single Core, Geekbench 4 — Multi-Core, GFXBench 4.0 — Car Chase Offscreen (Frames), GFXBench 4.0 — Manhattan (Frames), GFXBench 4.0 — T-Rex (Frames), GFXBench 4.0 — Car Chase Offscreen (Fps), GFXBench 4.0 — Manhattan (Fps), GFXBench 4.0 — T-Rex (Fps), 3DMark Fire Strike — Physics Score, CompuBench 1.5 Desktop — Face Detection ( mPixels/s), CompuBench 1.5 Desktop — Ocean Surface Simulation (Frames/s), CompuBench 1.5 Desktop — T-Rex (Frames/s), CompuBench 1.5 Desktop — Video Composition (Frames/s), CompuBench 1.5 Desktop — Bitcoin Mining ( mHash/s).
AMD A6-6420K
versus
Intel Core i7-4790k
Advantages
Reasons to choose AMD A6-6420K
- about 35% less energy consumption: 65 WATT VS 88 WATT
- Production in the GEEEKBENCH 4-SINGLE-SINGLE-SINGEL more: 2105 vs 1070
- Performance in GFXBench 4.
 0 — T-Rex (Frames) about 11% more: 3830 vs 3454
 - Performance in GFXBench 4.0 benchmark — T-Rex (Fps) about 11% higher: 3830 vs 3454
| Power consumption (TDP) | 65 Watt vs 88 Watt |
| Geekbench 4 — Single Core | 2105 vs 1070 |
| GFXBench 4.0 — T-Rex (Frames) | 3830 vs 3454 |
| GFXBench 4.0 — T-Rex (Fps) | 3830 vs 3454 |
Reasons to choose Intel Core i7-4790K
- 2 more cores, able to run more applications at the same time: 4 vs 2
- 6 more threads: 8 vs 2
- About 5% more clock speed: 4.40 GHz vs 4.2 GHz
- Approximately 6% higher max core temperature: 74.04°C vs 70°C
- A newer manufacturing process for the processor allows it to be more powerful, but with less power consumption: 22 nm vs 32 nm SOI
- L1 cache is 2.
 7 times larger, which means more data can be stored in it for quick access
 - Performance about 58% more in PassMark — Single thread mark benchmark: 2464 vs 1557
- 5.2x more performance in PassMark — CPU mark benchmark: 8059 vs 1539
- Geekbench 4 — Multi-Core benchmark performance by about 34 % more: 3995 vs 2988
- 2.2x better performance in GFXBench 4.0 — Car Chase Offscreen (Frames) benchmark: 1279 vs 585
- About 44% better performance in GFXBench 4.0 — Manhattan (Frames) benchmark: 2489 vs 100230
- 2.2 times more performance in GFXBench 4.0 — Car Chase Offscreen (Fps): 1279 vs 585
- About 44% more performance in GFXBench 4.0 — Manhattan (Fps): 2489 vs 1730
| Number of cores | 4 vs 2 |
| Number of threads | 8 vs 2 |
| Maximum frequency | 4.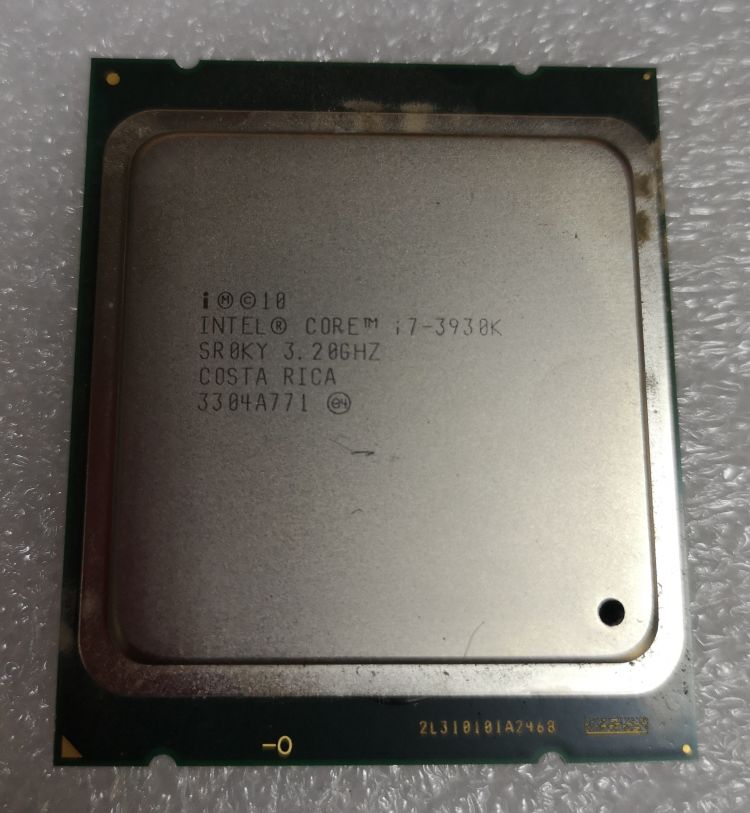 40 GHz vs 4.2 GHz 40 GHz vs 4.2 GHz |
| Maximum core temperature | 74.04°C vs 70°C |
| Process | 22 nm vs 32 nm SOI |
| Level 1 cache | 256 KB vs 96 KB |
| PassMark — Single thread mark | 2464 vs 1557 |
| PassMark — CPU mark | 8059 vs 1539 |
| Geekbench 4 — Multi-Core | 3995 vs 2988 |
| GFXBench 4.0 — Car Chase Offscreen (Frames) | 1279 vs 585 |
| GFXBench 4.0 — Manhattan (Frames) | 2489vs 1730 |
GFXBench 4. 0 — Car Chase Offscreen (Fps) 0 — Car Chase Offscreen (Fps) |
1279 vs 585 |
| GFXBench 4.0 — Manhattan (Fps) | 2489 vs 1730 |
Benchmark comparison
CPU 1: AMD A6-6420K
CPU 2: Intel Core i7-4790K
| PassMark — Single thread mark |
|
|||
| PassMark — CPU mark |
|
|||
| Geekbench 4 — Single Core |
|
|||
| Geekbench 4 — Multi-Core |
|
|||
GFXBench 4. 0 — Car Chase Offscreen (Frames) 0 — Car Chase Offscreen (Frames) |
|
|||
| GFXBench 4.0 — Manhattan (Frames) |
|
|||
| GFXBench 4.0 — T-Rex (Frames) |
|
|||
| GFXBench 4.0 — Car Chase Offscreen (Fps) |
|
|||
GFXBench 4. 0 — Manhattan (Fps) 0 — Manhattan (Fps) |
|
|||
| GFXBench 4.0 — T-Rex (Fps) |
|
| Name | AMD A6-6420K | Intel Core i7-4790K |
|---|---|---|
| PassMark — Single thread mark | 1557 | 2464 |
| PassMark — CPU mark | 1539 | 8059 |
| Geekbench 4 — Single Core | 2105 | 1070 |
| Geekbench 4 — Multi-Core | 2988 | 3995 |
GFXBench 4.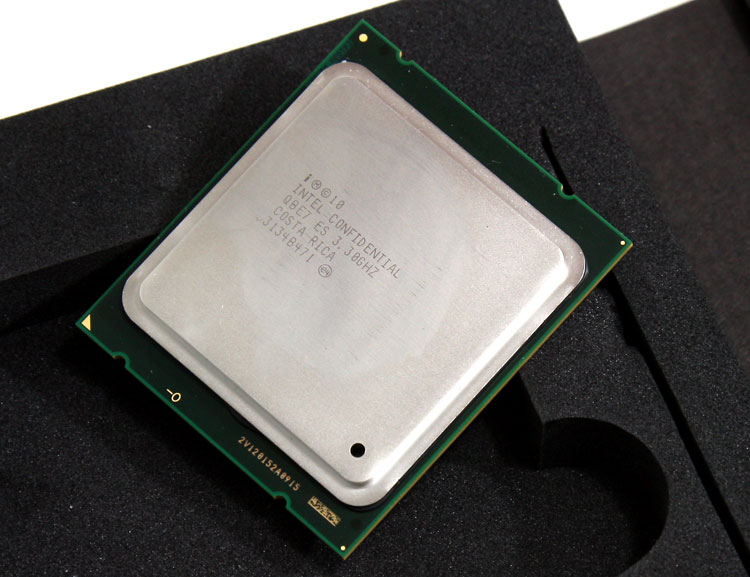 0 — Car Chase Offscreen (Frames) 0 — Car Chase Offscreen (Frames) |
585 | 1279 |
| GFXBench 4.0 — Manhattan (Frames) | 1730 | 2489 |
| GFXBench 4.0 — T-Rex (Frames) | 3830 | 3454 |
| GFXBench 4.0 — Car Chase Offscreen (Fps) | 585 | 1279 |
| GFXBench 4.0 — Manhattan (Fps) | 1730 | 2489 |
| GFXBench 4.0 — T-Rex (Fps) | 3830 | 3454 |
| 3DMark Fire Strike — Physics Score | 4411 | |
CompuBench 1. 5 Desktop — Face Detection (mPixels/s) 5 Desktop — Face Detection (mPixels/s) |
5.95 | |
| CompuBench 1.5 Desktop — Ocean Surface Simulation (Frames/s) | 100.106 | |
| CompuBench 1.5 Desktop — T-Rex (Frames/s) | 0.695 | |
| CompuBench 1.5 Desktop — Video Composition (Frames/s) | 2.814 | |
| CompuBench 1.5 Desktop — Bitcoin Mining (mHash/s) | 7.147 |
Feature comparison
| AMD A6-6420K | Intel Core i7-4790K | |
|---|---|---|
| Family | AMD A-Series Processors | |
| OPN PIB | AD642KOKHLBOX | |
| OPN Tray | AD642KOKA23HL | |
| Place in the rating | 988 | 1008 |
| Series | AMD A6-Series APU for Desktops | 4th Generation Intel® Core™ i7 Processors |
| Applicability | Desktop | Desktop |
| Architecture name | Devil’s Canyon | |
| Issue date | June 1, 2013 | |
| Price at first issue date | $339 | |
| Price now | $306. 99 99 |
|
| Processor Number | i7-4790K | |
| Status | Discontinued | |
| Price/performance ratio (0-100) | 10.73 | |
| Base frequency | 4 GHz | 4.00 GHz |
| Level 1 cache | 96KB | 256KB |
| Level 2 cache | 1MB | 1MB |
| Process | 32nm SOI | 22nm |
| Maximum core temperature | 70°C | 74. 04°C 04°C |
| Maximum frequency | 4.2 GHz | 4.40 GHz |
| Number of cores | 2 | 4 |
| Number of threads | 2 | 8 |
| Unlocked | ||
| Support 64 bit | ||
| Bus Speed | 5 GT/s DMI2 | |
| Crystal area | 177mm | |
| Level 3 cache | 8MB | |
| Maximum case temperature (TCase) | 72 °C | |
| Number of transistors | 1400 Million | |
| Maximum number of memory channels | 2 | 2 9059eight |
| Supported memory frequency | 1866 MHz | |
| Maximum memory bandwidth | 25.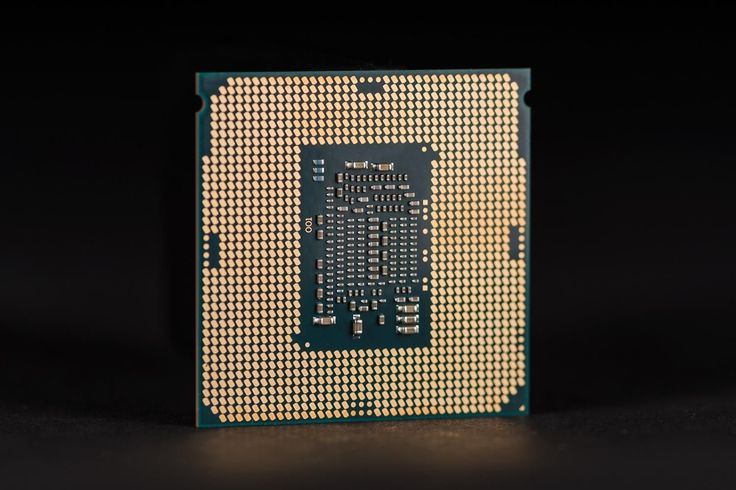 6 GB/s 6 GB/s |
|
| Maximum memory size | 32GB | |
| Supported memory types | DDR3-1333/1600, DDR3L-1333/1600 @ 1.5V | |
| Enduro | ||
| Maximum GPU clock | 800 MHz | 1.25 GHz |
| Number of iGPU cores | 192 | |
| Integrated graphics | AMD Radeon HD 8470D | Intel® HD Graphics 4600 |
| Switchable graphics | ||
| Unified Video Decoder (UVD) | ||
| Device ID | 0x412 | |
| Number of execution units | 20 | |
| Graphics base frequency | 350 MHz | |
| Graphics max dynamic frequency | 1. 25 GHz 25 GHz |
|
| Intel® Clear Video Technology HD | ||
| Intel® Flexible Display Interface (Intel® FDI) | ||
| Intel® InTru™ 3D Technology | ||
| Intel® Quick Sync Video | ||
| Video memory size | 2GB | |
| DisplayPort | ||
| HDMI | ||
| DVI | ||
| eDP | ||
| Maximum number of monitors supported | 3 | |
| VGA | ||
| WiDi support | ||
| DirectX | 11 | 11.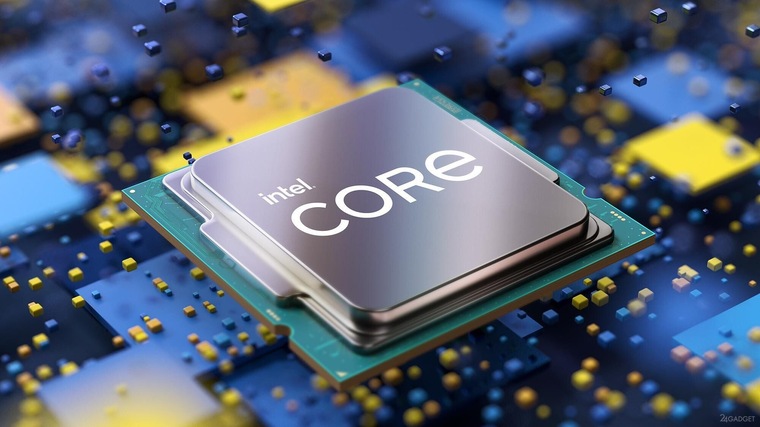 2/12 2/12 |
| OpenGL | 4.3 | |
| Supported sockets | FM2 | FCLGA1150 |
| Power consumption (TDP) | 65 Watt | 88 Watt |
| Low Halogen Options Available | ||
| Maximum number of processors in | 1 | |
| Package Size | 37.5mm x 37.5mm | |
| Thermal Solution | PCG 2013D | |
| AMD App Acceleration | ||
| AMD Elite Experiences | ||
| AMD HD3D technology | ||
| Enhanced Virus Protection (EVP) | ||
| Fused Multiply-Add 4 (FMA4) | ||
| Intel® Advanced Vector Extensions (AVX) | ||
| Intel® AES New Instructions | ||
| PowerGating | ||
| PowerNow | ||
| Enhanced Intel SpeedStep® Technology | ||
| Flexible Display interface (FDI) | ||
| Idle States | ||
| Extended instructions | Intel® SSE4. 1, Intel® SSE4.2, Intel® AVX2 1, Intel® SSE4.2, Intel® AVX2 |
|
| Intel 64 | ||
| Intel® Hyper-Threading Technology | ||
| Intel® My WiFi Technology | ||
| Intel® Stable Image Platform Program (SIPP) | ||
| Intel® TSX-NI | ||
| Intel® Turbo Boost Technology | ||
| Intel® vPro™ Platform Eligibility | ||
| Thermal Monitoring | ||
| AMD Virtualization (AMD-V™) | ||
IOMMU 2.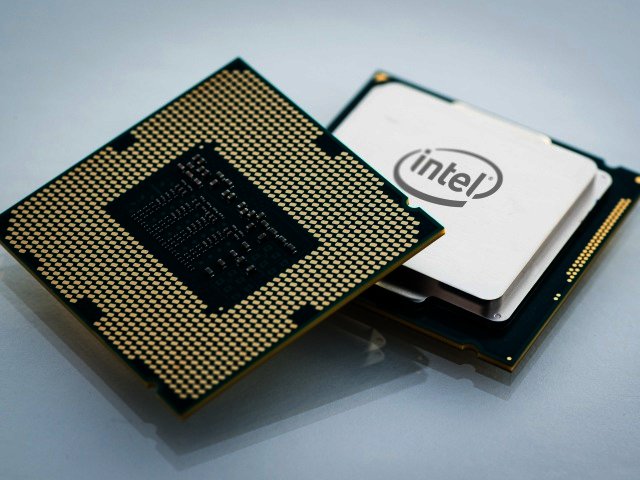 0 0 |
||
| Intel® Virtualization Technology (VT-x) | ||
| Intel® Virtualization Technology for Directed I/O (VT-d) | ||
| Intel® VT-x with Extended Page Tables (EPT) | ||
| Maximum resolution via DisplayPort | [email protected] | |
| Maximum resolution via eDP | [email protected] | |
| Maximum resolution via HDMI 1.4 | [email protected] | |
| Maximum resolution via VGA | [email protected] | |
| Number of PCI Express lanes | 16 | |
| PCI Express revision | 3.
|