Intel Core i7-2600 vs Intel Core 2 Duo E6600
|
|
|
|
|
Intel Core i7-2600 vs Intel Core 2 Duo E6600
Comparison of the technical characteristics between the processors, with the Intel Core i7-2600 on one side and the Intel Core 2 Duo E6600 on the other side. The first is dedicated to the desktop sector, It has 4 cores, 8 threads, a maximum frequency of 3,8GHz. The second is used on the desktop segment, it has a total of 2 cores, 2 threads, its turbo frequency is set to 2,4 GHz. The following table also compares the lithography, the number of transistors (if indicated), the amount of cache memory, the maximum RAM memory capacity, the type of memory accepted, the release date, the maximum number of PCIe lanes, the values obtained in Geekbench 4 and Cinebench R15.
Note: Commissions may be earned from the links above.
This page contains references to products from one or more of our advertisers. We may receive compensation when you click on links to those products. For an explanation of our advertising policy, please visit this page.
Specifications:
| Processor | Intel Core i7-2600 | Intel Core 2 Duo E6600 | ||||||
| Market (main) | Desktop | Desktop | ||||||
| ISA | x86-64 (64 bit) | x86-64 (64 bit) | ||||||
| Microarchitecture | Sandy Bridge | Core | ||||||
| Core name | Sandy Bridge | Conroe | ||||||
| Family | Core i7-2000 | Core 2 Duo 6000 | ||||||
| Part number(s), S-Spec | BX80623I72600, CM8062300834302, SR00B |
BX80557E6600, QJNC, QLLR, QPGE, QTOA, SL9S8, SL9ZL |
||||||
| Release date | Q1 2011 | Q3 2006 | ||||||
| Lithography | 32 nm | 65 nm | ||||||
| Transistors | 1. 160.000.000 160.000.000 |
291.000.000 | ||||||
| Cores | 4 | 2 | ||||||
| Threads | 8 | 2 | ||||||
| Base frequency | 3,4 GHz | 2,4 GHz | ||||||
| Turbo frequency | 3,8 GHz | — | ||||||
| Cache memory | 8 MB | 4 MB | ||||||
| Max memory capacity | 32 GB | 4 GB | ||||||
| Memory types | DDR3 1066/1333 | DDR2-800 | ||||||
| Max PCIe lanes | 16 | 16 | ||||||
| TDP | 95 W | 65 W | ||||||
| Suggested PSU | 600W ATX Power Supply | 600W ATX Power Supply | ||||||
| GPU integrated graphics | Intel HD Graphics 2000 | None | ||||||
| GPU execution units | 6 | — | ||||||
| GPU shading units | 48 | — | ||||||
| GPU base clock | 800 MHz | — | ||||||
| GPU boost clock | 1350 MHz | — | ||||||
| GPU FP32 floating point | 110,4 GFLOPS | — | ||||||
| Socket | LGA1155 | LGA775 | ||||||
| Compatible motherboard | Socket LGA 1155 Motherboard | Socket LGA 775 Motherboard | ||||||
| Maximum temperature | 72. 6°C 6°C |
60.1°C | ||||||
| CPU-Z single thread | 362 | 143 | ||||||
| CPU-Z multi thread | 1.723 | 288 | ||||||
| Cinebench R15 single thread | 121 | 63 | ||||||
| Cinebench R15 multi-thread | 614 | 119 | ||||||
| Cinebench R20 single thread | 255 | 127 | ||||||
| Cinebench R20 multi-thread | 1.295 | 236 | ||||||
| Cinebench R23 single thread | 695 | 494 | ||||||
| Cinebench R23 multi-thread | 3. 263 263 |
985 | ||||||
| PassMark single thread | 1.727 | 942 | ||||||
| PassMark CPU Mark | 5.321 | 872 | ||||||
| (Windows 64-bit) Geekbench 4 single core |
3.468 | 1.475 | ||||||
| (Windows 64-bit) Geekbench 4 multi-core |
11.183 | 2.368 | ||||||
| (Windows) Geekbench 5 single core |
786 | 321 | ||||||
| (Windows) Geekbench 5 multi-core |
2.941 | 549 | ||||||
| (SGEMM) GFLOPS performance |
132,7 GFLOPS | 18,18 GFLOPS | ||||||
| (Multi-core / watt performance) Performance / watt ratio |
118 pts / W | 36 pts / W | ||||||
| Amazon | ||||||||
| eBay |
Note: Commissions may be earned from the links above.
We can better compare what are the technical differences between the two processors.
Suggested PSU: We assume that we have An ATX computer case, a high end graphics card, 16GB RAM, a 512GB SSD, a 1TB HDD hard drive, a Blu-Ray drive. We will have to rely on a more powerful power supply if we want to have several graphics cards, several monitors, more memory, etc.
Price: For technical reasons, we cannot currently display a price less than 24 hours, or a real-time price. This is why we prefer for the moment not to show a price. You should refer to the respective online stores for the latest price, as well as availability.
The processor Intel Core i7-2600 has more cores, the maximum frequency of Intel Core i7-2600 is greater, that the thermal dissipation power of Intel Core 2 Duo E6600 is less. The Intel Core i7-2600 was designed earlier.
Performances :
Performance comparison between the two processors, for this we consider the results generated on benchmark software such as Geekbench 4.
| CPU-Z — Multi-thread & single thread score | |
|---|---|
| Intel Core i7-2600 |
362 1.723 |
| Intel Core 2 Duo E6600 |
143 288 |
In single core, the difference is 153%. In multi-core, the differential gap is 498%.
Note: Commissions may be earned from the links above. These scores are only an
average of the performances got with these processors, you may get different results.
CPU-Z is a system information software that provides the name of the processor, its model number, the codename, the cache levels, the package, the process. It can also gives data about the mainboard, the memory. It makes real time measurement, with finally a benchmark for the single thread, as well as for the multi thread.
| Cinebench R15 — Multi-thread & single thread score | |
|---|---|
| Intel Core i7-2600 |
121 614 |
| Intel Core 2 Duo E6600 |
63 119 |
In single core, the difference is 92%. In multi-core, the differential gap is 416%.
Note: Commissions may be earned from the links above. These scores are only an
average of the performances got with these processors, you may get different results.
Cinebench R15 evaluates the performance of CPU calculations by restoring a photorealistic 3D scene. The scene has 2,000 objects, 300,000 polygons, uses sharp and fuzzy reflections, bright areas, shadows, procedural shaders, antialiasing, and so on. The faster the rendering of the scene is created, the more powerful the PC is, with a high number of points.
| Cinebench R20 — Multi-thread & single thread score | |
|---|---|
| Intel Core i7-2600 |
255 1.295 |
| Intel Core 2 Duo E6600 |
127 236 |
In single core, the difference is 101%. In multi-core, the differential gap is 449%.
Note: Commissions may be earned from the links above. These scores are only an
average of the performances got with these processors, you may get different results.
Cinebench R20 is a multi-platform test software which allows to evaluate the hardware capacities of a device such as a computer, a tablet, a server. This version of Cinebench takes into account recent developments in processors with multiple cores and the latest improvements in rendering techniques. The evaluation is ultimately even more relevant.
| Cinebench R23 — Multi-thread & single thread score | |
|---|---|
| Intel Core i7-2600 |
695 3.263 |
| Intel Core 2 Duo E6600 |
494 985 |
In single core, the difference is 41%.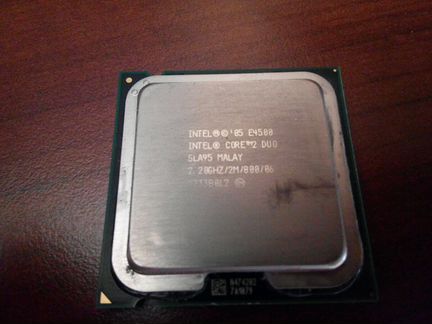 In multi-core, the differential gap is 231%.
Note: Commissions may be earned from the links above. These scores are only an
average of the performances got with these processors, you may get different results.
Cinebench R23 is cross-platform testing software that allows you to assess the hardware capabilities of a device such as a computer, tablet, server. This version of Cinebench takes into account recent developments in processors with multiple cores and the latest improvements in rendering techniques. The evaluation is ultimately even more relevant. The test scene contains no less than 2,000 objects and more than 300,000 polygons in total.
| PassMark — CPU Mark & single thread | |
|---|---|
| Intel Core i7-2600 |
1.727 5.321 |
| Intel Core 2 Duo E6600 |
942 872 |
In single core, the difference is 83%. In multi-core, the differential gap is 510%.
Note: Commissions may be earned from the links above. These scores are only an
average of the performances got with these processors, you may get different results.
PassMark is a benchmarking software that performs several performance tests including prime numbers, integers, floating point, compression, physics, extended instructions, encoding, sorting. The higher the score is, the higher is the device capacity.
On Windows 64-bit:
| Geekbench 4 — Multi-core & single core score — Windows 64-bit | |
|---|---|
| Intel Core i7-2600 |
3.468 11.183 |
| Intel Core 2 Duo E6600 |
1.475 2.368 |
In single core, the difference is 135%. In multi-core, the differential gap is 372%.
On Linux 64-bit:
| Geekbench 4 — Multi-core & single core score — Linux 64-bit | |
|---|---|
| Intel Core i7-2600 |
3.790 10.590 |
| Intel Core 2 Duo E6600 |
1.586 2.480 |
In single core, the difference is 139%. In multi-core, the differential gap is 327%.
On Mac OS X 64-bit:
| Geekbench 4 — Multi-core & single core score — Mac OS X 64-bit | |
|---|---|
| Intel Core i7-2600 |
3.498 11.280 |
| Intel Core 2 Duo E6600 |
1.627 2.766 |
In single core, the difference is 115%. In multi-core, the differential gap is 308%.
Note: Commissions may be earned from the links above.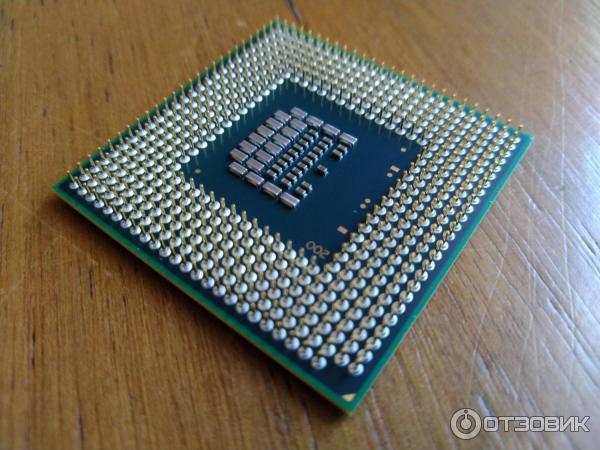 These scores are only an
average of the performances got with these processors, you may get different results.
Geekbench 4 is a complete benchmark platform with several types of tests, including data compression, images, AES encryption, SQL encoding, HTML, PDF file rendering, matrix computation, Fast Fourier Transform, 3D object simulation, photo editing, memory testing. This allows us to better visualize the respective power of these devices. For each result, we took an average of 250 values on the famous benchmark software.
On Windows:
| Geekbench 5 — Multi-core & single core score — Windows | |
|---|---|
| Intel Core i7-2600 |
786 2.941 |
| Intel Core 2 Duo E6600 |
321 549 |
In single core, the difference is 145%. In multi-core, the differential gap is 436%.
On Linux:
| Geekbench 5 — Multi-core & single core score — Linux | |
|---|---|
| Intel Core i7-2600 |
783 3.106 |
| Intel Core 2 Duo E6600 |
333 591 |
In single core, the difference is 135%. In multi-core, the differential gap is 426%.
Note: Commissions may be earned from the links above. These scores are only an
average of the performances got with these processors, you may get different results.
Geekbench 5 is a software for measuring the performance of a computer system, for fixed devices, mobile devices, servers. This platform makes it possible to better compare the power of the CPU, the computing power and to compare it with similar or totally different systems. Geekbench 5 includes new workloads that represent work tasks and applications that we can find in reality.
Equivalence:
Intel Core i7-2600 AMD equivalentIntel Core 2 Duo E6600 AMD equivalent
See also:
Intel Core i7-2600KIntel Core i7-2600S
Ryzen 5 2600 vs Core 2 Duo E8135
Availability
AMD Ryzen 5 2600 Processor with Wraith Stealth Cooler — YD2600BBAFBOX
Buy on Amazon
$190
In Stock
Updated 33 minutes ago
Availability
No items available
Key Differences
In short — Ryzen 5 2600 outperforms Core 2 Duo E8135 on the selected game parameters. We do not have the prices of both CPUs to compare value. The better performing Ryzen 5 2600 is 3334 days newer than Core 2 Duo E8135.
Advantages of AMD Ryzen 5 2600
- Performs up to 8% better in Call of Duty: Warzone than Core 2 Duo E8135 — 184 vs 170 FPS
- Can execute more multi-threaded tasks simultaneously than Intel Core 2 Duo E8135 — 12 vs 2 threads
Call of Duty: Warzone
Resolution
1920×1080
Game Graphics
Ultra
Ryzen 5 2600
Desktop • Apr 19th, 2018
FPS
184
100%
Value, $/FPS
$1. 03/FPS
100%
Price, $
$190
100%
FPS and Value Winner
AMD Ryzen 5 2600 Processor with Wraith Stealth Cooler — YD2600BBAFBOX
Buy for $190 on Amazon
In Stock
Updated 33 minutes ago
Core 2 Duo E8135
Mobile • Mar 3rd, 2009
FPS
170
92%
Value, $/FPS
Price, $
TOP 5 Games
Resolution
1920×1080
Game Graphics
Ultra
Ryzen 5 2600
Desktop • Apr 19th, 2018
Core 2 Duo E8135
Mobile • Mar 3rd, 2009
245
FPS
184
FPS
Grand Theft Auto V
266
FPS
195
FPS
Apex Legends
427
FPS
322
FPS
VALORANT
984
FPS
754
FPS
League of Legends
265
FPS
199
FPS
Fortnite
Geekbench 5 Benchmarks
Ryzen 5 2600
Desktop • Apr 19th, 2018
Single-Core
963
100%
Multi-Core
5235
100%
Core 2 Duo E8135
Mobile • Mar 3rd, 2009
Single-Core
366
-63%
Multi-Core
654
-600%
|
AMD Ryzen 5 2600 |
vs |
Intel Core 2 Duo E8135 |
|---|---|---|
|
Apr 19th, 2018 |
Release Date | Mar 3rd, 2009 |
| Ryzen 5 | Collection | Core 2 Duo |
| Pinnacle Ridge | Codename | Penryn |
| AMD Socket AM4 | Socket | Intel Socket P |
|
Desktop |
Segment |
Mobile |
|
6 |
Cores | 2 |
|
12 |
Threads | 2 |
|
3. |
Base Clock Speed | 2.7 GHz |
| 3.9 GHz | Turbo Clock Speed | Non-Turbo |
| 65 W | TDP | Not Available |
|
12 nm |
Process Size | 45 nm |
|
34.0x |
Multiplier | 10.0x |
| None | Integrated Graphics | None |
|
Yes |
Overclockable | No |
 4 GHz
4 GHzBuilds Using Ryzen 5 2600 or Core 2 Duo E8135
Call of Duty: Warzone, 1080p, High
SkyTech Blaze II Gaming Computer PC
91
FPS
$
10.2
/FPS
GeForce GTX 1650
Ryzen 5 2600
8 GB, N/A Storage
Buy on Amazon
$928
In Stock
Updated 28 minutes ago
SkyTech Blaze II Gaming Computer PC
101
FPS
$
9. 6
6
/FPS
GeForce GTX 1660
Ryzen 5 2600
8 GB, N/A Storage
Buy on Amazon
$969.99
In Stock
Updated 28 minutes ago
SkyTech Blaze II Gaming Computer PC
105
FPS
$
10.48
/FPS
GeForce GTX 1660 SUPER
Ryzen 5 2600
16 GB, N/A Storage
Buy on Amazon
$1,099.99
In Stock
Updated 29 minutes ago
SkyTech Blaze II Gaming Computer PC
107
FPS
$
9.35
/FPS
GeForce GTX 1660 Ti
Ryzen 5 2600
8 GB, N/A Storage
Buy on Amazon
$999.99
In Stock
Updated 28 minutes ago
SkyTech Blaze II Gaming Computer PC
101
FPS
$
12. 67
67
/FPS
GeForce GTX 1660
Ryzen 5 2600
16 GB, N/A Storage
Buy on Amazon
$1,279.99
In Stock
Updated 29 minutes ago
Allied Gaming Patriot Desktop PC
114
FPS
$
9.82
/FPS
GeForce RTX 2060
Ryzen 5 2600
16 GB, 480 GB SSD
Buy on Amazon
$1,119
In Stock
Updated 29 minutes ago
Select from the most popular similar processor comparisons. Most compared processor combinations, including the currently selected ones, are at the top.
Ryzen 5 2600
Ryzen 7 5700G
$178.61
Core 2 Duo E8135
N/A Stock
Ryzen 7 5700G
$178.61
Ryzen 5 2600
Ryzen 5 5600
$154.95
Core 2 Duo E8135
N/A Stock
Ryzen 5 5600
$154. 95
95
Ryzen 5 2600
Ryzen 7 5700X
Core 2 Duo E8135
N/A Stock
Ryzen 7 5700X
Ryzen 5 2600
Ryzen 5 5600X
$223.99
Core 2 Duo E8135
N/A Stock
Ryzen 5 5600X
$223.99
Ryzen 5 2600
Core i5-12400
$189.99
Intel Core i7-2600 Processor Overview
Description
Specifications
| Release Year | 2011 |
| Segment | for desktop computers |
| Socket | Socket LGA 1155 |
| Number of cores | 4 |
| Number of threads | 8 |
| Base frequency | 3400 MHz |
| Turbo Core | 3800 MHz |
| L1/L2/L3 cache | 256Kb/1Mb/8Mb |
| Unlocked multiplier | no |
| Architecture (core) | Sandy Bridge |
| Process | 32nm |
| Integrated video core | Intel HD2000 |
Max. memory frequency memory frequency |
DDR3 1333Mhz |
| Max. memory size | 32Gb |
| TDP | 95W |
| Max. temperature | 72C |
| Windows 11 support | no |
Supported instructions: MMX, SSE, SSE2, SSE3, SSSE3, SSE4 (SSE4.1 + SSE4.2), AES, AVX, F16C, EM64T, NX, VT, Hyper-Threading, Turbo Boost 2.0
Supported operating systems: Windows XP, Vista, 7, 10 x86-x64, Linux x86-x64
Intel Core i7-2600 processor overview
The processor was released in 2011 for motherboards with Socket LGA 1155. The model belongs to the high-performance CPU in the line of the second generation of Intel Core processors, has 4 cores / 8 threads with frequencies of 3400 -3800 megahertz and 95W heat dissipation, which will require a good cooling system (up to 120W). The Intel Core i7-2600 is made according to the technological standards of 32nm and carries the Sandy Bridge architecture. At the time of its introduction, this processor was considered a high-performance gaming option. Currently, an Intel Core i7-2600 paired with a fairly powerful graphics card (Radeon RX470, GeForce GTX960 and older), at least 8 gigabytes of RAM, at 1080p resolution (1920 * 1080) and medium-high graphics settings, it can provide quite good performance (40-50 frames, with a drawdown of up to 35 frames per second in complex scenes) even in demanding projects the level of Cyberpunk 2077 and Red Dead Redemption 2. In older games like GTA V and Tomb Raider 2013, the Intel Core i7-2600 will give a comfortable number of frames per second (50fps +) at maximum graphics settings. This CPU can easily cope with office tasks, providing comfortable work in standard Windows and Office applications, surfing the Internet.
Comparative performance table Intel Core i7-2600
This table summarizes the results of tests of the overall performance of the processor in question, the nearest junior and senior models of the line (if any), predecessor and successor (if any), as well as the capabilities of the nearest competitor models:
| Positioning | CPU Model | PassMark |
| Test piece | Intel Core i7-2600 | 5324 points |
| Junior model | Intel Core i7-2600S | 4355 points |
| Older model | Intel Core i7-2600K | 5451 points |
| Closest competitor | AMD FX 8320 | 5399 points |
Intel Core i7-2600 Game Test:
What motherboards is compatible with:
The sample in question is fully compatible with motherboards equipped with Socket LGA 1155 and built on chipsets (logic sets) H67, B65 and H67.
Appearance of Socket LGA 1155.
p.s. If possible, use RAM in dual-channel mode (two identical strips), this will give the system additional performance.